. 2019 Sep 1;33(17-18):1221-1235.
doi: 10.1101/gad.328492.119. Epub 2019 Aug 1.

The RNA hairpin binder TRIM71 modulates alternative splicing by repressing MBNL1

Affiliations

The RNA hairpin binder TRIM71 modulates alternative splicing by repressing MBNL1

Thomas Welte et al. Genes Dev. .

Abstract

TRIM71/LIN-41, a phylogenetically conserved regulator of development, controls stem cell fates. Mammalian TRIM71 exhibits both RNA-binding and protein ubiquitylation activities, but the functional contribution of either activity and relevant primary targets remain poorly understood. Here, we demonstrate that TRIM71 shapes the transcriptome of mouse embryonic stem cells (mESCs) predominantly through its RNA-binding activity. We reveal that TRIM71 binds targets through 3' untranslated region (UTR) hairpin motifs and that it acts predominantly by target degradation. TRIM71 mutations implicated in etiogenesis of human congenital hydrocephalus impair target silencing. We identify a set of primary targets consistently regulated in various human and mouse cell lines, including MBNL1 (Muscleblind-like protein 1). MBNL1 promotes cell differentiation through regulation of alternative splicing, and we demonstrate that TRIM71 promotes embryonic splicing patterns through MBNL1 repression. Hence, repression of MBNL1-dependent alternative splicing may contribute to TRIM71's function in regulating stem cell fates.

Keywords: 3′ UTR; 5′ UTR; LIN41; RNA-binding protein; TRIM71; alternative splicing; mRNA degradation; muscleblind; stem cell; translational repression.


Figures

Figure 1.
Figure 1.
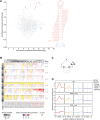
TRIM71 acts primarily by repressing target transcripts through binding of 3′ UTRs. (A) Schematic view of TRIM71 domain structure with associated functions. Point mutations generated in this study are indicated; the shorthand name is in bold. (B) PCA plot of RNA sequencing (RNA-seq) data of experiments with WT and mutant mESCs. WT and Trim71 knockout: n = 10 biological replicates. A Trim71 knockout outlier replicate with small library size is shown with reduced opacity. Trim71 NHL_mut and RING_mut: n = 5 biological replicates. A corresponding correlation matrix is shown in Supplemental Figure S1F. (C) Scatter plots and correlation matrix showing Pearson's correlation coefficients between CRAC-seq (cross-linking and analysis of cDNAs [CRAC] combined with sequencing) biological replicates based on transcript read counts. (D) Scatter plot showing differential gene regulation in Trim71 knockout versus WT mESCs (n = 10 biological replicates) versus total transcript CRAC-seq enrichment. n = 4 biological WT TRIM71 CRAC-seq replicates, summed by transcript and divided by RPKMs (reads per kilobase per million mapped reads) from n = 3 RNA-seq experiments in WT mESCs. Transcripts with high (red; quantile ≥ 0.98) and medium (orange; quantile 0.95–<0.98) TRIM71 binding are indicated. For regression analysis, a natural regression spline is fitted, with knots at enrichment values of 1–5 (black line). Data source: Supplemental Table S5. (E) Metaplot of mean CRAC-seq coverage around transcript start and stop codons in WT, RING_mut, and NHL_mut mESCs (all replicates combined). (F) Stacked bar chart showing fractions of CRAC-seq reads by genomic regions in WT, RING_mut, and NHL_mut mESCs (all replicates combined). (G) Scatter plot showing the correlation of ribosome profiling (Ribo-seq) versus transcript (RNA-seq) fold changes between Trim71 knockout and WT mESCs (n = 4 biological replicates); 12,718 genes were quantified (marked in gray). Significantly differentially regulated (“Sign. change RNA”; false discovery rate [FDR] < 0.05) genes on the RNA level are marked in blue. n = 2954. Significantly differentially translated (“Sign. change TE”; FDR < 0.05) genes are marked in red. n = 2. Transcripts regulated by degradation are expected to be up-regulated in both RNA-seq and Ribo-seq (blue arrow). Targets regulated by pure translational inhibition are expected to be up-regulated in Ribo-seq only (red arrow). Data source: Supplemental Table S3.
Figure 2.
Figure 2.
TRIM71 binds cellular transcripts through mRNA hairpin motifs. (A) Scatter plot showing enrichment of 11-mer structure motifs in TRIM71-bound 50-nt windows versus their occurrence in TRIM71-unbound 50-nt windows. Data source: Supplemental Table S4. The top 20 enriched motifs are highlighted in red. Corresponding dot bracket strings reveal a stem–loop motif with a loop of 3 nt. Structures containing a loop with 4, 5, or 6 nt (highlighted in cyan, blue, and purple) are not enriched. (B) Heat map showing median-normalized CRAC-seq enrichment values (red to blue color) for groups of predicted 3-nt hairpins; 1536 unique hairpins are vertically ordered by pairing probability in the stem (binned in four groups on log2 scale; grayscale at the left of the heat map) and nucleotide pairing in the loop-proximal stem position (“position −1, +1”; six sequence features; indicated at the right of the heat map). Nucleotide sequence in the loop (“positions I, II, and III”; 64 sequence features) is used for horizontal ordering and is indicated at the bottom of the heat map; purine bases (A/G) at the last position in the loop (position III) are colored in red. (C) Graph displaying structural and sequence features of the TRIM71 response element. (D) Metaplot showing total CRAC-seq read depth around predicted hairpin motifs with varying motif strength according to sequence features identified for C. elegans LIN-41 in Trim71 WT, RING_mut, and NHL_mut mESCs. For each plot, reads were normalized to the depth at position −50.
Figure 3.
Figure 3.
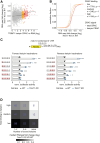
Repression efficacy correlates with the number of TRIM71-bound hairpins. (A) Scatter plot showing differential gene regulation in Trim71 knockout versus WT mESCs (n = 10 biological replicates) versus hairpin CRAC-seq enrichment (from n = 4 biological replicates in 100-nt windows around hairpins, summed by transcript and divided by RPKMs from n = 3 RNA-seq experiments in WT mESCs). Transcripts with high (red) and medium (orange) TRIM71 binding are indicated. This assignment and regression analyses were done as described in Figure 1D. (B) Cumulative density functions showing similar transcript repression efficacy in respective binding categories for total CRAC-seq enrichment and hairpin CRAC-seq enrichment. Significance was tested with a two-sided Kolmogorov-Smirnov test between total CRAC and hairpin CRAC for each binding category as defined in A. (C) Luciferase reporter gene assay with Renilla::mab-10 condensed 3′ UTR and hairpin inactivation mutants in WT and Trim71 knockout mESCs. Data were normalized to WT and represent mean ± SEM. n = 6 biological replicates. Significance was tested using a two-tailed Student's t-test. (*) P < 0.05; (**) P < 0.01; (***) P < 0.001; (ns) not significant (P ≥ 0.05). (D) Heat map showing median differential gene regulation in Trim71 knockout versus WT mESCs (n = 10 biological replicates) for transcripts grouped by total TRIM71 binding to all hairpins and the number of bound hairpins. Hairpin binding categories are as in A. Bound hairpins per transcript are defined as hairpins with at least half as many CRAC-seq read counts as the hairpin with the highest CRAC-seq read count. Color gradient represents the median RNA-seq (log2) fold change of Trim71 knockout versus WT mESCs in each group. Numbers of transcripts in each group are indicated in purple. Data source for A, B, and D: Supplemental Table S5.
Figure 4.
Figure 4.
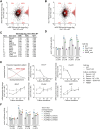
Identification of a core set of TRIM71 target candidates in mouse and human cell lines. (A,B) Scatter plot of differential gene expression in Trim71 knockout versus WT in mESCs and Ne4C cells (A) and Trim71 knockout versus WT in mESCs and Huh-7 cells (B). TRIM71-bound genes (top 5% total CRAC-seq enrichment) with significant expression change (FDR < 0.05) are shown in red (or black if not bound). Red numbers indicate the number of significantly differentially expressed TRIM71-bound transcripts in each quadrant as a percentage of all TRIM71-bound transcripts, including those not significantly expressed. (C) “Core” TRIM71 target candidates. Significantly up-regulated (FDR < 0.05; log2 fold change ≥0.5 in Trim71 knockout vs. WT mESCs, Ne4C cells, and Huh-7 cells) TRIM71-bound genes (as defined in A) were ranked descending according to CRAC enrichment. (D) Luciferase reporter gene assay with Renilla::Mbnl1, Plxnb2, and Mllt1 3′ UTR constructs in the indicated mESC lines. Data were normalized to WT and represent mean ± SEM. n = 3 biological replicates. (E, top left panel) Schematic view of expected gene expression levels in WT (straight lines) and Trim71 knockout (dashed lines) cells for Trim71 (black) and TRIM71 (red) targets over the course of differentiation. (All other panels) mRNA profiles during neuronal differentiation of WT and Trim71 knockout mESCs measured by RT-qPCR. Cell culture medium conditions for the five differentiation steps (I–V) are indicated. Trim71, Mbnl1, Plxnb2, Mllt1, and Pou5f1 levels were tested. Values were normalized to Eif5 and are shown relative to expression levels in WT mESCs. Data represent mean ± SEM. n = 2 biological replicates. (F) Luciferase reporter gene assay with Renilla::Mbnl1, Plxnb2, and Mllt1 3′ UTR constructs in Trim71 knockout mESCs overexpressing HsTRIM71 (positive control), mCherry (negative control), HsTRIM71 R751A, R608H, or R796H. Data were normalized to HsTRIM71-overexpressing cells and represent mean ± SEM. n = 3 biological replicates. Data source for AC: Supplemental Table S5. Significance in D and F was tested as in Figure 3C.
Figure 5.
Figure 5.
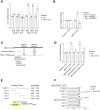
Repression of Mbnl1 by TRIM71 is mediated by a 3′ UTR hairpin. (A) Luciferase reporter gene assay with Renilla::Pou5f1 3′ UTR (negative control) and Renilla::Mbnl1 in WT and Trim71 knockout mESCs, Ne4C cells, and Huh-7 cells. Data were normalized to WT and represent mean ± SEM. n = 3 biological replicates. (B) Luciferase reporter gene assay with Renilla::Pou5f1 3′ UTR (negative control) and Renilla::Mbnl1 in WT mESCs expressing mCherry (WT + mCherry), Trim71 knockout cells expressing mCherry (KO + mCherry), and Trim71 knockout cells overexpressing HsTRIM71 (KO + HsTRIM71). Data were normalized to “WT + mCherry” levels and represent mean ± SEM. n = 3 biological replicates. (C) Integrative Genomics Viewer snapshot showing merged reads from four TRIM71 WT CRAC-seq experiments aligned to the Mbnl1 3′ UTR. Stretches 1 and 2 (boxed in gray) were chosen for deletion mutants. Predicted strong, medium, and weak/minimal hairpin motifs are shown as vertical lines and colored according to strength. (D) Luciferase reporter gene assay with Mbnl1 3′ UTR deletion mutants. Data were normalized to WT and represent mean ± SEM. n = 3 biological replicates. (E) Schematic view of stretch 1 and the four stretch 1 parts. Part 2 contains a predicted hairpin motif. All stretches were cloned into the Pou5f1 3′ UTR luciferase reporter gene construct. (F) Luciferase reporter gene assay with Mbnl1 3′ UTR insertion constructs. Data were normalized to WT and represent mean ± SEM. n = 3 biological replicates. Data for “Pou5f1 3′ UTR” are identical in D and F, as experiments were performed together. Significance in A, B, D, and F was tested as in Figure 3C.
Figure 6.
Figure 6.
MBNL1 is a primary TRIM71 target. (A, top panel) Quantification of RNA immunoprecipitating with 3xFlag-AVI-TRIM71 by RT-qPCR. Data were normalized to WT mESC input levels and represent mean ± SEM. n = 3 technical replicates. (Bottom panel) Western blot of the RNA coimmunoprecipitation experiment. 3xFlag-AVI-tagged TRIM71 migrates more slowly than WT TRIM71, and its recognition by the TRIM71 antibody is impaired (asterisk). Second biological replicate of RNA coimmunoprecipitation (Supplemental Fig. S3E). (B) RT-qPCR for Mbnl1 in WT, Trim71 knockout, and Mbnl13′UTR(mut) mESCs. Data were normalized to WT and represent mean ± SEM. n = 4 biological replicates. Significance was tested as in Figure 3C. Data are an excerpt of Supplemental Figure S4B. (C) Schematic view of TRIM71-dependent Mbnl1 repression. Mbnl1 WT 3′ UTR is bound by TRIM71, leading to repression. In Trim71 knockout cells, Mbnl1 is not repressed. Mbnl1 lacking the hairpin region in the 3′ UTR is impaired for binding and repression by TRIM71.
Figure 7.
Figure 7.
TRIM71 modulates alternative splicing by repressing MBNL1. (A) Heat map of differences in PSI values in Trim71 knockout, Mbnl13′UTR(mut), and Mbnl1O/Ex mutants relative to WT cells. (B, top panel) Correlation of differences in PSIs of Trim71 knockout versus WT mESCs and differences in PSI of Mbnl13′UTR(mut) versus WT mESCs. Spearman's correlation coefficient ρ = 0.71. P < 2.2 × 10⁻¹⁶, one-sided binomial test between quadrants. A median squared error (between biological replicates for all conditions) of <40 was applied to filter out highly noisy events within the same condition, resulting in 3264 splice events. ΔPSIs of ≥10 or ≤−10 in Trim71 knockout versus WT and/or Mbnl13′UTR(mut) versus WT cells are colored in red and were used as input data for subsequent plots (965 splice events). (Bottom left panel) Correlation of differences in PSIs of Mbnl1O/Ex versus WT mESCs and differences in PSIs of Trim71 knockout versus WT mESCs. Spearman's correlation coefficient ρ = 0.67. P < 2.2 × 10⁻¹⁶, one-sided binomial test between quadrants. (Bottom right panel) Correlation of differences in PSIs of Mbnl1O/Ex versus WT mESCs and differences in PSIs of Mbnl13′UTR(mut) versus WT mESCs. Spearman's correlation coefficient ρ = 0.65. P < 2.2 × 10⁻¹⁶, one-sided binomial test between quadrants. Data source: Supplemental Table S6. (C) Validation of individual splice events by RT-qPCR. Data represent mean ± SEM. n = 3–4 biological replicates. Specificity of amplicons for individual splice isoforms was validated by sequencing. Significance of PSI change relative to WT mESCs was tested as in Figure 3C. Displayed Foxp1 data are an excerpt from Supplemental Fig. S4C.

Similar articles

Cited by

References

    1. Aeschimann F, Xiong J, Arnold A, Dieterich C, Großhans H. 2015. Transcriptome-wide measurement of ribosomal occupancy by ribosome profiling. Methods 85: 75–89. 10.1016/j.ymeth.2015.06.013 - DOI - PubMed
    1. Aeschimann F, Kumari P, Bartake H, Gaidatzis D, Xu L, Ciosk R, Großhans H. 2017. LIN41 post-transcriptionally silences mRNAs by two distinct and position-dependent mechanisms. Mol Cell 65: 476–489.e4. 10.1016/j.molcel.2016.12.010 - DOI - PubMed
    1. Aeschimann F, Neagu A, Rausch M, Großhans H. 2019. let-7 coordinates the transition to adulthood through a single primary and four secondary targets. Life Sci Alliance 2: e201900335. 10.26508/lsa.201900335 - DOI - PMC - PubMed
    1. Batra R, Charizanis K, Manchanda M, Mohan A, Li M, Finn DJ, Goodwin M, Zhang C, Sobczak K, Thornton CA, et al. 2014. Loss of MBNL leads to disruption of developmentally regulated alternative polyadenylation in RNA-mediated disease. Mol Cell 56: 311–322. 10.1016/j.molcel.2014.08.027 - DOI - PMC - PubMed
    1. Bibel M, Richter J, Lacroix E, Barde YA. 2007. Generation of a defined and uniform population of CNS progenitors and neurons from mouse embryonic stem cells. Nat Protoc 2: 1034–1043. 10.1038/nprot.2007.147 - DOI - PubMed

Publication types