. 2019 Oct 4;294(40):14562-14573.
doi: 10.1074/jbc.RA119.008544. Epub 2019 Aug 1.

A molecular triage process mediated by RING finger protein 126 and BCL2-associated athanogene 6 regulates degradation of G0/G1 switch gene 2

Affiliations

A molecular triage process mediated by RING finger protein 126 and BCL2-associated athanogene 6 regulates degradation of G0/G1 switch gene 2

Kenta Kamikubo et al. J Biol Chem. .

Abstract

Oxidative phosphorylation generates most of the ATP in respiring cells. ATP is an essential energy source, especially in cardiomyocytes because of their continuous contraction and relaxation. Previously, we reported that G0/G1 switch gene 2 (G0S2) positively regulates mitochondrial ATP production by interacting with FOF1-ATP synthase. G0S2 overexpression mitigates ATP decline in cardiomyocytes and strongly increases their hypoxic tolerance during ischemia. Here, we show that G0S2 protein undergoes proteasomal degradation via a cytosolic molecular triage system and that inhibiting this process increases mitochondrial ATP production in hypoxia. First, we performed screening with a library of siRNAs targeting ubiquitin-related genes and identified RING finger protein 126 (RNF126) as an E3 ligase involved in G0S2 degradation. RNF126-deficient cells exhibited prolonged G0S2 protein turnover and reduced G0S2 ubiquitination. BCL2-associated athanogene 6 (BAG6), involved in the molecular triage of nascent membrane proteins, enhanced RNF126-mediated G0S2 ubiquitination both in vitro and in vivo Next, we found that Glu-44 in the hydrophobic region of G0S2 acts as a degron necessary for G0S2 polyubiquitination and proteasomal degradation. Because this degron was required for an interaction of G0S2 with BAG6, an alanine-replaced G0S2 mutant (E44A) escaped degradation. In primary cultured cardiomyocytes, both overexpression of the G0S2 E44A mutant and RNF126 knockdown effectively attenuated ATP decline under hypoxic conditions. We conclude that the RNF126/BAG6 complex contributes to G0S2 degradation and that interventions to prevent G0S2 degradation may offer a therapeutic strategy for managing ischemic diseases.

Keywords: ATP; BCL2-associated athanogene 6; RING finger protein 126 (RNF126); hypoxia; ischemic heart disease; mitochondria; protein degradation; small interfering RNA (siRNA); ubiquitin ligase.


Conflict of interest statement

The authors declare that they have no conflicts of interest with the contents of this article

Figures
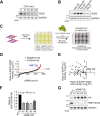
Figure 1.
Figure 1.
siRNA library screening of ubiquitin ligases for G0S2 degradation. A, immunoblot analysis of endogenous G0S2 protein half-life in neonatal rat cardiomyocytes. Cells were treated with cycloheximide (CHX) (100 μg/ml) at the indicated times. B, immunoblotting of cardiomyocytes treated with proteasome inhibitors (MG132: 10 μm; lactacystin: 10 μm; PS-341: 0.3 μm) or lysosomal inhibitors (chloroquine: 100 μm; NH4Cl: 10 mm). Four h after the treatment, cells were harvested and subjected to immunoblot analysis. C, schematic workflow of siRNA library screening. C2C12 cells stably expressing EGFP-fused G0S2 (C2C12/EGFP-G0S2 cells) or EGFP-fused CL1 degron peptide (C2C12/EGFP-CL1 cells) were transfected with the indicated siRNA. Seventy-two h after transfection, cells were imaged and fluorescence intensities of EGFP were analyzed by IN Cell Analyzer 6000. See also Fig. S1. D, distribution of siRNAs ranked according to values of log2 -fold change (FC) of EGFP-G0S2 intensity that is averaged and normalized to the siCTL in three independent experiments. Black and red dots represent negative and positive hits, respectively. E, scatter plot of the log2 -fold change (FC) of EGFP intensity in C2C12/EGFP-CL1 cells and the number of C2C12/EGFP-G0S2 cells, both averaged and normalized to the siCTL in three independent experiments. Each dot represents one siRNA pool targeting one gene. F, C2C12 cell lines stably expressing HA-tagged G0S2 (C2C12/HA-G0S2 cells) were transfected with 30 nm either siCTL or siRNF126, as indicated. After 48 h incubation, total RNA was extracted and analyzed by qPCR. Data represent mean values ± S.D. (n = 3). ***, p < 0.001. G, seventy-two h after transfection of siRNA as in (F), cells were harvested and subjected to immunoblot analysis. RNF126 was detected by a RNF126 #A antibody.
Figure 2.
Figure 2.
RNF126 regulates G0S2 protein degradation via ubiquitination. A, immunoblotting of RNF126 KO cells to confirm the CRISPR-Cas9-mediated genome editing. RNF126 was detected by an RNF126 B antibody. See also Fig. S2. B, immunoblotting of RNF126 KO cells or CTL cells stably expressing EGFP-G0S2 treated with cycloheximide (CHX) (100 μg/ml) at the indicated times. C, each protein level in (B) was densitometrically quantified (normalized to 0 min). The asterisks denote statistical significance comparing CTL and RNF126 KO cells. The data represent mean values ± S.D. (n = 3). *, p < 0.05. D, immunoblotting of RNF126 KO cells stably expressing EGFP-G0S2 with or without exogenous expression of human RNF126. E, immunoblotting of ubiquitinated HA-G0S2 enriched using tandem ubiquitin binding entity 2 (TUBE2) affinity pulldown in CTL, RNF126 KO, or RNF126 KO cells with exogenous expression of human RNF126. D and E, for the simultaneous detection of endogenous RNF126 and exogenous RNF126, RNF126 A antibody was used.
Figure 3.
Figure 3.
Knockdown of RNF126 in neonatal cardiomyocytes preserves mitochondrial ATP production under hypoxia. A, cardiomyocytes were transfected with 30 nm either siCTL or siRNF126, as indicated. After 48 h incubation, total RNA was extracted and analyzed by qPCR. Data represent mean values ± S.D. (n = 3). n.s., not significant; *, p < 0.05; **, p < 0.01. B, cardiomyocytes were expressed with the indicated siRNA for 72 h. Cells were harvested and subjected to immunoblotting. See also Fig. S3. C, representative YFP/CFP ratiometric pseudocolored images of Mit-ATeam fluorescence in cardiomyocytes expressing the indicated siRNA and adenoviral Mit-ATeam for 48 h. Scale bar, 10 μm. D, YFP/CFP emission ratio plots of Mit-ATeam fluorescence in cardiomyocytes transfected siCTL (n = 20), siRNF126 #1 (n = 20), or siRNF126 #4 (n = 20) during hypoxia. All measurements were normalized to the ratio at time 0 and compared between cardiomyocytes with siCTL, siRNF126 #1, and #4 at each time point. The asterisks denote statistical significance comparing siRNF126 and siCTL. Data represent mean values ± S.E. *, p < 0.05; **, p < 0.01; ***, p < 0.001.
Figure 4.
Figure 4.
BAG6 regulates G0S2 ubiquitination and degradation. A–E, the indicated siRNA was expressed for 72 h in (A) cardiomyocytes or (B–E) C2C12/HA-G0S2 cells. Cells were harvested and subjected to immunoblotting. C, cells were solubilized, and ubiquitinated proteins were enriched by TUBE pulldown assay. D, immunoblotting of cells that were treated with cycloheximide at the indicated times (0–120 min). E, each protein level in (D) was densitometrically quantified (normalized to 0 min) and is shown graphically. The asterisks denote statistical significance comparing siCTL- and siBAG6-treated cells. Data represent mean values ± S.D. (n = 3). *, p < 0.05; **, p < 0.01. F, representative YFP/CFP ratiometric pseudocolored images of Mit-ATeam fluorescence in cardiomyocytes expressing the indicated siRNA and adenoviral Mit-ATeam for 48 h. Scale bar, 10 μm. G, YFP/CFP emission ratio plots of Mit-ATeam fluorescence in cardiomyocytes transfected siCTL (n = 18), siBAG6 #1 (n = 20), or siBAG6 #3 (n = 20) during hypoxia. All measurements were normalized to the ratio at time 0 and compared between cardiomyocytes with siCTL, siBAG6 #1 and #3 at each time point. Data represent mean values ± S.E. n.s., not significant.
Figure 5.
Figure 5.
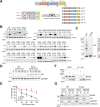
Mutation of the G0S2 degron inhibits its degradation by sequestering BAG6. A, schematic diagram of generated mutants. B, C2C12 cells were transfected with the indicated G0S2 mutants. After 4-h treatment with DMSO (D, 0.1%) or MG132 (MG, 10 μm), cells were harvested and subjected to immunoblot analysis. C, C2C12/HA-G0S2 WT or E44A cells were solubilized and ubiquitinated proteins were enriched by TUBE2 pulldown assay. D, C2C12/HA-G0S2 WT or E44A cells were treated with cycloheximide at the indicated times (0–120 min). E, each protein level in (D) was densitometrically quantified (normalized to 0 min) and is shown graphically. The asterisks denote statistical significance comparing C2C12/HA-G0S2 WT and E44A cells. Data represent mean values ± S.D. (n = 3). **, p < 0.01. F, immunoprecipitation of HA-G0S2 in HEK293T cells. Cells expressing HA-tagged G0S2 WT or E44A were harvested and immunoprecipitated with anti-HA antibody. G, C2C12 cells expressing HA-G0S2 WT or E44A were transfected with the indicated siRNA for 48 h. After solubilizing with the buffer containing 1% Triton X-100, lysates were centrifuged and the supernatant (S) and pellet (P) fractions were analyzed by immunoblotting. The pellet contains the detergent-insoluble protein aggregates. GAPDH and vimentin are used as the detergent-soluble and -insoluble fractions, respectively.
Figure 6.
Figure 6.
RNF126 directly ubiquitinates G0S2 in vitro in a BAG6-dependent manner. A, in vitro ubiquitination assay in the presence or absence of purified recombinant UBE1 (E1), UBCH5B (E2), GST-RNF126 (E3), and BAG6, together with His-tagged ubiquitin, ATP, and HA-G0S2 as a substrate. The mixture was incubated for 60 min at 37 °C, and the reaction was stopped by the addition of 3× sample buffer. See also Fig. S4. B, in vitro ubiquitination assay as in (A) except for the use of GST-RNF126 WT or C231A/C234A (CA) mutant, and HA-G0S2 WT, E44A, or lysine-less mutant (6KR).
Figure 7.
Figure 7.
Inhibition of G0S2 interaction with BAG6 leads to the preservation of mitochondrial ATP concentration in hypoxia. A, cardiomyocytes expressing G0S2 WT or E44A mutant were treated with proteasome inhibitors (MG132, 10 μm; lactacystin, 10 μm; PS-341, 0.3 μm) for 4 h. Cells were harvested and subjected to immunoblot analysis. B, immunoblotting of cells that were treated with cycloheximide at the indicated times (0–120 min). C, each protein level of (B) was densitometrically quantified (normalized to 0 min) and is shown graphically. The asterisks denote statistical significance comparing G0S2 WT- and E44A-expressing cells. The data represent mean values ± S.D. (n = 3). *, p < 0.05; ***, p < 0.001. D, representative YFP/CFP ratiometric pseudocolored images of Mit-ATeam fluorescence in cardiomyocytes expressing the G0S2 WT or E44A mutant and adenoviral Mit-ATeam for 48 h. Scale bar, 10 μm. E, YFP/CFP emission ratio plots of Mit-ATeam fluorescence in cardiomyocytes expressing lentivirus encoding LacZ (n = 19), G0S2 WT (n = 16), or G0S2 E44A (n = 20) and adenovirus encoding Mit-ATeam during hypoxia. All measurements were normalized to the ratio at time 0 and compared between cardiomyocytes with LacZ, G0S2 WT, and G0S2 E44A at each time point. The asterisks denote statistical significance comparing LacZ and G0S2 WT or E44A mutant. The daggers denote statistical significance comparing G0S2 WT and E44A mutant. Data are represented as the mean ± S.E. **, p < 0.01; ***, p < 0.001; , p < 0.05. F, the bar graph shows the cell death of cardiomyocytes overexpressing G0S2 WT or E44A under hypoxic conditions. Data are represented as the mean ± S.D. (n = 6). **, p < 0.01; ***, p < 0.001.

Similar articles

Cited by

References

    1. Semenza G. L. (2012) Hypoxia-inducible factors in physiology and medicine. Cell 148, 399–408 10.1016/j.cell.2012.01.021 - DOI - PMC - PubMed
    1. Papandreou I., Cairns R. A., Fontana L., Lim A. L., and Denko N. C. (2006) HIF-1 mediates adaptation to hypoxia by actively down-regulating mitochondrial oxygen consumption. Cell Metab. 3, 187–197 10.1016/j.cmet.2006.01.012 - DOI - PubMed
    1. Kim J. W., Tchernyshyov I., Semenza G. L., and Dang C. V. (2006) HIF-1-mediated expression of pyruvate dehydrogenase kinase: A metabolic switch required for cellular adaptation to hypoxia. Cell Metab. 3, 177–185 10.1016/j.cmet.2006.02.002 - DOI - PubMed
    1. Semenza G. L., Jiang B. H., Leung S. W., Passantino R., Concordet J. P., Maire P., and Giallongo A. (1996) Hypoxia response elements in the aldolase A, enolase 1, and lactate dehydrogenase A gene promoters contain essential binding sites for hypoxia-inducible factor 1. J. Biol. Chem. 271, 32529–32537 10.1074/jbc.271.51.32529 - DOI - PubMed
    1. Kioka H., Kato H., Fujikawa M., Tsukamoto O., Suzuki T., Imamura H., Nakano A., Higo S., Yamazaki S., Matsuzaki T., Takafuji K., Asanuma H., Asakura M., Minamino T., Shintani Y., et al. (2014) Evaluation of intramitochondrial ATP levels identifies G0/G1 switch gene 2 as a positive regulator of oxidative phosphorylation. Proc. Natl. Acad. Sci. U.S.A. 111, 273–278 10.1073/pnas.1318547111 - DOI - PMC - PubMed

Publication types

MeSH terms