. 2019 Aug 26;6(4):ENEURO.0448-18.2019.
doi: 10.1523/ENEURO.0448-18.2019. Print 2019 Jul/Aug.

Tmem119-EGFP and Tmem119-CreERT2 Transgenic Mice for Labeling and Manipulating Microglia

Affiliations

Tmem119-EGFP and Tmem119-CreERT2 Transgenic Mice for Labeling and Manipulating Microglia

Tobias Kaiser et al. eNeuro. .

Abstract

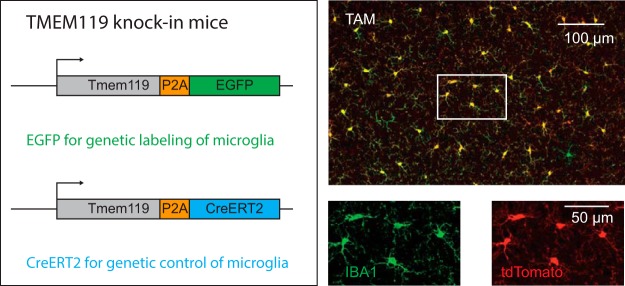
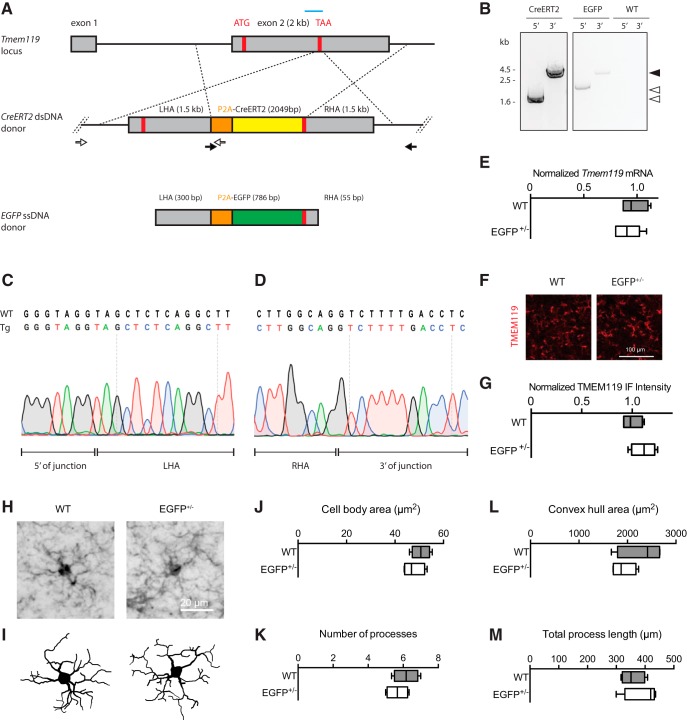
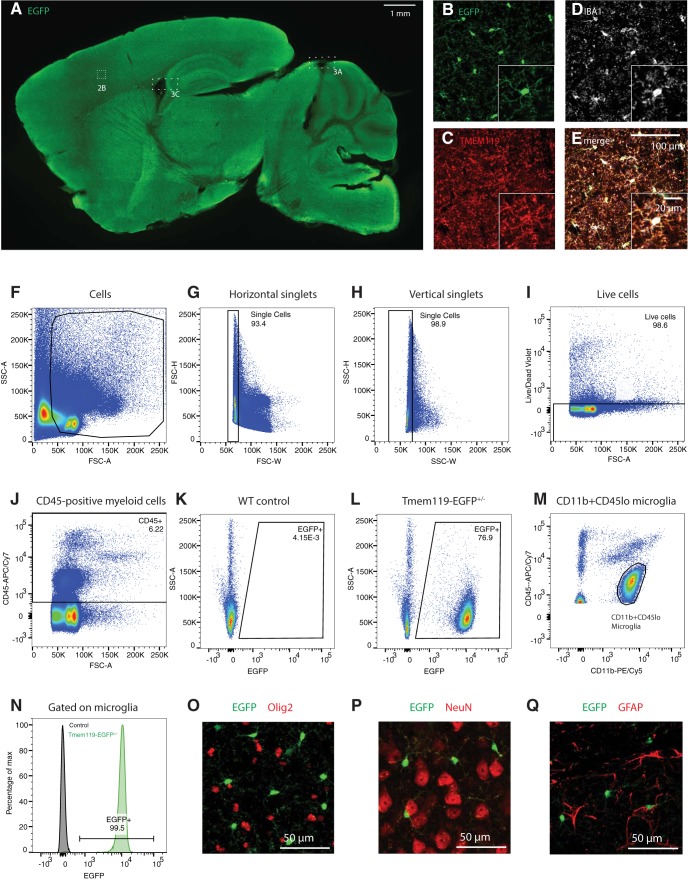
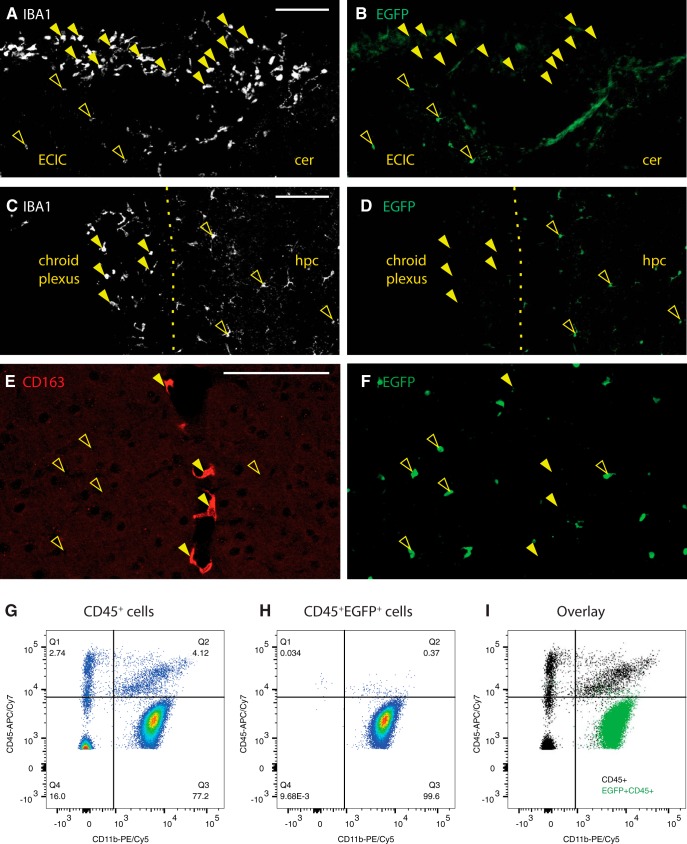
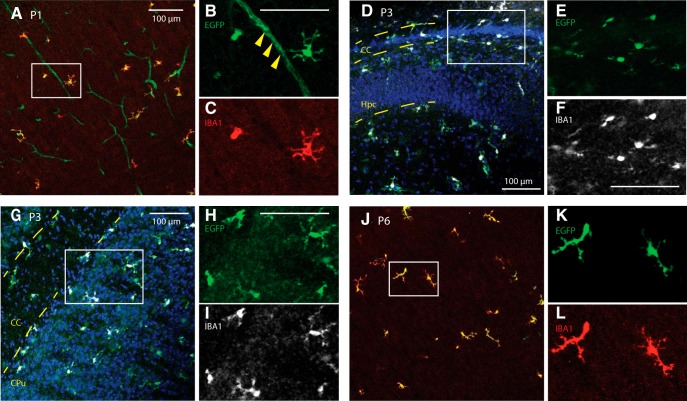
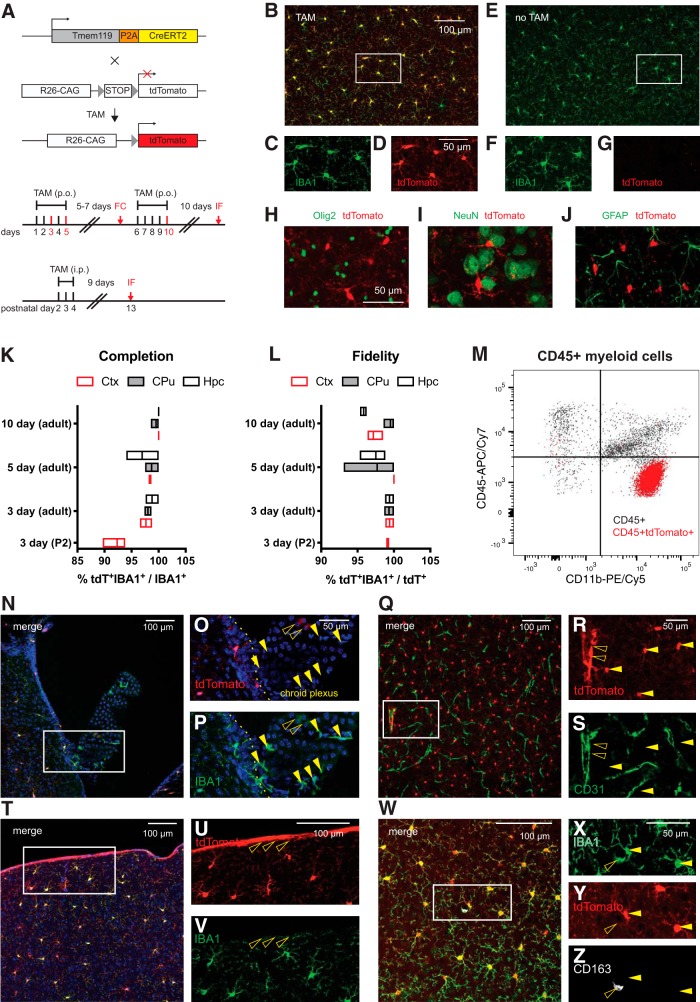
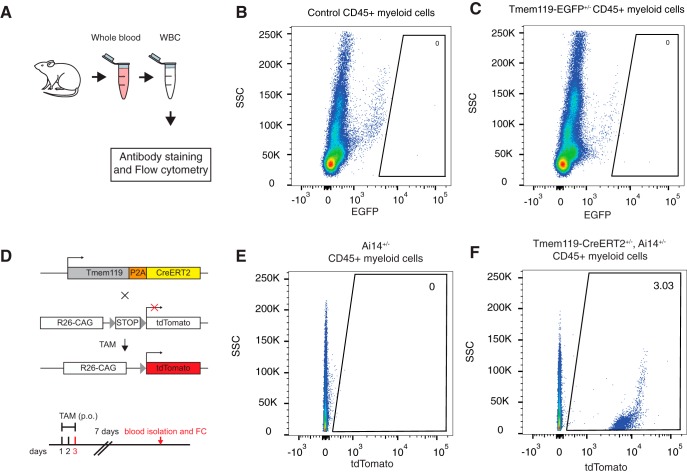
Microglia are specialized brain-resident macrophages with important functions in health and disease. To improve our understanding of these cells, the research community needs genetic tools to identify and control them in a manner that distinguishes them from closely related cell types. We have targeted the recently discovered microglia-specific Tmem119 gene to generate knock-in mice expressing EGFP (JAX#031823) or CreERT2 (JAX#031820) for the identification and manipulation of microglia, respectively. Genetic characterization of the locus and qPCR-based analysis demonstrate correct positioning of the transgenes and intact expression of endogenous Tmem119 in the knock-in mouse models. Immunofluorescence analysis further shows that parenchymal microglia, but not other brain macrophages, are completely and faithfully labeled in the EGFP-line at different time points of development. Flow cytometry indicates highly selective expression of EGFP in CD11b+CD45lo microglia. Similarly, immunofluorescence and flow cytometry analyses using a Cre-dependent reporter mouse line demonstrate activity of CreERT2 primarily in microglia upon tamoxifen administration with the caveat of activity in leptomeningeal cells. Finally, flow cytometric analyses reveal absence of EGFP expression and minimal activity of CreERT2 in blood monocytes of the Tmem119-EGFP and Tmem119-CreERT2 lines, respectively. These new transgenic lines extend the microglia toolbox by providing the currently most specific genetic labeling and control over these cells in the myeloid compartment of mice.

Keywords: CreERT2; EGFP; Tmem119; macrophage; microglia; transgenic.


Figures

None
Graphical abstract
Figure 1.
Figure 1.
Generation and validation of Tmem119-EGFP and Tmem119-CreERT2 knock-in lines. A, Experimental strategy using a guide RNA (blue bar) to introduce a double-strand break at the Tmem119 stop codon in mouse zygotes and an injection mixture containing EGFP ssDNA template with short homology arms of 55–300 bp or CreERT2 dsDNA template with long 1.5 kb homology arms. Each knock-in is designed to cause in-frame insertion of P2A peptide followed by EGFP or CreERT2 and a stop codon. Not drawn to scale. B, Confirmation of insertion by amplification of fragments spanning the 5′ and 3′ junctions using sets of primers binding inside the template and outside the homology arms (A, open and closed arrows with arrowheads indicating corresponding products). C, D, Sanger sequencing across the 5′ and 3′ junction of the CreERT2 line and comparison to WT sequence indicate seamless insertion in the transgenic mice (Tg). E, qPCR analysis of gene expression for Tmem119 in WT controls and Tmem119-EGFP+/− knock-in animals. N = 4 WT, N = 6 Tmem119-EGFP+/− mice. F, Representative TMEM119 immunoreactivity in WT controls and Tmem119-EGFP+/− knock-in animals. G, Relative intensity of TMEM119 immunostaining signal. N = 4 WT, N = 4 Tmem119-EGFP+/− mice. H, I, Representative IBA-immunostained microglia and corresponding Neurolucida traces in WT and Tmem119-EGFP+/− knock-in mice. JM, Quantified cell body area, number of processes, convex hull area, and total process length of microglia in WT and Tmem119-EGFP+/− knock-in mice. N = 12 microglia from four mice per genotype. TAA (red bar), stop codon.
Figure 2.
Figure 2.
EGFP labels microglia in all regions across the brain. A, Representative epifluorescence image of a sagittal section of a P25 Tmem119-EGFP+/− mouse stained with an anti-GFP antibody for improved signal-to-noise ratio (data for 1 of 3 mice shown). BE, High-power confocal micrographs of native EGFP fluorescence (B, green) in TMEM119 (C, red) and IBA1 (D, white) microglia in the cortical region outlined in A. FIJI-calculated composite image showing all three labels (E). Boxes 3A and 3B Boxes cross-reference areas shown in Figure 3. FJ, Flow cytometry analysis showing gating for of single, live, CD45-positive cells (1 of 3 independent experiments shown). Numbers in or adjacent to outlined areas indicate percentage cells in each gate. K, L, Representative density plots showing EGFP expression in WT and Tmem119-EGFP+/− mice (pre-gated on CD45+ cells). M, Representative density plot showing CD11b+CD45lo cells corresponding to microglia (pre-gated on CD45+ cells). N, Histogram showing fraction of CD11b+CD45lo microglia expressing EGFP. OR, Representative immunostaining for oligodendrocytes (O; Olig2, red), neurons (P; NeuN, red), and astrocytes (Q; GFAP, red) in EGFP-expressing Tmem119-EGFP+/− mice. One of three independent experiments shown.
Figure 3.
Figure 3.
EGFP discerns parenchymal microglia from other brain macrophages in the Tmem119-EGFP line. A, IBA1 labels meningeal macrophages and parenchymal microglia from the region indicate with a dashed box in Figure 2A. B, EGFP labels only parenchymal macrophages (open arrowheads), but not meningeal IBA1-positive macrophages (closed arrowheads). Diffuse fluorescence is associated with pia. ECIC, External cortex of inferior colliculus; Cer, cerebellum. Scale bar, 100 μm. C, D, Choroid plexus IBA1+ macrophages (closed arrowheads) from the region boxed in Figure 2A are not labeled with EGFP, whereas adjacent parenchymal microglia are (open arrowheads). Hpc, Hippocampus. Scale bar, 100 μm. E, F, Perivascular CD163-expressing macrophages (E, red, closed arrowheads) are not labeled with EGFP (F, green, open arrowheads). Scale bar, 100 μm. GI, Flow cytometry analysis of CD11b and CD45 expression in pre-gated single live CD45+ cells and EGFP-expressing CD45+ cells of Tmem119-EGFP+/− mice shown as density plots (G, CD45+ and H CD45+ EGFP+) and overlay (I, black CD45+, green CD45+ EGFP+). One of three independent experiments (N ≥ 3 mice per group) shown. Numbers in or adjacent to outlined areas indicate percentage cells in each gate.
Figure 4.
Figure 4.
Tmem119-EGFP mice label microglia at early postnatal stages. Sagittal slices from P1, P3, and P6 mice were stained against IBA1. AC, High-power confocal images of the somatosensory cortex show EGFP expression in IBA-positive cells and blood vessels at P1 (solid arrowheads in magnified panel). DF, Confocal micrographs around the forceps major of corpus callosum (CC) and hippocampus (Hpc) show EGFP-labeled, IBA1-positive microglia at P3. GI, Confocal micrographs of the striatum (CPu) and CC show EGFP labeling of IBA-positive cells at P3. JL, Confocal micrographs of the P6 cortex reveal EGFP-expression in IBA-immunostained cells. Error bars, 100 μm.
Figure 5.
Figure 5.
Tmem119-CreERT2 mice effectively recombine a conditional allele in microglia. A, Tmem119-CreERT2 mice were crossed to Ai14(RCL-tdT)-D mice and tamoxifen (TAM) was administered to induce tdTomato expression. Different sets of adult mice received tamoxifen per os (p.o.) for 3, 5, or 10 d and a set of neonatal mice received TAM for 3 d intraperitoneally (i.p). The mice were killed for flow cytometry (FC) 7 d after the 3 d dosing paradigm or for immunofluorescence (IF) 9 or more days after dosing. BD, Representative confocal micrograph showing tdTomato expression in IBA-positive microglia upon tamoxifen administration. EG, Absence of tdTomato expression in untreated animals. HJ, Representative immunostaining for oligodendrocytes (H, Olig2, green), neurons (I, NeuN, green), and astrocytes (J, GFAP, green) in tdTomato-expressing microglia of Tmem119-CreERT2+/−; Ai14(RCL-tdT)-D+/− mice. One of three independent experiments shown. K, L, Percentage completion (K) and fidelity (L) of the labeling in different brain regions for the different dosing schemes. Hpc, Hippocampus; CPu, caudate–putamen; Ctx, cortex. N = 2 mice for 3 d, 3 mice each for 5 and 10 d of TAM in adults, and 3 mice for 3 d administration at P2. Floating bars = min to max, line at mean. M, Flow cytometry analysis of CD11b and CD45 expression in pre-gated single live CD45+ cells and tdTomato-expressing CD45+ cells of Tmem119-CreERT2+/−; Ai14(RCL-tdT)-D+/− mice shown as overlay (I, black CD45+, red CD45+ tdTomato+). One of two representative experiments (N = 3 mice). NO, Confocal micrograph of the choroid plexus and adjacent parenchyma. QS, Confocal micrograph of CD31-immunostained blood vessels (green) shows tdTomato+ microglia (arrowheads) and tdTomato expression in a large blood vessel (open arrowhead). TV, Confocal micrograph showing tdTomato expression in cortical microglia and cells of the pia (open arrowheads). WZ, Confocal micrograph showing CD163- (white) and IBA1-expressing (green) macrophages. The open arrowhead indicates a tdTomato-CD163+IBA1+ perivascular macrophage. Closed arrowheads parenchymal microglia. One of three independent experiments shown (N = 3 mice).
Figure 6.
Figure 6.
Blood monocyte profiling in Tmem119 knock-in mice. A, Experimental approach for flow cytometry of monocytes isolated from whole blood. B, C, Representative flow cytometry analysis of EGFP expression in pre-gated single live CD45+ cells in WT control (B) and Tmem119-EGFP+/− mice (C). One of three experiments is shown (N = 3 mice). Numbers in or adjacent to outlined areas indicate percentage cells in each gate. D, Adult mice of Tmem119-CreERT2+/−; Ai14(RCL-tdT)-D+/− mice received tamoxifen (TAM) per os (p.o.) for 3 d. The mice were sacrificed 7 d after the last dose for flow cytometry (FC). E, F, Representative flow cytometry analysis of tdTomato expression in pre-gated single live CD45+ cells in Ai14(RCL-tdT)-D+/− (E) and Tmem119-CreERT2+/−; Ai14(RCL-tdT)-D+/− mice (F). One of two independent experiments is shown (N = 3 mice).

References

    1. Aguzzi A, Zhu C (2017) Microglia in prion diseases. J Clin Invest 127:3230–3239. 10.1172/JCI90605 - DOI - PMC - PubMed
    1. Bennett ML, Bennett FC, Liddelow SA, Ajami B, Zamanian JL, Fernhoff NB, Mulinyawe SB, Bohlen CJ, Adil A, Tucker A, Weissman IL, Chang EF, Li G, Grant GA, Hayden Gephart MG, Barres BA (2016) New tools for studying microglia in the mouse and human CNS. Proc Natl Acad Sci U S A 113:E1738–E1746. 10.1073/pnas.1525528113 - DOI - PMC - PubMed
    1. Butovsky O, Jedrychowski MP, Moore CS, Cialic R, Lanser AJ, Gabriely G, Koeglsperger T, Dake B, Wu PM, Doykan CE, Fanek Z, Liu L, Chen Z, Rothstein JD, Ransohoff RM, Gygi SP, Antel JP, Weiner HL (2014) Identification of a unique TGF-β–dependent molecular and functional signature in microglia. Nat Neurosci 17:131. 10.1038/nn.3599 - DOI - PMC - PubMed
    1. Buttgereit A, Lelios I, Yu X, Vrohlings M, Krakoski NR, Gautier EL, Nishinakamura R, Becher B, Greter M (2016) Sall1 is a transcriptional regulator defining microglia identity and function. Nat Immunol 17:1397–1406. 10.1038/ni.3585 - DOI - PubMed
    1. Clausen B, Burkhardt C, Reith W, Renkawitz R, Förster I (1999) Conditional gene targeting in macrophages and granulocytes using LysMcre mice. Transgenic Res 8:265–277. - PubMed

Publication types

LinkOut - more resources