. 2019 Aug 22;132(16):jcs230177.
doi: 10.1242/jcs.230177.

Myosin V regulates synaptopodin clustering and localization in the dendrites of hippocampal neurons

Affiliations

Myosin V regulates synaptopodin clustering and localization in the dendrites of hippocampal neurons

Anja Konietzny et al. J Cell Sci. .

Abstract

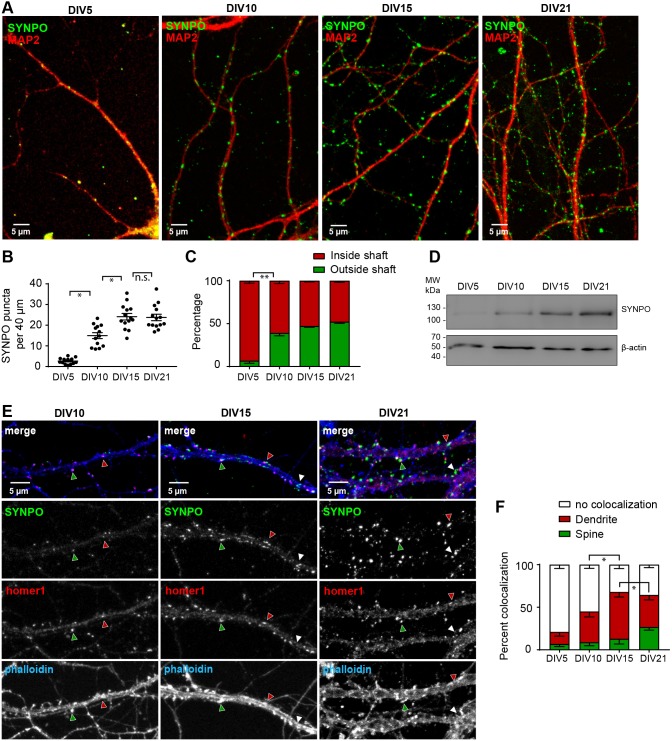
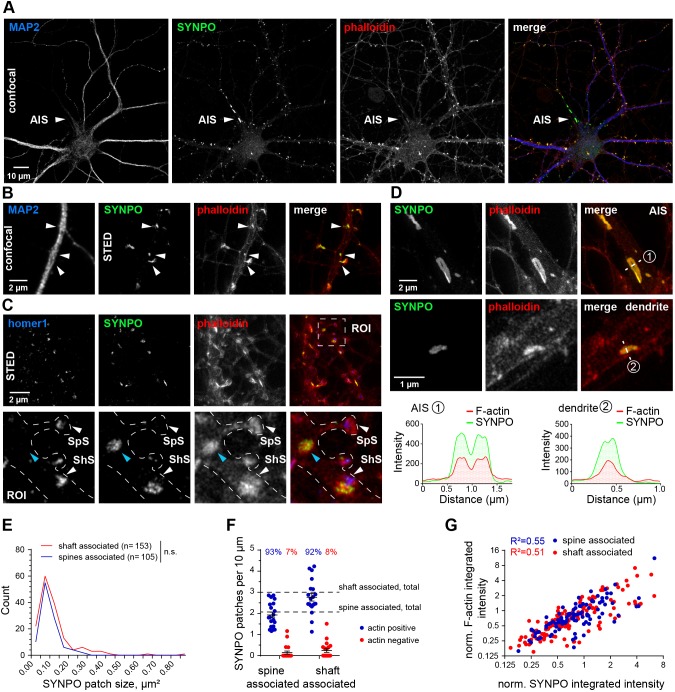
The spine apparatus (SA) is an endoplasmic reticulum-related organelle that is present in a subset of dendritic spines in cortical and pyramidal neurons, and plays an important role in Ca2+ homeostasis and dendritic spine plasticity. The protein synaptopodin is essential for the formation of the SA and is widely used as a maker for this organelle. However, it is still unclear which factors contribute to its localization at selected synapses, and how it triggers local SA formation. In this study, we characterized development, localization and mobility of synaptopodin clusters in hippocampal primary neurons, as well as the molecular dynamics within these clusters. Interestingly, synaptopodin at the shaft-associated clusters is less dynamic than at spinous clusters. We identify the actin-based motor proteins myosin V (herein referring to both the myosin Va and Vb forms) and VI as novel interaction partners of synaptopodin, and demonstrate that myosin V is important for the formation and/or maintenance of the SA. We found no evidence of active microtubule-based transport of synaptopodin. Instead, new clusters emerge inside spines, which we interpret as the SA being assembled on-site.

Keywords: Dendritic spines; F-actin; Myosin; Spine apparatus; Synaptopodin.


Conflict of interest statement

Competing interestsThe authors declare no competing or financial interests.

Figures

Fig. 1.
Fig. 1.
Myosin family proteins are novel interaction partners of synaptopodin. (A) SDS-polyacrylamide gel of the bio-GFP–synaptopodin (SYNPO) and bio-GFP (control) pulldown used for mass spectrometric analysis. Biotinylated GFP–synaptopodin was expressed in HEK293 cells and bound to Streptavidin beads. The beads were then incubated with rat brain lysate to pulldown brain-specific interactors of synaptopodin. (B) Network analysis of selected potential synaptopodin interactors identified in the mass spectrometry analysis (Table S1) using the online STRING analysis tool. Highlighted in blue are known synaptopodin-interacting proteins including actin (Actg1, Actb) and actinins (Actn2, Actn4). In red are myosins that were later tested positively in the co-immunoprecipitation shown in D. Line thickness indicates strength of data support. (C) Western blot analysis of bio-GFP–synaptopodin pulldown from brain lysate confirms interaction with myosin Va, Vb, VI and Id. Input, brain lysate; Strept-HRP, streptavidin coupled to horseradish peroxidase. Arrows indicate the expected molecular mass of bio-GFP–synaptopodin (upper) and bio-GFP (lower). (D) Western blot analysis of bio-GFP–synaptopodin pulldown probed for the presence of actin before and after incubation with brain lysate. Bio-GFP–synaptopodin-coupled beads are not enriched with myosin Va or actin coming from the HEK293 cells, but show association with myosin Va and actin specifically from brain lysate. BL, brain lysate. Beads w/o, bio-GFP–synaptopodin-coupled beads before incubation in brain lysate. Beads+BL, bio-GFP–synaptopodin-coupled beads after incubation in brain lysate. (E) Immunostaining of synaptosome-enriched fraction from rat brain. Synaptosomes were enriched from brain lysate using differential centrifugation and stained with antibodies against Shank3 (post-synaptic marker), synaptopodin and myosin V or VI. Both myosin V and VI could are found at synaptopodin- and Shank3-containing structures. Scale bar: 2 µm.
Fig. 2.
Fig. 2.
Expression and localization of synaptopodin during development in hippocampal primary neurons. (A) Representative confocal images of primary hippocampal neurons on DIV5, DIV10, DIV15 and DIV21 stained with anti-synaptopodin (SYNPO) and anti-MAP2 antibodies. Scale bars: 5 µm. (B) Quantification (mean±s.e.m.) of the average number of total synaptopodin puncta per 40 µm dendritic segments at DIV5, DIV10, DIV15 and DIV21. Kruskal–Wallis-Test with Dunnett's post hoc test *P=0.0493 (DIV5 vs DIV10), P=0.0421 (DIV10 vs DIV15); n.s., not significant. (C) Quantification (mean±s.e.m.) of synaptopodin puncta present inside or outside (spines, filopodia) of dendritic shafts. Kruskal–Wallis-Test with Dunnett's post hoc test **P=0.0077 (DIV5 vs DIV10). In B and C, DIV5, n=13 cells from three independent cultures with 44 dendritic segments counted; DIV10, n=14 cells from three independent cultures with 63 separate segments counted; DIV15, n=14 cells from two independent cultures with 93 separate segments counted; DIV21, n=16 cells from three independent cultures with 100 separate segments counted. (D) Immunoblot showing developmental expression of synaptopodin in primary hippocampal cultures. β-actin is used as loading control. (E) Representative confocal image of primary hippocampal neurons at DIV10, DIV15 and DIV21 stained with anti-synaptopodin, anti-homer1 and phalloidin–A647N. Red arrowheads, colocalization of synaptopodin and homer1 in dendrite; green arrowheads, colocalization in spine; White arrowheads, no colocalization. Scale bars: 5 µm. (F) Quantification (mean±s.e.m.) of the percentage of synaptopodin puncta colocalizing with homer1 in different dendritic subcompartments. Mixed ANOVA with DIV as between and localization as within group factors. F(4, 36)=4.4359, P=0.00512. Newman–Keuls post hoc test, *P=0.0348 (no coloc DIV10 vs DIV15), P=0.0435 (DIV15 vs DIV21 dendrite). DIV5, n=13 cells from three independent cultures with 44 separate segments counted; DIV10, n=8 cells from three independent cultures with 44 separate segments counted; DIV15, n=7 cells from two independent cultures with 35 separate segments counted; DIV21, n=8 cells from two independent cultures with 41 separate segments counted.
Fig. 3.
Fig. 3.
Synaptopodin is closely associated with F-actin in spines and inside dendritic shafts. (A) Confocal overview image of a DIV17 primary hippocampal neuron with F-actin stained by phalloidin–A647N and immunostaining of endogenous synaptopodin (SYNPO) and MAP2. White arrowheads indicate the AIS. Scale bar: 10 µm. (B) Confocal (MAP2) and STED image (phalloidin, synaptopodin) showing F-actin-enriched synaptopodin patches in spine necks and dendritic shafts. Scale bar: 2 µm. (C) Upper row, STED image of DIV17 hippocampal neuron stained for homer1, synaptopodin and F-actin (phalloidin). The box indicates the ROI shown in higher magnification in lower row. White arrowheads indicate homer1-positive synapses (SpS, spine synapse; ShS, shaft synapse). The shaft synapse is also associated with synaptopodin. Blue arrowheads indicate a dendritic synaptopodin cluster positive for F-actin but not associated with a synapse. Scale bar: 2 µm. (D) Comparison of the cisternal organelle found in the AIS (upper row) and dendritic synaptopodin patches (middle row). The lower row shows line profiles of phalloidin (F-actin) and synaptopodin intensity of the cisternal organelle (1) and dendritic synaptopodin patch (2). Scale bars: 2 µm (upper), 1 µm (middle). (E) Size distribution of synaptopodin patches associated with a synaptic spine or the dendritic shaft. Mann–Whitney U-test, P=0.35. Shaft-associated spots, n=153; spine-associated spots, n=105 from 20 dendritic segments of 17 neurons in two independent cultures. (F) Quantification of shaft- and spine-associated synaptopodin patches that are colocalizing with F-actin. n=20 dendritic segments of 17 neurons in two independent cultures. (G) Correlation of fluorescence intensity of synaptopodin and F-actin in shaft- and spine-associated synaptopodin patches. Shaft-associated patches: n=141; spine-associated patches, n=99; from 20 dendritic segments of 17 neurons in two independent cultures.
Fig. 4.
Fig. 4.
Myosin V but not myosin VI inhibition affects spine localization of synaptopodin puncta. (A) Representative confocal images of primary hippocampal neurons on DIV16 transfected with mCerulean (control) or Myosin-V-DN–mCerulean (MyoV DN) and stained with anti-synaptopodin (SYNPO) and anti-homer1 antibodies. Scale bar: 5 µm. (B) Quantification (mean±s.e.m.) of the number of total synaptopodin puncta (left), the number of homer1-positive spines containing synaptopodin (middle), and the total number of homer1-positive spines (right) per 40 µm dendritic segments in control and MyoV DN-expressing neurons. MyoV DN expression led to a decrease in total synaptopodin puncta (two-tailed unpaired t-test, *P=0.0218), and in puncta localizing to homer1-positive spines (two-tailed unpaired t-test, **P=0.0100), while the total number of spines was unchanged. MyoV DN, n=27 cells from four independent experiments with 51 segments counted. mCerulean, n=22 cells from four independent experiments with 54 segments counted. (C) Representative confocal image of primary hippocampal neurons on DIV16 transfected with mRuby2 (control) or GFP–Myosin-VI-dominant-negative (MyoVI DN) and stained with anti-synaptopodin and anti-MAP2 antibodies. Single-color channel and merged images are shown. Scale bar: 5 µm. (D) Quantification (mean±s.e.m.) of the number of total synaptopodin puncta (left), the number of homer1-positive spines containing synaptopodin (middle), and the total number of homer1-positive spines (right) per 40 µm dendritic segments in control and MyoVI DN-expressing neurons. Unpaired t-test (two-tailed) showed no significant change (ns). Left, Myo VI DN, n=21 cells from four independent experiments with 66 segments counted. Control, n=16 cells from four independent experiments with 40 segments counted. Middle and right, Myo VI DN, n=12 cells from two independent experiments with 21 segments counted. Control: n=10 cells from two independent experiments with 18 segments counted.
Fig. 5.
Fig. 5.
Myosin V inhibition affects the number of spines containing both synaptopodin and the ER. (A) Representative confocal images of primary hippocampal neurons on DIV17 transfected with an ER marker and a cell fill (YFP; control) or MyoV DN, stained with anti-synaptopodin (SYNPO) antibody. Arrows indicate dendritic spines that are positive for both synaptopodin and ER. Scale bars: 5 µm. (B) Quantification (mean±s.e.m.) of the number of synaptopodin puncta (left), the percentage of spines that are positive for both synaptopodin and ER (middle), and the number of spines per 40 µm (right). MyoV DN showed a decrease in total synaptopodin puncta (two-tailed unpaired t-test, *P=0.043) and in spines containing both synaptopodin and the ER (two-tailed unpaired t-test, *P=0.0481). Myo V DN, n=9 cells from two independent experiments with 22 segments counted. mCerulean, n=9 cells from two independent experiments with 23 segments counted. (C) Quantification (mean±s.e.m.) of the number of total synaptopodin puncta, the percentage of spines that are positive for both synaptopodin and ER, and the number of spines per 40 µm. Myo VI DN, n=10 cells from two independent experiments with 22 segments counted. Control, n=8 cells from two independent experiments with 22 segments counted. MyoVI DN had no significant effect on the measured parameters (ns).
Fig. 6.
Fig. 6.
Synaptopodin puncta are largely immobile and are generated de novo in dendritic spines, and synaptopodin turnover rate is affected by inhibition of myosin V, but not myosin VI. (A) 60 min time-lapse imaging of a primary hippocampal neuron (DIV17) expressing GFP–synaptopodin (SYNPO) and mRuby2. Images were acquired at a 2 min interval. White arrowheads indicate synaptopodin puncta that were stably localized over the entire imaging period. Blue arrowheads indicate puncta that moved over very short distances (<2 µm). Scale bar: 5 µm. Also see Movie 1. (B) Shown is the same neuron as in A. Left, image and kymograph of the main dendritic shaft (dashed line) in the synaptopodin channel over the 60 min imaging period. Right: After 60 min imaging, Lysotracker Green was added to the imaging medium and the cell was imaged for 15 s with a 1 s interval. The kymograph shows moving lysosomes in the previously imaged cell. Scale bars: 5 µm. (C) Example images from a 110 min time-lapse imaging of a primary hippocampal neuron (DIV15, outlined with a dashed white line) expressing GFP–synaptopodin. Images were acquired with a 5 min interval. Synaptopodin puncta can be observed gradually emerging in dendritic spines (white arrowheads). Scale bars: 2 µm. Also see Movie 2. (D) Analysis of synaptopodin dynamics using FRAP. Example images of a DIV17 primary hippocampal neuron expressing GFP–synaptopodin and mRuby2, before, during and after photobleaching of selected synaptopodin puncta (asterisks). (E) FRAP quantification for synaptopodin puncta localized in spines. Compared were fluorescence recovery rates in control (DMSO) and myosin V-inhibitor (MyoVin, 30 µM for 20 min) or myosin VI-inhibitor (TIP, 4 µM for 20 min) treated cells. In the analysis, only those puncta that recovered >10% of their initial fluorescence were considered. One-phase-association fits, n numbers and plateaus are indicated (DMSO 58±1, MyoVin 52±0.7, TIP 54±0.8). (F) FRAP quantification for synaptopodin puncta localized in the dendritic shaft. One-phase-association fits, n numbers and plateaus are indicated (DMSO 30±0.4, MyoVin 24±0.3, TIP 33±0.5). For E and F, repeated measures two-way ANOVA showed treatment did not lead to a significant difference. (G) Percentage of puncta that were considered ‘recovering’ (recovered>10% of their initial fluorescence). One-way ANOVA with Dunnett's post hoc test for DMSO vs MyoVin *P=0.0376. DMSO, n=3 independent experiments with 84 puncta analyzed; MyoVin, n=4 with 124 puncta analyzed; TIP, n=3 with 81 puncta analyzed. (H) Model summarizing the role of myosin V and synaptopodin interaction in localization of the SA to actin filaments associated with spine or shaft synapses. PSD, post-synaptic density; SA, spine apparatus; CO, cisternal organelle.

Similar articles

Cited by

References

    1. Asanuma K., Kim K., Oh J., Giardino L., Chabanis S., Faul C., Reiser J. and Mundel P. (2005). Synaptopodin regulates the actin-bundling activity of α-actinin in an isoform-specific manner. J. Clin. Invest. 115, 1188-1198. 10.1172/JCI200523371 - DOI - PMC - PubMed
    1. Aschenbrenner L., Lee T. T. and Hasson T. (2003). Myo6 facilitates the translocation of endocytic vesicles from cell peripheries. Mol. Biol. Cell 14, 2728-2743. 10.1091/mbc.e02-11-0767 - DOI - PMC - PubMed
    1. Avraham K. B., Hasson T., Steel K. P., Kingsley D. M., Russel L. B., Mooseker M. S., Copeland N. G. and Jenkins N. A. (1995). The mouse Snell's waltzer deafness gene encodes an unconventional myosin required for structural integrity of inner ear hair cells. Nature 11, 369-375. 10.1038/ng1295-369 - DOI - PubMed
    1. Balasanyan V. and Arnold D. B. (2014). Actin and Myosin-dependent localization of mRNA to dendrites. PLoS ONE 9, e92349 10.1371/journal.pone.0092349 - DOI - PMC - PubMed
    1. Bas Orth C., Schultz C., Müller C. M., Frotscher M. and Deller T. (2007). Loss of the cisternal organelle in the axon initial segment of cortical neurons in synaptopodin-deficient mice. J. Comp. Neurol. 504, 441-449. 10.1002/cne.21445 - DOI - PubMed

Publication types