. 2019 Aug 20;116(34):17051-17060.
doi: 10.1073/pnas.1902443116. Epub 2019 Aug 1.

Rhodopsin-based voltage imaging tools for use in muscles and neurons of Caenorhabditis elegans

Affiliations

Rhodopsin-based voltage imaging tools for use in muscles and neurons of Caenorhabditis elegans

Negin Azimi Hashemi et al. Proc Natl Acad Sci U S A. .

Abstract

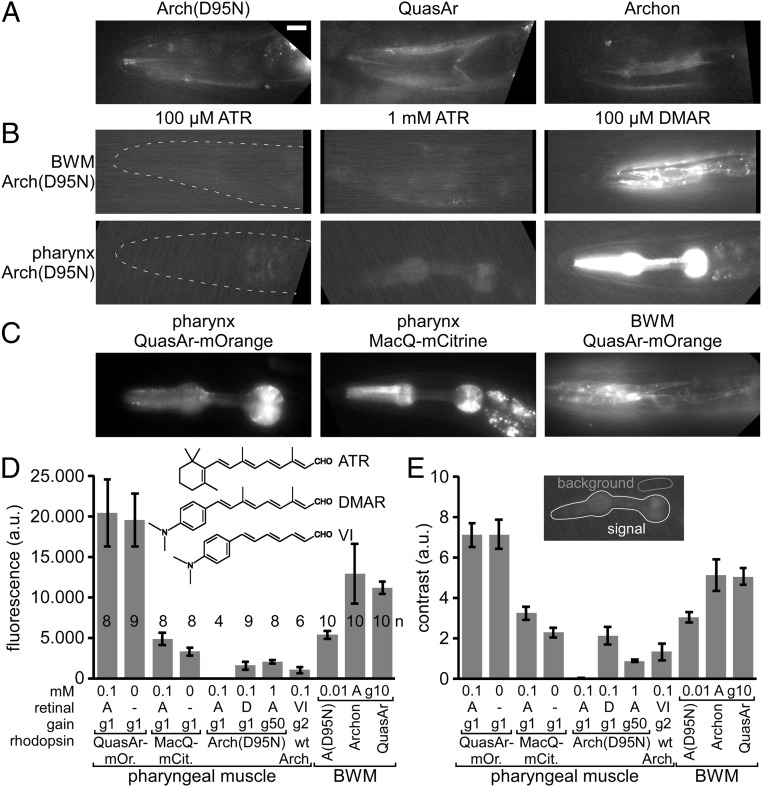
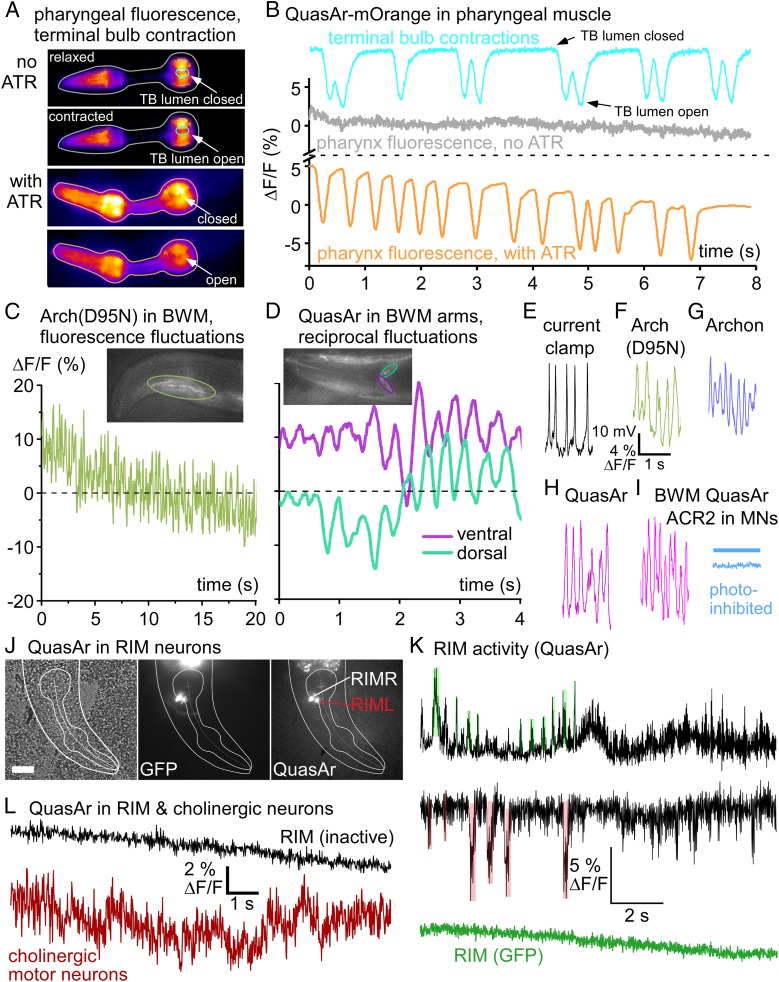
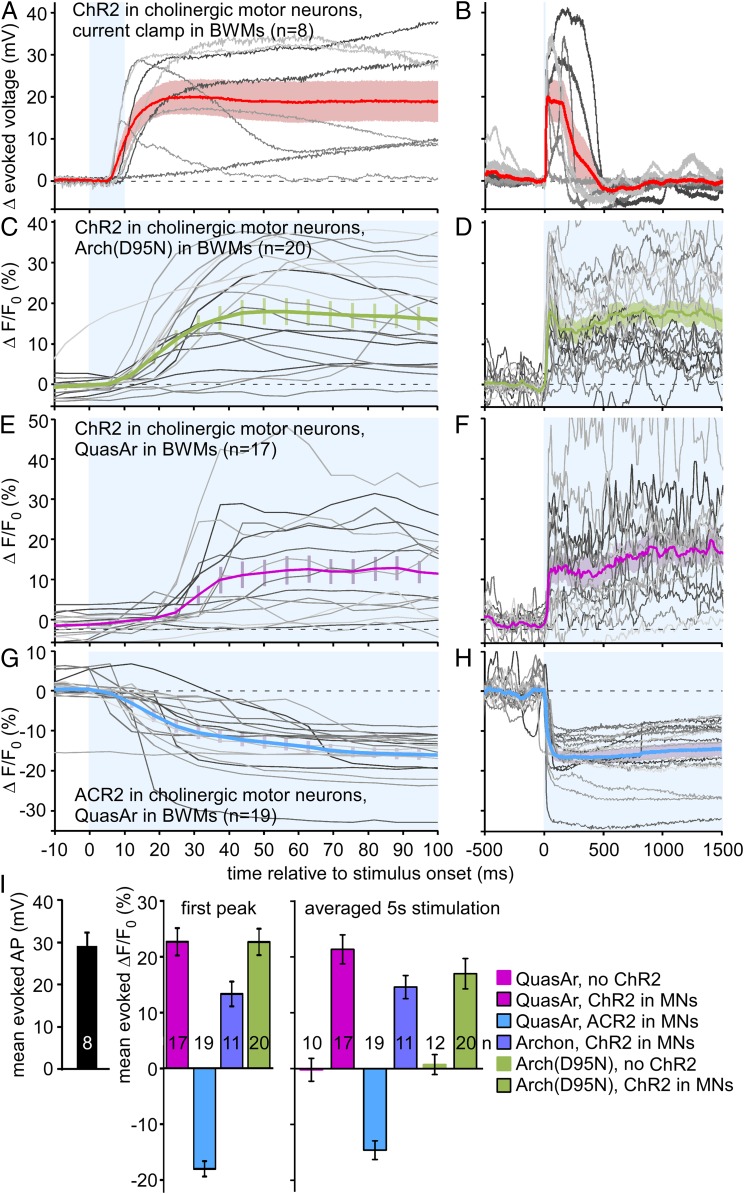
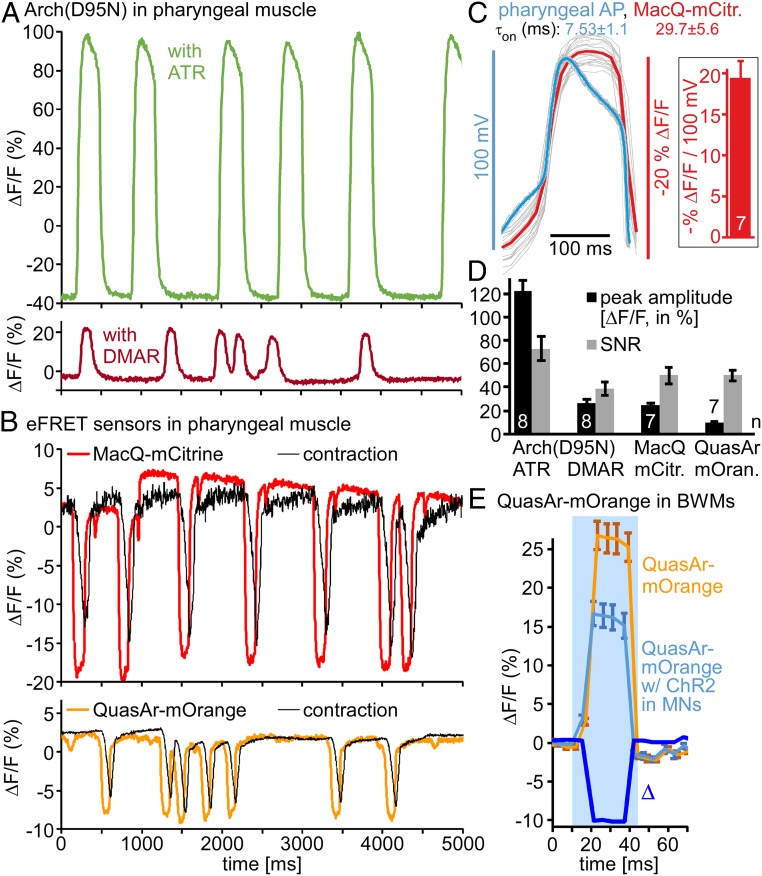
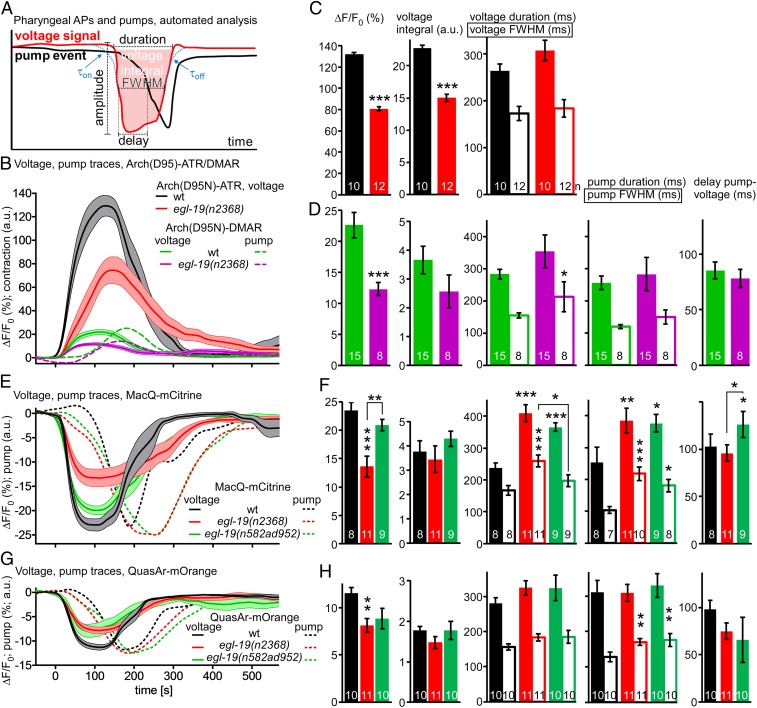
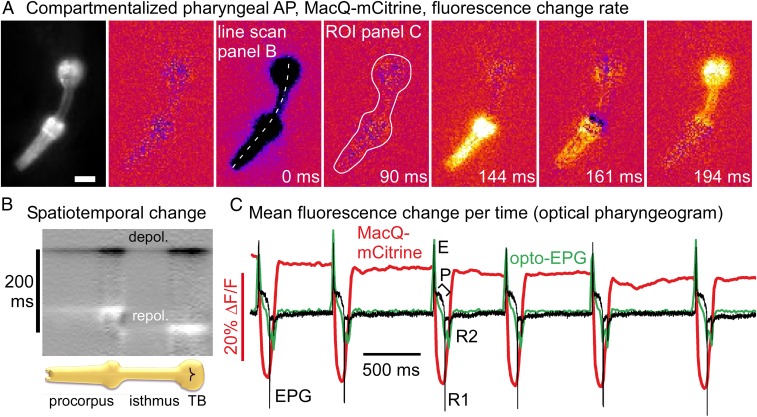
Genetically encoded voltage indicators (GEVIs) based on microbial rhodopsins utilize the voltage-sensitive fluorescence of all-trans retinal (ATR), while in electrochromic FRET (eFRET) sensors, donor fluorescence drops when the rhodopsin acts as depolarization-sensitive acceptor. In recent years, such tools have become widely used in mammalian cells but are less commonly used in invertebrate systems, mostly due to low fluorescence yields. We systematically assessed Arch(D95N), Archon, QuasAr, and the eFRET sensors MacQ-mCitrine and QuasAr-mOrange, in the nematode Caenorhabditis elegans ATR-bearing rhodopsins reported on voltage changes in body wall muscles (BWMs), in the pharynx, the feeding organ [where Arch(D95N) showed approximately 128% ΔF/F increase per 100 mV], and in neurons, integrating circuit activity. ATR fluorescence is very dim, yet, using the retinal analog dimethylaminoretinal, it was boosted 250-fold. eFRET sensors provided sensitivities of 45 to 78% ΔF/F per 100 mV, induced by BWM action potentials, and in pharyngeal muscle, measured in simultaneous optical and sharp electrode recordings, MacQ-mCitrine showed approximately 20% ΔF/F per 100 mV. All sensors reported differences in muscle depolarization induced by a voltage-gated Ca2+-channel mutant. Optogenetically evoked de- or hyperpolarization of motor neurons increased or eliminated action potential activity and caused a rise or drop in BWM sensor fluorescence. Finally, we analyzed voltage dynamics across the entire pharynx, showing uniform depolarization but compartmentalized repolarization of anterior and posterior parts. Our work establishes all-optical, noninvasive electrophysiology in live, intact C. elegans.

Keywords: all-optical electrophysiology; electrochromic FRET; microbial rhodopsin; neuromuscular; voltage imaging.


Conflict of interest statement

The authors declare no conflict of interest.

Figures

Fig. 1.
Fig. 1.
Expression of rhodopsin voltage sensors in C. elegans muscle cells. (A) Expression and imaging of retinal fluorescence [Arch(D95N), QuasAr, Archon] in BWM cells in the head. (Scale bar, 10 µm. Scale for B and C, also 10 μm.) (B) Expression and imaging of Arch(D95N) in BWMs (Upper) and in PM (Lower), complemented with ATR (2 concentrations) and with the retinal analog DMAR (see Inset in D for chemical structures of ATR, DMAR and retinal analog VI). Dashed line indicates worm head. (C) Expression and imaging of eFRET voltage sensors (MacQ-mCitrine, QuasAr-mOrange) in PMs and BWMs. (D and E) Characteristics of basal fluorescence for the sensors expressed in PMs or BWMs, as indicated. Fluorescence intensity (D) as average gray values of an ROI enclosing the entire pharynx and contrast (E) as the ratio of signal over mean fluorescence of a control ROI were acquired (20-ms exposure) with different gain (indicated as “g” and a number). Rhodopsins were supplemented with ATR, DMAR, or analog VI (“A,” “D,” “VI”; concentrations in millimolars). Shown are means ± SEM. Number of animals imaged is indicated in D. In AC, anterior is to the left.
Fig. 2.
Fig. 2.
Rhodopsin sensors detect intrinsic voltage changes in muscles and neurons. (A) Expression of QuasAr-mOrange in PMs, false-color representation of fluorescence intensity. Upper 2 images, animal raised without ATR; movie frames depict relaxed and contracted states. Time series of ROIs for fluorescence of the entire organ (gray) and for TB lumen (grinder region, cyan) are shown in B. Lower 2 images, animal supplemented with ATR (orange, voltage fluorescence ROI). Upon pharyngeal contraction fluorescence drops as TB lumen opens. (B) ΔF/F fluorescence time traces (acquired at 189 fps, 1-ms exposure) of ROIs indicated in A, in percent. Cyan graph: fluctuations of fluorescence signal due to opening and “darkening” of TB lumen, closed and open states. Without ATR, no change in fluorescence is observed despite pumping (gray trace; same movie as for TB contraction). Orange trace: Animal kept on ATR shows fluorescence drop upon PM depolarization; see also Movie S1. (C) Arch(D95N) fluorescence imaged in head BWM (ROI indicated in Inset; 158 fps, 2-ms exposure). (D) QuasAr imaging in BWM, dorsal, and ventral muscle arms in the nerve ring (ROIs indicated in turquoise and magenta), ΔF/F fluorescence shows dorso-ventral alternation. See also Movie S2. (E) APs recorded in dissected BWM, current clamp. (FH) Fluorescence fluctuations of similar frequencies in BWM cells expressing Arch(D95N) (F), Archon (G), and QuasAr (H); each acquired at 158 fps, 2-ms exposure; see also Movies S3 and S4. (I) AP-like activity imaged in QuasAr-expressing BWM is stopped by ACR2-mediated photoinhibition of cholinergic motor neurons (blue trace, blue bar indicates illumination). (J) QuasAr::GFP expression in RIML and RIMR neurons. DIC (Left), GFP (Center), and QuasAr (Right) fluorescence in head region; outline of head and PM indicated. Scale bar, 20 μm. (K) QuasAr fluorescence fluctuations in RIM neurons (black traces), showing slow and fast inhibitory and excitatory events (shaded in red and green, respectively; for statistical analysis, see SI Appendix, Fig. S2C), while GFP (green trace) shows only photobleaching. (L) QuasAr fluorescence traces in RIM during inactive phase (black), and in cholinergic MNs (red). See also SI Appendix, Fig. S2.
Fig. 3.
Fig. 3.
Electrical and voltage-sensor signals in BWMs, induced by optogenetic manipulation of cholinergic MNs. (A) ChR2 mediated depolarization of cholinergic MNs (10-ms light pulse, indicated by blue shade) evokes APs in BWM cells, recorded under current clamp (n = 8 animals, single records in gray). Mean ± SEM voltage trace is shown in red and pink shade. (B) As in A, but extended time scale. (C and D) Arch(D95N) fluorescence voltage signals recorded in response to 5-s photodepolarization of cholinergic MNs by ChR2. Mean ± SEM and single records from indicated number of animals. (E and F) As in C and D, using QuasAr in BWMs. (G and H) As in E and F, but using ACR2 anion channelrhodopsin for hyperpolarization of cholinergic MNs. (I) Mean ± SEM analysis of the data shown in AH, for electrically measured AP amplitudes, and for the first fluorescence peak (assuming first AP) or during the entire 5-s light stimulus, for indicated combinations of sensors, actuators, controls. Frame rate in C–H: 158 fps, 2-ms exposure. n, number of animals. See also SI Appendix, Fig. S1.
Fig. 4.
Fig. 4.
Arch(D95N) and eFRET voltage-sensor signals quantified in PMs during pumping. (A) Arch(D95N) ΔF/F signals of PMs (entire organ) during pump trains, supplemented with ATR (above) or DMAR (below); see also Movies S5 and S6. (B) Pharyngeal APs, drop in fluorescence of eFRET sensors MacQ-mCitrine (Upper, red) (see also Movie S7) and QuasAr-mOrange (Lower, orange) (Movie S1). Corresponding TB contraction signal, black. (C, Left) Pharyngeal APs (overlay of 20 individual APs) and mean (blue), measured by sharp electrode recording (33), and concomitant ΔF/F signals measured from the same APs by MacQ-mCitrine (red, mean ΔF/F). (Right) Calibration ΔF/F per millivolt (each 10 APs from n = 7 animals). Also indicated are τon values for electrically and optically measured APs. (From ref. . Reprinted with permission from AAAS.) (D) Group data for sensors shown in A and B, mean ± SEM ΔF/F peak amplitudes, and SNR, defined as ratio of peak amplitude and SD of the noise (ΔF/F fluctuation between peaks). (E) QuasAr-mOrange signal in BWMs in response to photostimulation of ChR2 in cholinergic MNs (bright blue) or without ChR2 expression (orange), before and during a blue-light stimulus (blue shade). Both signals rise due to additional mOrange excitation. Difference graph (Δ, dark blue) shows drop in fluorescence upon ChR2-mediated stimulation. n = 7 to 8 animals, 3 to 15 APs each (or silent periods in between) were analyzed for D, and 12 to 13 animals in E. Frame rate in A, B, and E: 189 fps, 1-ms exposure.
Fig. 5.
Fig. 5.
Pharyngeal AP and pump parameters quantified by automated analysis in WT and L-type VGCC g.o.f. mutants. (A) Automated analysis of pharyngeal AP parameters and corresponding TB contraction, determined after extraction and alignment of AP and pump events from fluorescence traces (see Materials and Methods for details). (B) Mean ± SEM data obtained using Arch(D95N) equipped with ATR and DMAR, in WT and in egl-19(n2368) mutants. (C and D) Mean ± SEM of AP and pump parameters deduced from data in B. (EH) Mean ± SEM data and parameters deduced from MacQ-mCitrine (E and F) or QuasAr-mOrange recordings (G and H). Frame rate in B, E, and G: 189 fps, 1-ms exposure. Data in C, D, F, and H were statistically analyzed by ANOVA, Bonferroni correction. ***P ≤ 0.001, **P ≤ 0.01, *P ≤ 0.05.
Fig. 6.
Fig. 6.
Pharyngeal AP repolarization occurs in a spatiotemporally compartmentalized fashion. (A) A MacQ-mCitrine fluorescence movie (191 fps, 1-ms exposure) of a pharyngeal pump train was analyzed by measuring fluorescence differences from frame to frame and averaging 12 events, aligned to peak depolarization rate (0 ms, as indicated). (Scale bar, 20 μm.) Dark and bright colors represent high rates of depolarization and repolarization, respectively (Movie S8). Linear ROI along axis of the pharynx allows generating a kymograph (B) for analysis of spatiotemporal development of voltage; synchronous depolarization, consecutive repolarization of corpus and TB. An ROI around the entire pharynx allows generating an “optical EPG” (C) by plotting inverted mean values (green). The EPG (black) was measured simultaneously, showing (from left to right) typical spikes: E/E2 excitation, inhibitory P spikes, as well as R1 and R2 repolarization; eFRET signal is overlaid in red.

References

    1. Kim C. K., Adhikari A., Deisseroth K., Integration of optogenetics with complementary methodologies in systems neuroscience. Nat. Rev. Neurosci. 18, 222–235 (2017). - PMC - PubMed
    1. Knöpfel T., Genetically encoded optical indicators for the analysis of neuronal circuits. Nat. Rev. Neurosci. 13, 687–700 (2012). - PubMed
    1. Xu Y., Zou P., Cohen A. E., Voltage imaging with genetically encoded indicators. Curr. Opin. Chem. Biol. 39, 1–10 (2017). - PMC - PubMed
    1. Antic S. D., Empson R. M., Knöpfel T., Voltage imaging to understand connections and functions of neuronal circuits. J. Neurophysiol. 116, 135–152 (2016). - PMC - PubMed
    1. Lin M. Z., Schnitzer M. J., Genetically encoded indicators of neuronal activity. Nat. Neurosci. 19, 1142–1153 (2016). - PMC - PubMed

Publication types

MeSH terms

Substances