. 2019 Aug 30;365(6456):eaaw6433.
doi: 10.1126/science.aaw6433. Epub 2019 Aug 1.

Identification of a T follicular helper cell subset that drives anaphylactic IgE

Affiliations

Identification of a T follicular helper cell subset that drives anaphylactic IgE

Uthaman Gowthaman et al. Science. .

Abstract

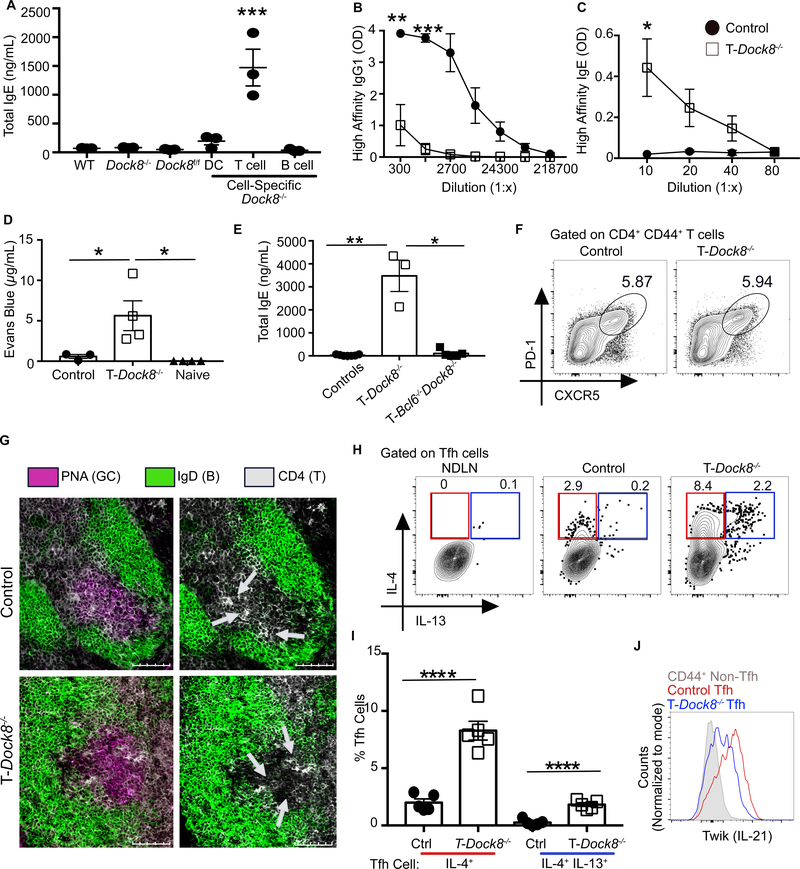
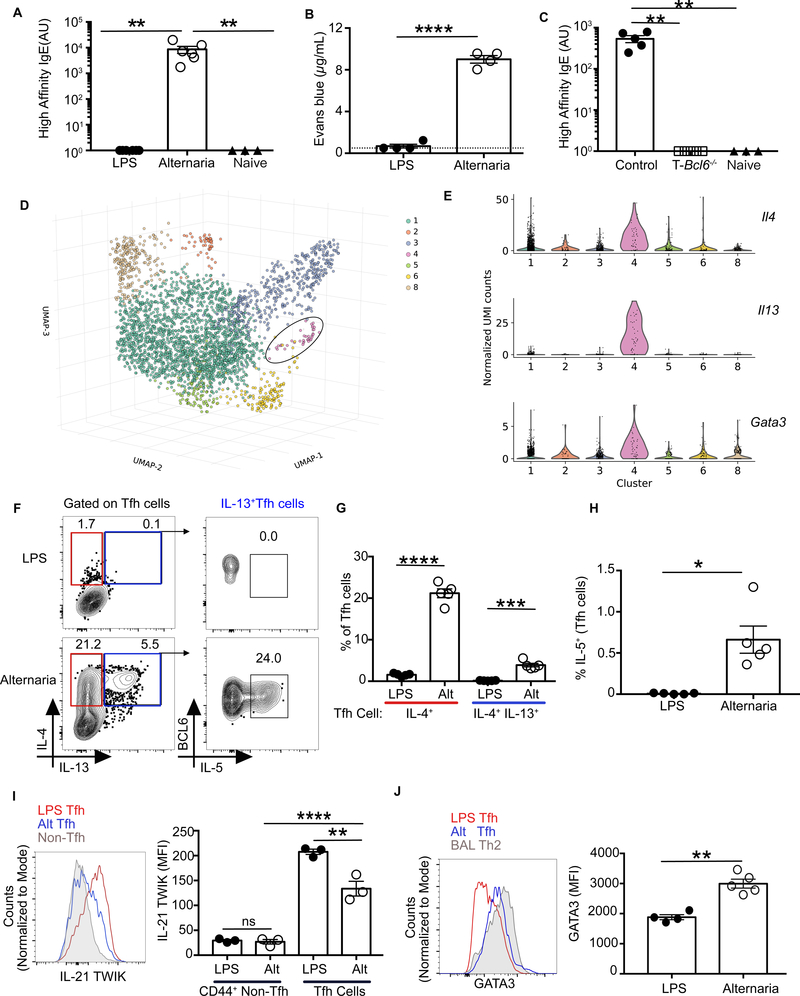
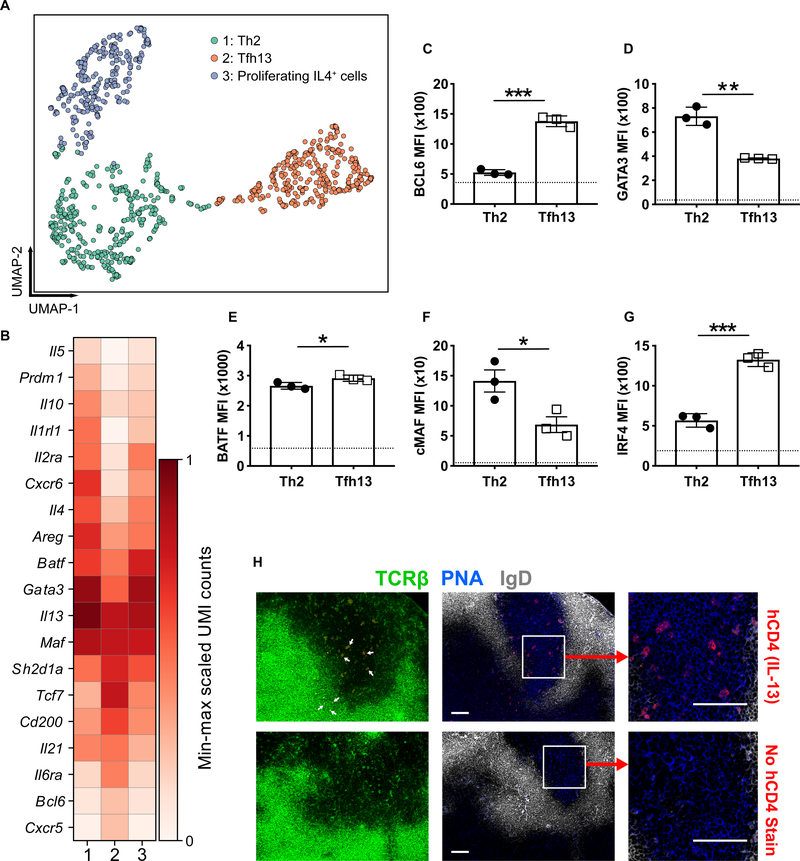
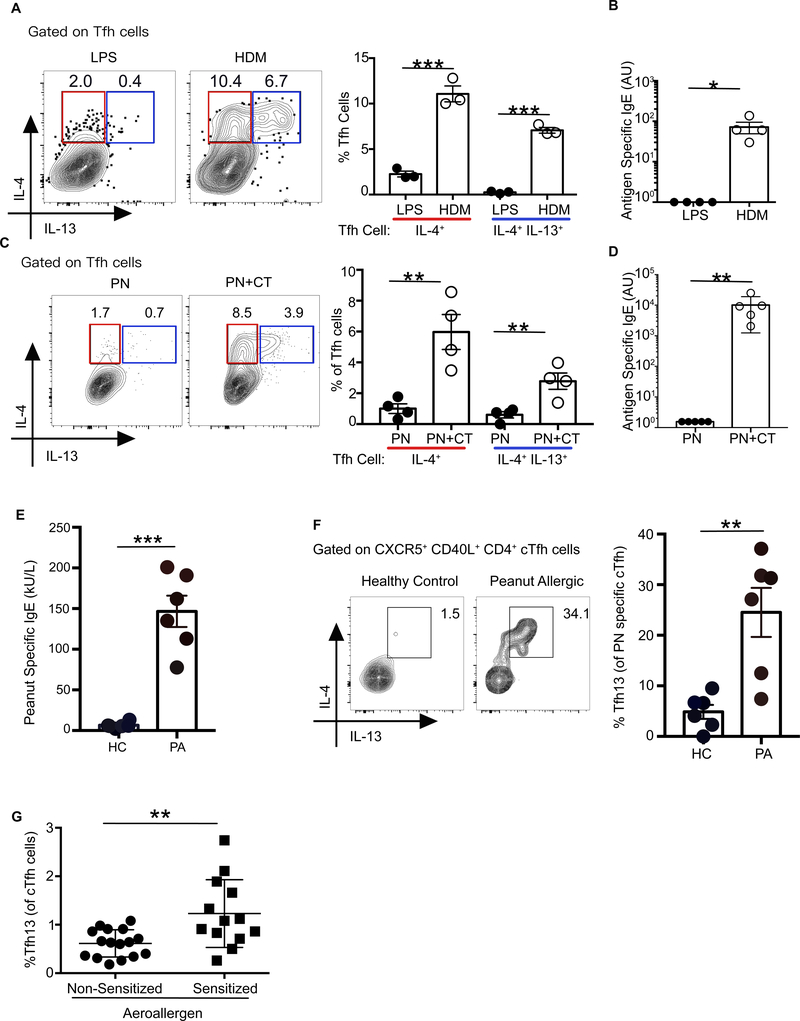
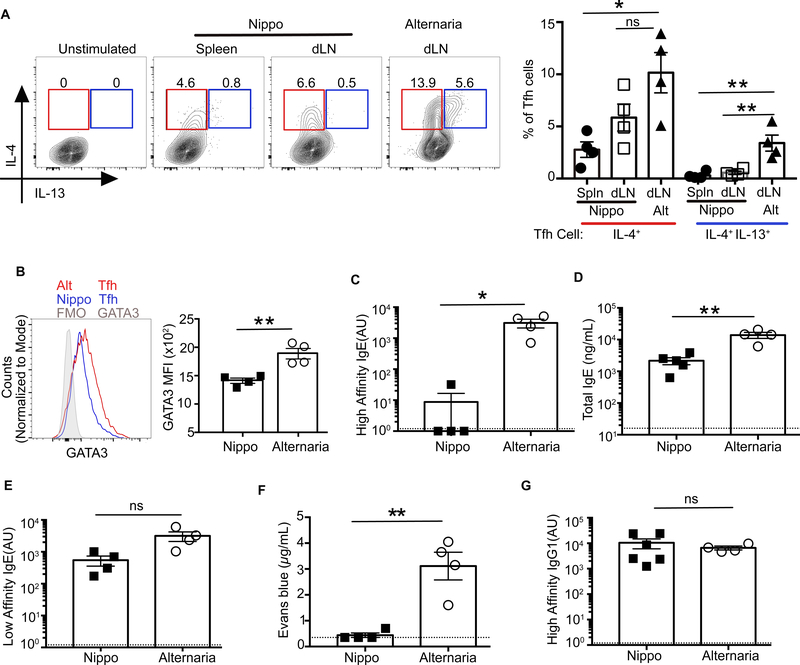
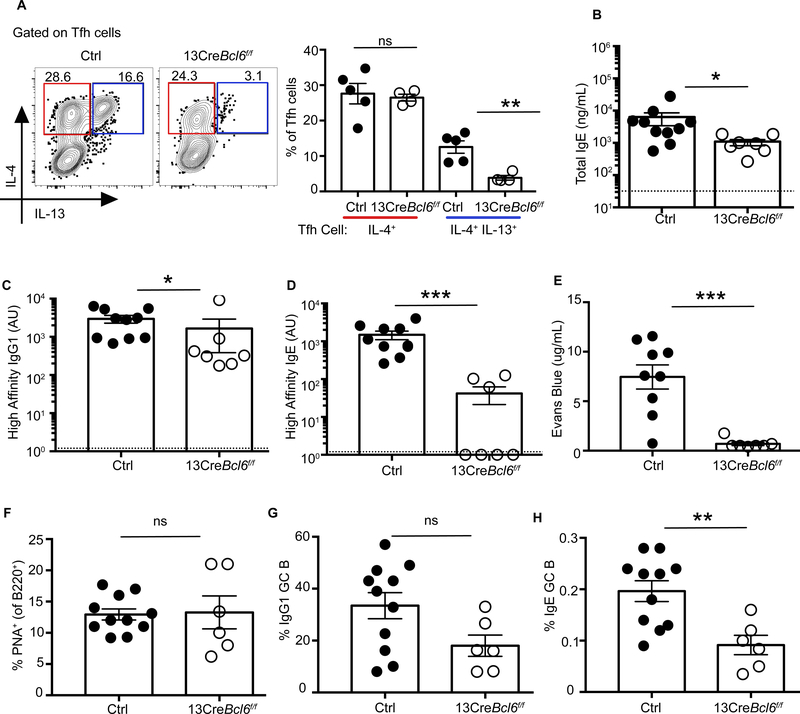
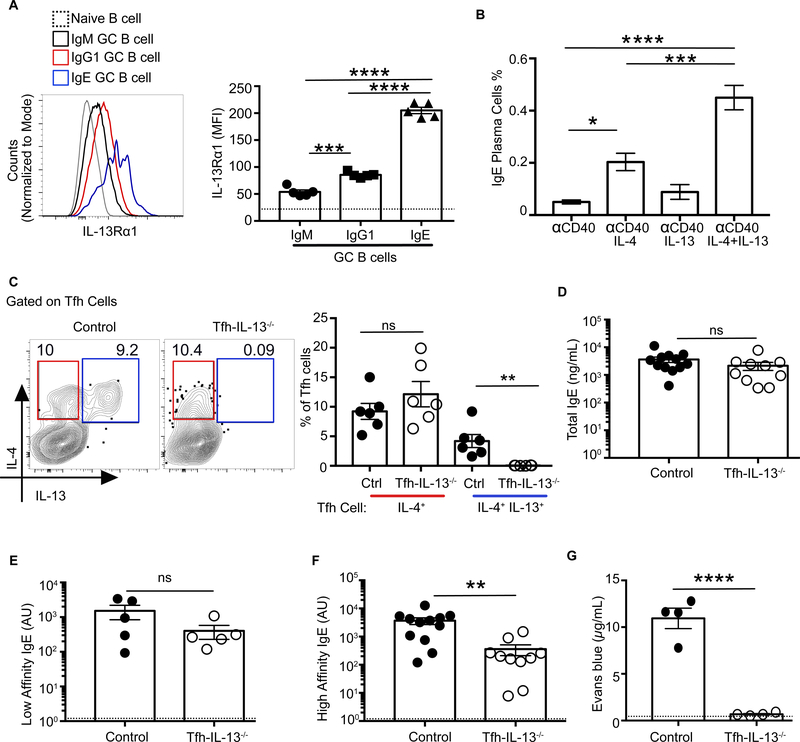
Cross-linking of high-affinity immunoglobulin E (IgE) results in the life-threatening allergic reaction anaphylaxis. Yet the cellular mechanisms that induce B cells to produce IgE in response to allergens remain poorly understood. T follicular helper (TFH) cells direct the affinity and isotype of antibodies produced by B cells. Although TFH cell-derived interleukin-4 (IL-4) is necessary for IgE production, it is not sufficient. We report a rare population of IL-13-producing TFH cells present in mice and humans with IgE to allergens, but not when allergen-specific IgE was absent or only low-affinity. These "TFH13" cells have an unusual cytokine profile (IL-13hiIL-4hiIL-5hiIL-21lo) and coexpress the transcription factors BCL6 and GATA3. TFH13 cells are required for production of high- but not low-affinity IgE and subsequent allergen-induced anaphylaxis. Blocking TFH13 cells may represent an alternative therapeutic target to ameliorate anaphylaxis.


Figures

Fig. 1.
Fig. 1.. DOCK8 deficiency reveals the presence of a specific Tfh cell population associated with a hyper-IgE state
(A) WT, Dock8−/−, Dock8fl/fl, Cd11cCreDock8fl/fl (DC-Dock8−/−), Cd4CreDock8fl/fl (T-Dock8−/−), and Cd19CreDock8fl/fl (B-Dock8−/−) mice were immunized intranasally (i.n.) with LPS and NP16-OVA (LPS+OVA). Day 12 total serum IgE was measured by ELISA. (B and C) T-Dock8−/− or control mice (Dock8fl/fl) were immunized and boosted with LPS+OVA. Day 8 post-boost sera were analyzed by ELISA for (B) NP4-specific IgG1 and (C) NP4-specific IgE. OD, optical density. (D) PCA assay performed by transferring day 8 post-boost sera into naïve recipients and challenging with NP7-BSA and 1% Evans blue. Dye extravasation quantification is shown. (E) Day 12 serum IgE from T-Dock8−/−, T-Bcl6−/−Dock8−/−, or control mice (Dock8fl/fl and Bcl6fl/fl Dock8fl/fl) immunized i.n. with LPS+OVA. (F) Day 8 Tfh cell frequencies are depicted as representative flow cytometry contour plots. (G) Immunofluorescent images of day 9 MedLN GCs from immunized T-Dock8−/− or control Dock8fl/fl mice stained for IgD (green) and CD4 (white) with or without (left and right, respectively) peanut agglutinin (PNA, purple) are shown. Scale bars: 100 μM. Arrows indicate clusters of CD4+ T cells in the GC. (H and I) Intracellular expression of IL-4 and IL-13 by day 8 Tfh cells (gated as in fig. S4A) depicted as (H) flow cytometry plots and (I) bar graphs. NDLN, nondraining lymph node. (J) IL-21 reporter expression in Tfh cells from IL-21 TWIK TDock8−/− or control Dock8fl/fl reporter mice on day 8 after-immunization depicted as histogram overlay. In (A), (D), (E), and (I), each symbol indicates an individual mouse. Numbers in flow plots indicate percentages. Error bars indicate SEM. Statistical tests: analysis of variance (ANOVA) (A and D); Student’s t test (B, C and I); Kruskal–Wallis H test (E). *P<0.05, **P<0.01, ***P<0.001, ****P<0.0001. Data representative of at least two independent experiments with three to seven mice per group.
Fig. 2.
Fig. 2.. Tfh13 cells are induced in WT mice during allergic sensitization
WT mice were immunized and boosted i.n. with LPS or Alternaria extract and NP16-OVA. (A) Day 8 sera from boosted mice were analyzed for high-affinity IgE by ELISA with NP7-BSAcoated plates. (B) Evans blue dye extravasation quantification after PCA with day 8 post-boost sera and NP7-BSA challenge. (C) Cd4CreBcl6fl/fl (T-Bcl6−/−) or control Bcl6fl/fl mice were immunized and boosted with Alternaria extract and NP16-OVA. Eight days later, high-affinity IgE was quantitated using NP4-BSA by ELISA. (D) 3D uniform manifold approximation and projection (UMAP) embedding of the single–cell expression profiles of n=3002 single Tfh cells sorted from WT C57BL/6 mice immunized i.n with Alternaria extract and NP-OVA. Leiden community detection on the cell-cell k=10 nearest neighbor graph segregates cells into seven clusters, five of which were identifiable on the basis expression of previously known markers: 1, Tfh2; 2, type 1 IFN T cell population; 3, proliferating T cells; 4, Tfh13 cells and 6, Tfr cells. The circle identifies cluster 4, a cluster of Il13+ Tfh cells (n=39). (E) Violin plots showing the expression of distinctive marker genes of Il13+ Tfh cluster (Il4, Il13, Gata3). (F to H) Intracellular expression of IL-4, IL-13, and IL-5 in day 8 MedLN Tfh cells induced after primary immunization with LPS or Alternaria and NP-OVA depicted as flow cytometry (F) plots and bar graphs for IL4 and IL-13 (G) and IL-5 (H). (I) IL-21 expression in Tfh cells from IL-21-TWIK reporter mice at day 8 after immunization, depicted as histogram overlay (left) and bar graphs (right). (J) GATA3 expression in Th2 cells from bronchioalveolar lavage fluid of mice immunized with Alternaria and NP-OVA, and Tfh cells from MedLN of mice immunized with LPS or Alternaria and NPOVA. Data are depicted as histogram overlay (left) and bar graphs (right). Each symbol indicates an individual mouse. Numbers in flow plots indicate percentages. Error bars indicate SEM. Dotted lines in bar graphs represent background readings of sera from naïve mice. Statistical tests: Kruskal-Wallis H test (A and C); Student’s t test (B, G and J); ANOVA (I); Mann–Whitney U test (H) *P<0.05, **P<0.01, ***P<0.001, ****P<0.0001; ns, not significant. Data representative of two or three independent experiments with three to five mice per group (A to C, and F to J). Data representative of three biological replicates (D and E).
Fig. 3.
Fig. 3.. Tfh13 cells are a distinct T cell subset
4Get/Il4-reporter mice were immunized i.n. with Alternaria extract and NP19-OVA. GFP(Il4)+CD44+CD4+ T cells were sorted for sc-RNA-seq. Cells expressing one or more Il13 transcripts were isolated and subjected to dimensionality reduction and clustering. (A) A 2D UMAP embedding of n=1,040 Il13+ cells. Low-resolution (0.2) Leiden community detection on the k=10 cell–cell nearest neighbor graph reveals three subpopulations comprising 405, 340, and 295 cells, respectively. Populations 1, 2, and 3 were putatively identified as Th2 cells, Tfh13 cells, and proliferating IL-4+ cells, respectively. (B) A matrix plot showing the expression of key marker genes that are similarly and differentially expressed between Il13+ Th2 and Tfh13 cells. Color scale represents log-transformed normalized unique molecular identifier (UMI) counts scaled between 0 and 1, separately for each gene. (C to H) Smart13 (Il13) reporter mice were immunized with Alternaria extract and NP-OVA. Day 3 after boost, analysis of transcription factors (C) BCL6, (D) GATA3, (E) BATF, (F) cMAF, and (G) IRF4 was performed by intracellular staining of Tfh13 cells and IL-13+ Th2 cells (gated as in fig. S12A). Dotted lines indicate mean fluorescence intensity (MFI) of naïve CD4+ T cells. (H) Microscopic images of MedLN GCs from immunized reporter mice stained for human CD4 (IL-13) (red), TCRβ (green), IgD (white), and PNA (blue) are shown. Arrows in the leftmost panel indicate TCRβ and hCD4 costaining. Scale bars: 100 μM. Statistical tests: Student’s t test (C to G). *P<0.05, **P<0.01, ***P<0.001. Data representative of three biological replicates (A and B). Data representative of two independent experiments (C to H) with three mice.
Fig. 4.
Fig. 4.. Tfh13 cells are induced to multiple allergens in mice and humans
WT C57BL/6 mice were immunized i.n with HDM and NP16-OVA and boosted with HDM and NP16-OVA twice, or with LPS and NP16-OVA as described in Fig 1. (A) Intracellular expression of IL-4 and IL-13 from day 8 MedLN Tfh cells induced after primary immunization is depicted as representative flow cytometry plots (left) and summary bar graphs (right). (B) Day 8 sera from boosted mice were analyzed for NP16-OVA-specific IgE by ELISA. (C and D) WT mice were intragastrically immunized with ground peanut (PN) alone with or without CT in 0.2 M NaHCO3 and boosted with the same immunization up to four times at weekly intervals. (C) Intracellular expression of IL-4 and IL-13 in day 8 mesenteric lymph node (MesLN) Tfh cells induced after primary immunization is depicted as representative flow cytometry plots (left) and summary bar graphs (right). (D) Day 8 sera from boosted mice were analyzed for crude PN extract-specific IgE by ELISA. (E) PN-specific serum IgE ELISA performed with sera from PN-allergic patients (PA) or healthy controls (HC). (F) Cytokine profiles of PN-specific circulating Tfh (cTfh) cells (gated as in fig. S14) obtained from PA or HC. (G) IL-4+ IL-13+ cTfh cells from aeroallergen sensitized or control non-sensitized individuals. Each symbol indicates an individual mouse or subject. Numbers in flow plots indicate percentages. Error bars indicate SEM. Statistical tests: Student’s t test (A, C, and E to G); Mann–Whitney U test (B and D) *P<0.05, **P<0.01, ***P<0.001. Data representative of at least two independent experiments (A to D) with three to five mice per group. (E and F) Data from healthy controls n=6 or PN allergic patients (n=6). (G) Data from aeroallergen sensitized allergic patients (n=13) or non-sensitized individuals (n=16).
Fig. 5.
Fig. 5.. Tfh13 cells and high-affinity IgE are not induced to helminth infections
WT C57BL/6 mice were either immunized and boosted with Alternaria extract and NP16-OVA (Alt+OVA), or infected with N. brasiliensis and co-immunized with NP16-OVA and boosted (Nippo+OVA). (A) IL-4 and IL-13 expression in day 8 Tfh cells from N. brasiliensis or Alternaria immunization is shown as flow cytometry plots (left) or as summary bar graphs (right). (B) GATA3 expression in day 8 splenic Tfh cells induced by N. brasiliensis or MedLN Tfh cells from Alternaria immunization. (C to E) Day 8 post-boost sera from mice immunized with Nippo+OVA or Alt+OVA were analyzed by ELISA for (C) high-affinity IgE using NP7-BSA, (D) total IgE, and (E) low-affinity IgE using NP40-BSA. (F) Evans blue dye quantification from PCA assay (with i.v. NP7-BSA challenge) using day 8 post-boost sera from Nippo+OVA or Alt+OVA immunized mice. (G) ELISA for high-affinity IgG1 using NP7-BSA performed on day 8 post-boost sera from mice immunized with Nippo+OVA or Alt+OVA. Each symbol indicates an individual mouse. Numbers in flow plots indicate percentages. Error bars indicate SEM. Dotted lines in bar graphs represent background readings of sera from naïve mice. Statistical tests: ANOVA (A); Student’s t test (B to D to F); Mann-Whitney U test (C and G) *P<0.05, **P<0.01. Data representative of two independent experiments with four to six mice per group.
Fig. 6.
Fig. 6.. Loss of Tfh13 cells abrogates the production of high-affinity IgE
13CreBcl6fl/fl or control Bcl6fl/fl mice were immunized and boosted with Alternaria extract and NP19-OVA. (A) Intracellular expression of IL-4 and IL-13 from day 8 MedLN Tfh cells induced after primary immunization is depicted as representative flow cytometry plots (left) and summary bar graphs (right). (B to E) Day 8 post-boost sera were analyzed for (B) total IgE, (C) NP7-specific high-affinity IgG1 (D), NP7-specific high-affinity IgE, and (E) anaphylactic ability by PCA after i.v. challenge with NP7-BSA. (F to H) Day 7 post-boost MedLN cells were analyzed for: (F) B220+PNA+ GC B cells, (G) percentage of GC B cells expressing IgG1, and (H) percentage of GC B cells expressing IgE. Each symbol indicates an individual mouse. Numbers in flow plots indicate percentages. Error bars indicate SEM. Statistical tests: Student’s t test (A and F to H); Mann–-Whitney U test (B to E). *P<0.05, **P<0.01. Dotted lines in bar graphs represent background readings of sera from naïve mice. Data are either representative of two independent experiments (A) or from two pooled experiments (B to H) with three to six mice per group.
Fig. 7.
Fig. 7.. Tfh cell-derived IL-13 is required for anaphylactic IgE production
(A) Expression of IL-13Rα1 on MedLN GC B cells at day 9 after immunization with Alternaria and NP-OVA is shown as histogram overlay (left) and summary bar graphs (right). Gating strategy as in fig. S15B. (B) Day 8 MedLN lymphocytes from Alternaria and NP-OVA immunized WT mice were cultured with α-CD40 and IL-4 and/or IL-13 for 3 days, and IgE plasma cells were quantified by staining the cells for intracellular IgE and CD138. (C to G) Mixed bone marrow chimeric mice were generated from Il-13−/− and Cd4Cre Bcl6fl/fl donor bone marrow (Tfh-IL-13−/− chimeric mice) or WT and Cd4Cre Bcl6fl/fl donor bone marrow (control chimeric mice). Chimeric mice were immunized and boosted with Alternaria and NP20-OVA. (C) IL-4 and IL-13 expression by day 8 Tfh cells post-boost from Tfh-IL-13−/− or control chimeras is shown as flow cytometry plots (left) or as summary bar graphs (right). (D to F) Day 8 after-boost sera from Tfh-Il-13−/− or control chimeras were analyzed by ELISA for (D) total IgE, (E) low-affinity IgE using NP-40 BSA, and (F) high-affinity IgE using NP7-BSA. (G) Evans blue dye quantification after PCA assay with day 9 after-boost sera from Tfh-Il-13−/− or control chimeras after i.v. challenge with NP7BSA. Each symbol indicates an individual mouse. Error bars indicate SEM. Dotted lines in bar graphs represent (A) IL-13Rα1 expression on naïve B cells or (E and F) background readings of sera from naïve mice. Statistical tests: ANOVA (A and B); Student’s t test (C and G); Mann-Whitney U test (D to F). *P<0.05, **P<0.01, ***P<0.001, ****P<0.0001. Data are either from two pooled experiments (D and F) or are representative of at least two independent experiments with three to seven mice per group.

Comment in

References

    1. Oettgen HC, Geha RS, IgE regulation and roles in asthma pathogenesis. The Journal of allergy and clinical immunology 107, 429–441(2001); published online EpubMar (10.1067/mai.2001.113759). - DOI - PubMed
    1. Mita H, Yasueda H, Akiyama K, Affinity of IgE antibody to antigen influences allergen-induced histamine release. Clin. Exp. Allergy : journal of the British Society for Allergy and Clinical Immunology 30, 15831589 (2000); published online EpubNov ( - PubMed
    1. Suzuki R, Leach S, Liu W, Ralston E, Scheffel J, Zhang W, Lowell CA, Rivera J, Molecular editing of cellular responses by the high-affinity receptor for IgE. Science 343, 1021–1025 (2014); published online EpubFeb 28 (10.1126/science.1246976). - DOI - PMC - PubMed
    1. Wang J, Lin J, Bardina L, Goldis M, Nowak-Wegrzyn A, Shreffler WG, Sampson HA, Correlation of IgE/IgG4 milk epitopes and affinity of milk-specific IgE antibodies with different phenotypes of clinical milk allergy. The Journal of allergy and clinical immunology 125, 695 702 e691–702 e696 (2010); published online EpubMar (10.1016/j.jaci.2009.12.017). - DOI - PMC - PubMed
    1. He JS, Subramaniam S, Narang V, Srinivasan K, Saunders SP, Carbajo D, Wen-Shan T, Hamadee N. Hidayah, Lum J, Lee A, Chen J, Poidinger M, Zolezzi F, Lafaille JJ, de Lafaille M. A. Curotto, IgG1 memory B cells keep the memory of IgE responses. Nat Commun 8, 641 (2017); published online EpubSep 21 (10.1038/s41467-017-00723-0). - DOI - PMC - PubMed

Publication types