. 2019 Oct 22;93(17):e1647-e1659.
doi: 10.1212/WNL.0000000000008081. Epub 2019 Aug 1.

High-precision plasma β-amyloid 42/40 predicts current and future brain amyloidosis

Affiliations

High-precision plasma β-amyloid 42/40 predicts current and future brain amyloidosis

Suzanne E Schindler et al. Neurology. .

Abstract

Objective: We examined whether plasma β-amyloid (Aβ)42/Aβ40, as measured by a high-precision assay, accurately diagnosed brain amyloidosis using amyloid PET or CSF p-tau181/Aβ42 as reference standards.

Methods: Using an immunoprecipitation and liquid chromatography-mass spectrometry assay, we measured Aβ42/Aβ40 in plasma and CSF samples from 158 mostly cognitively normal individuals that were collected within 18 months of an amyloid PET scan.

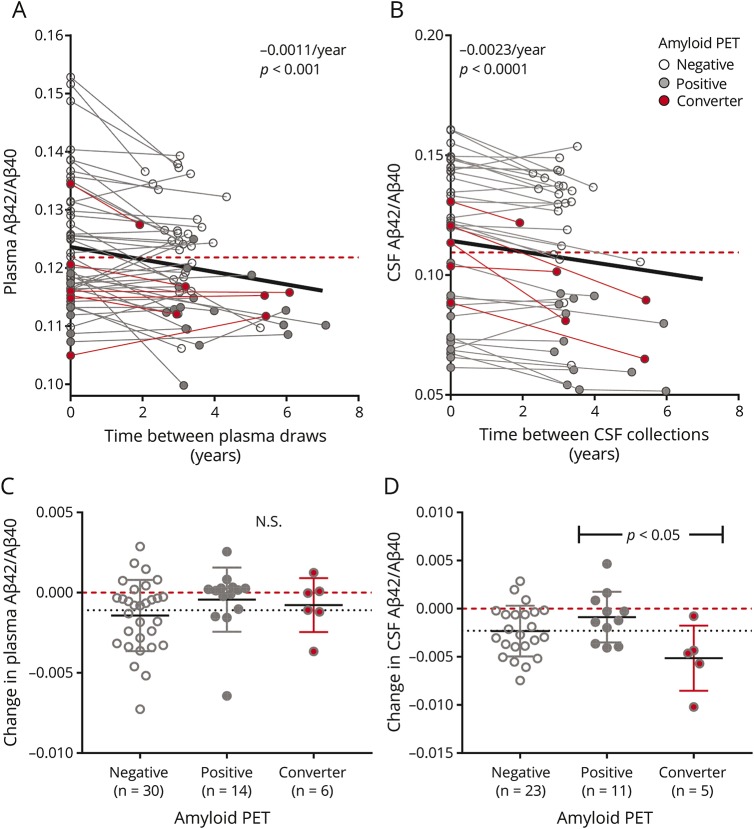
Results: Plasma Aβ42/Aβ40 had a high correspondence with amyloid PET status (receiver operating characteristic area under the curve [AUC] 0.88, 95% confidence interval [CI] 0.82-0.93) and CSF p-tau181/Aβ42 (AUC 0.85, 95% CI 0.79-0.92). The combination of plasma Aβ42/Aβ40, age, and APOE ε4 status had a very high correspondence with amyloid PET (AUC 0.94, 95% CI 0.90-0.97). Individuals with a negative amyloid PET scan at baseline and a positive plasma Aβ42/Aβ40 (<0.1218) had a 15-fold greater risk of conversion to amyloid PET-positive compared to individuals with a negative plasma Aβ42/Aβ40 (p = 0.01).

Conclusions: Plasma Aβ42/Aβ40, especially when combined with age and APOE ε4 status, accurately diagnoses brain amyloidosis and can be used to screen cognitively normal individuals for brain amyloidosis. Individuals with a negative amyloid PET scan and positive plasma Aβ42/Aβ40 are at increased risk for converting to amyloid PET-positive. Plasma Aβ42/Aβ40 could be used in prevention trials to screen for individuals likely to be amyloid PET-positive and at risk for Alzheimer disease dementia.

Classification of evidence: This study provides Class II evidence that plasma Aβ42/Aβ40 levels accurately determine amyloid PET status in cognitively normal research participants.


Figures

Figure 1
Figure 1. Correspondence of baseline plasma and CSF β-amyloid (Aβ)42/Aβ40 with baseline amyloid PET
Baseline (A) plasma and (B) CSF Aβ42/Aβ40 were decreased in baseline amyloid PET-positive individuals. Receiver operating characteristic analyses demonstrate that baseline plasma (C) and CSF (D) Aβ42/Aβ40 were predictive of baseline amyloid PET status. The area under the curve is noted with 95% confidence intervals (CIs). For the cutoffs listed, the positive percent agreement and negative percent agreement is provided with 95% CIs. Baseline (E) plasma and (F) CSF Aβ42/Aβ40 were inversely correlated with baseline amyloid PET binding as measured on the Centiloid scale. (G) Baseline plasma and CSF Aβ42/Aβ40 were correlated. The Spearman ρ (r) is noted with 95% CIs for (E–G). Dashed red lines depict cutoffs for plasma or CSF Aβ42/Aβ40 based on the maximum Youden Index (A–G) or, for amyloid PET Centiloid, the established cutoff for amyloid PET positivity (E and F).
Figure 2
Figure 2. Relationship of age, APOE ε4 status, and sex with baseline plasma and CSF β-amyloid (Aβ)42/Aβ40
(A) Baseline plasma Aβ42/Aβ40 was lower with older age and was lower in APOE ε4 carriers and men. (B) Baseline CSF Aβ42/Aβ40 was lower with older age and was lower in APOE ε4 carriers. Horizontal dashed red lines depict cutoffs for plasma or CSF Aβ42/Aβ40. Sloped lines represent the estimated Aβ42/Aβ40 as a function of age for the cross-sectional groups. (C) Receiver operating characteristic analysis demonstrated a trend towards a higher area under the curve (AUC) for prediction of amyloid PET status when age and APOE ε4 status were included in the model. The AUC is noted with 95% confidence intervals. (D) The combination of plasma Aβ42/Aβ40, age, and APOE ε4 status was used to predict the likelihood of amyloid PET positivity.
Figure 3
Figure 3. Baseline plasma and CSF β-amyloid (Aβ)42/Aβ40 predict amyloid PET status conversion
(A) Individuals who were amyloid PET-negative at baseline and converted to amyloid PET-positive over the follow-up period had lower baseline plasma Aβ42/Aβ40 than individuals who remained amyloid PET-negative. (B) There was also a trend towards lower baseline CSF Aβ42/Aβ40 in amyloid PET converters vs nonconverters. Dashed red lines depict cutoffs for plasma or CSF Aβ42/Aβ40. A one-way analysis of variance was significant for both A and B at p < 0.0001 and the results of Tukey multiple comparison tests are shown in the plots. The fraction of individuals remaining amyloid PET-negative by plasma or CSF Aβ42/Aβ40 status is depicted (C, D). For individuals who remained amyloid PET-negative, the tick marks represent the time of the last negative amyloid PET scan. For individuals who converted to amyloid PET-positive, the tick marks represent the time of the first positive amyloid PET scan. Individuals who were amyloid PET-negative at baseline with a positive plasma Aβ42/Aβ40 had a 15-fold greater risk of conversion to amyloid PET-positive compared to individuals with a negative plasma Aβ42/Aβ40, p = 0.01 (E). Individuals who were amyloid PET-negative at baseline with a positive CSF Aβ42/Aβ40 had a 21-fold greater risk of conversion to amyloid PET-positive compared to individuals with a negative CSF Aβ42/Aβ40, p = 0.03 (F). For E and F, the prediction model was truncated at 7 years.
Figure 4
Figure 4. Longitudinal change in plasma and CSF β-amyloid (Aβ)42/Aβ40
Both (A) plasma and (B) CSF Aβ42/Aβ40 declined within individuals over time. Thin lines connect values within an individual. The bolded rates are the average rates of change for the entire longitudinal cohort and are represented by thick black lines. Dashed red lines depict cutoffs for plasma or CSF Aβ42/Aβ40 based on the analyses shown in figure 1. The rates of change for plasma and CSF Aβ42/Aβ40 for each individual were determined by linear regression and the slopes were plotted. One-sample t tests were used to determine whether the rates of change were significantly different from zero. The rate of change for plasma Aβ42/Aβ40 did not vary significantly by amyloid PET group (C). Amyloid PET converters had a faster decline in CSF Aβ42/Aβ40 compared to individuals who were amyloid PET-positive at both first and last time points (D). Dashed red lines depict a slope of zero (no change). Dotted lines are the average rate of change by for the entire longitudinal cohort.

Comment in

References

    1. Hebert LE, Weuve J, Scherr PA, Evans DA. Alzheimer disease in the United States (2010-2050) estimated using the 2010 census. Neurology 2013;80:1778–1783. - PMC - PubMed
    1. Blennow K, Hampel H, Weiner M, Zetterberg H. Cerebrospinal fluid and plasma biomarkers in Alzheimer disease. Nat Rev Neurol 2010;6:131–144. - PubMed
    1. Witte MM, Foster NL, Fleisher AS, et al. Clinical use of amyloid-positron emission tomography neuroimaging: practical and bioethical considerations. Alzheimer's Demen 2015;1:358–367. - PMC - PubMed
    1. O'Brien JT, Herholz K. Amyloid imaging for dementia in clinical practice. BMC Med 2015;13:163. - PMC - PubMed
    1. Klunk WE, Engler H, Nordberg A, et al. Imaging brain amyloid in Alzheimer's disease with Pittsburgh compound-B. Ann Neurol 2004;55:306–319. - PubMed

Publication types

MeSH terms