. 2019 Aug 2;365(6452):eaaw4361.
doi: 10.1126/science.aaw4361. Epub 2019 Aug 1.

Laboratory mice born to wild mice have natural microbiota and model human immune responses

Affiliations

Laboratory mice born to wild mice have natural microbiota and model human immune responses

Stephan P Rosshart et al. Science. .

Abstract

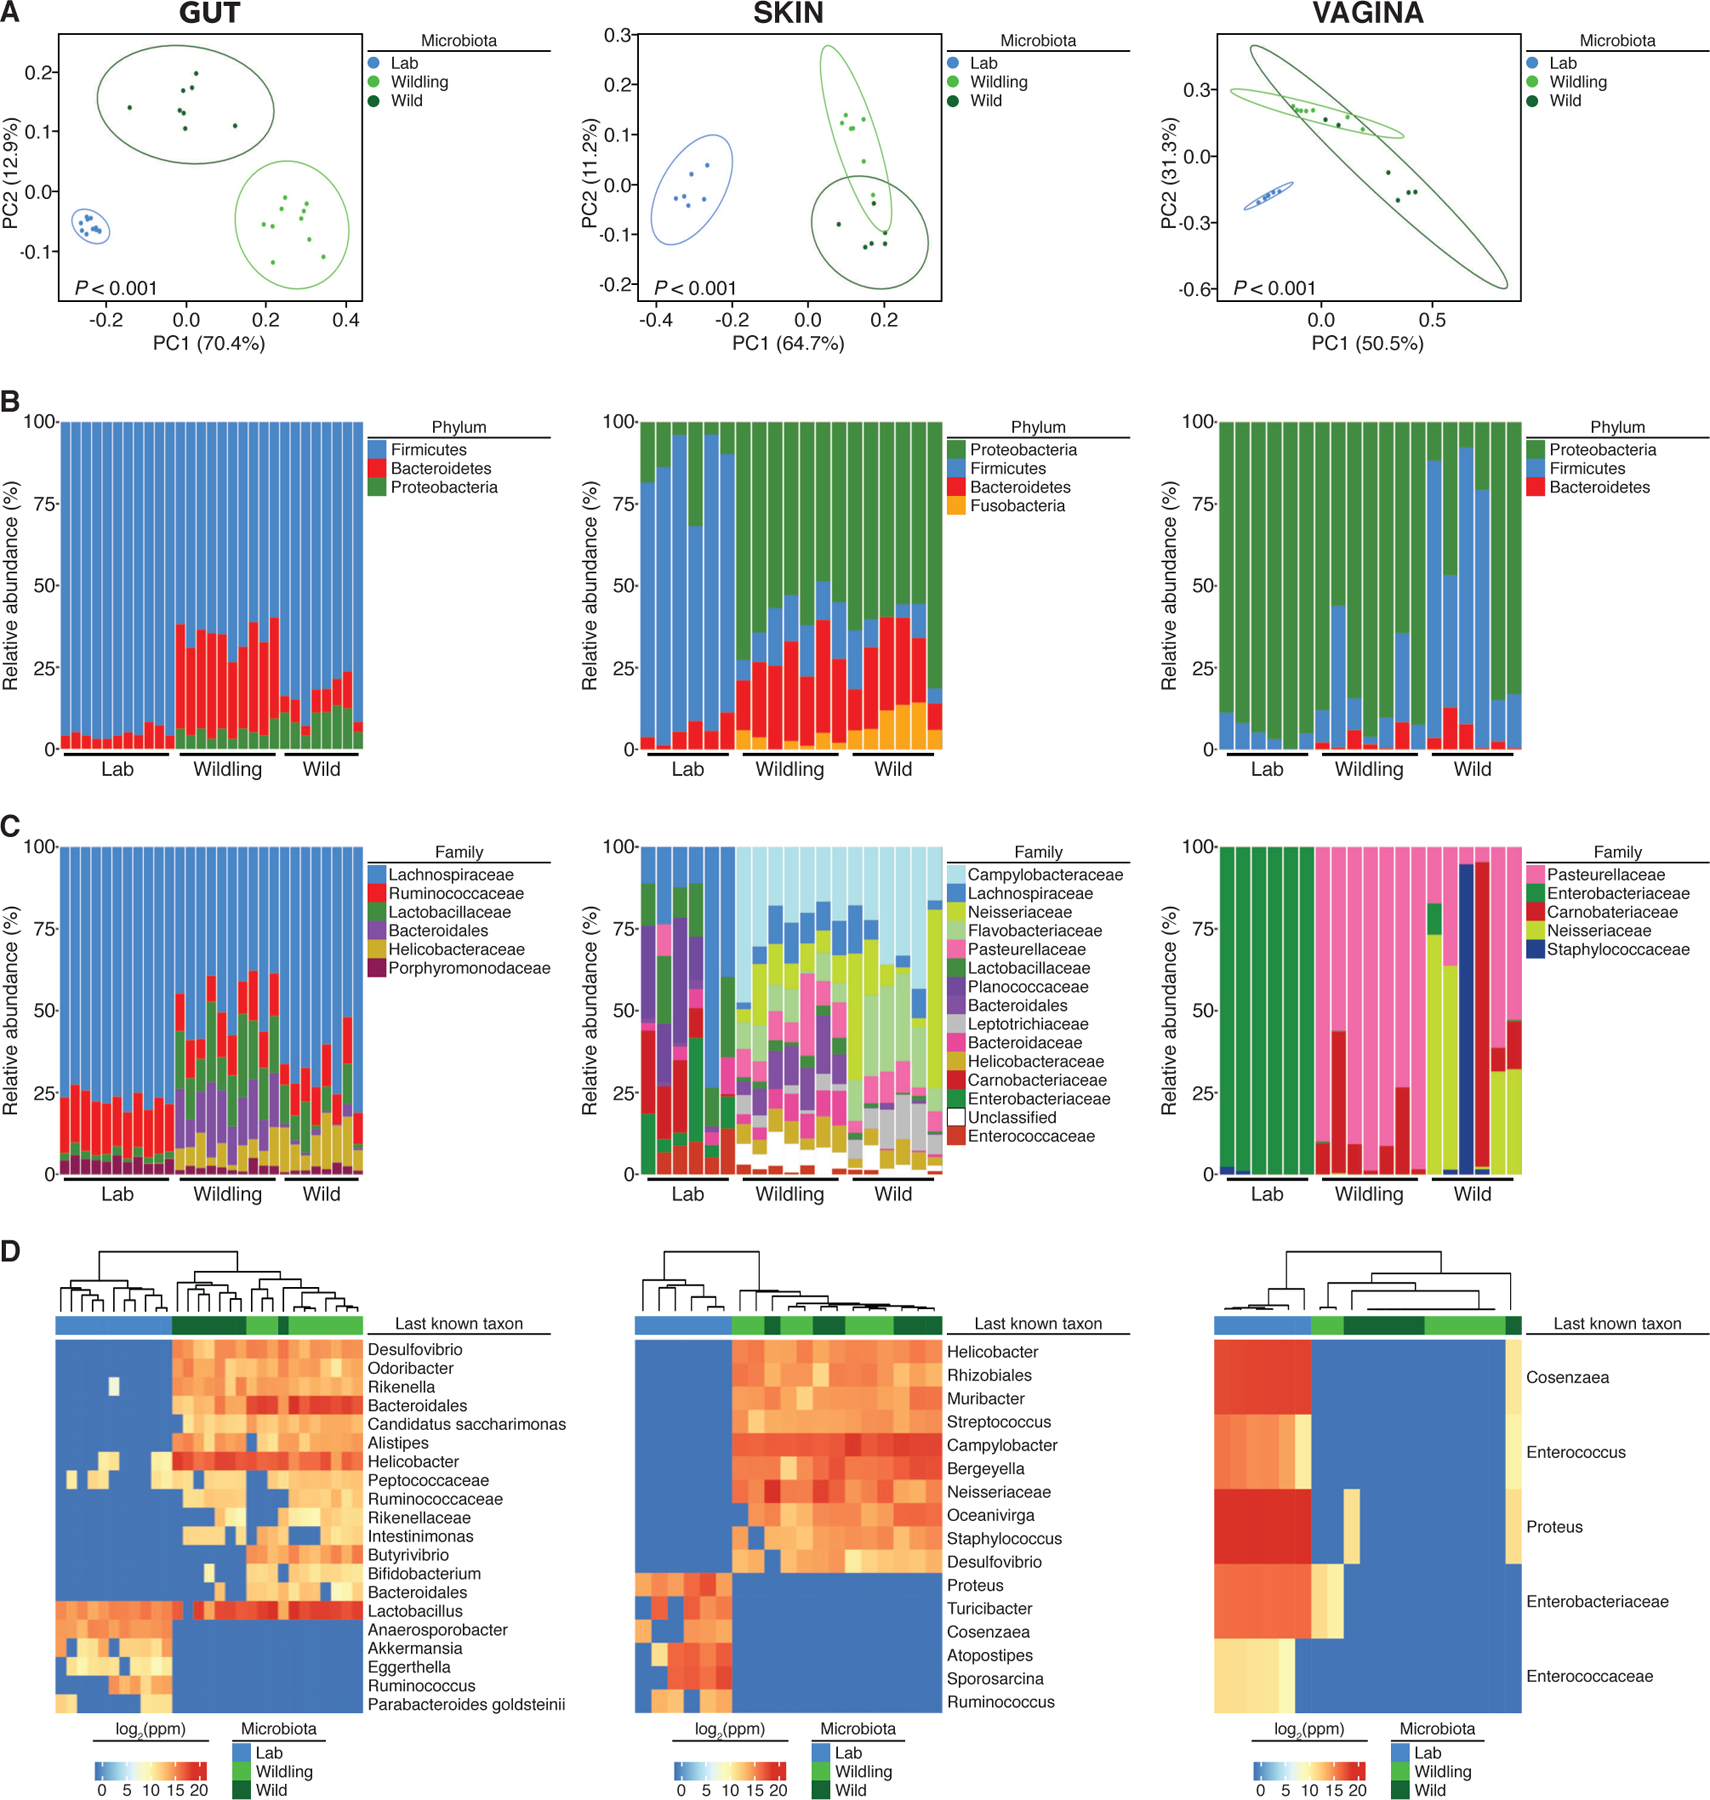
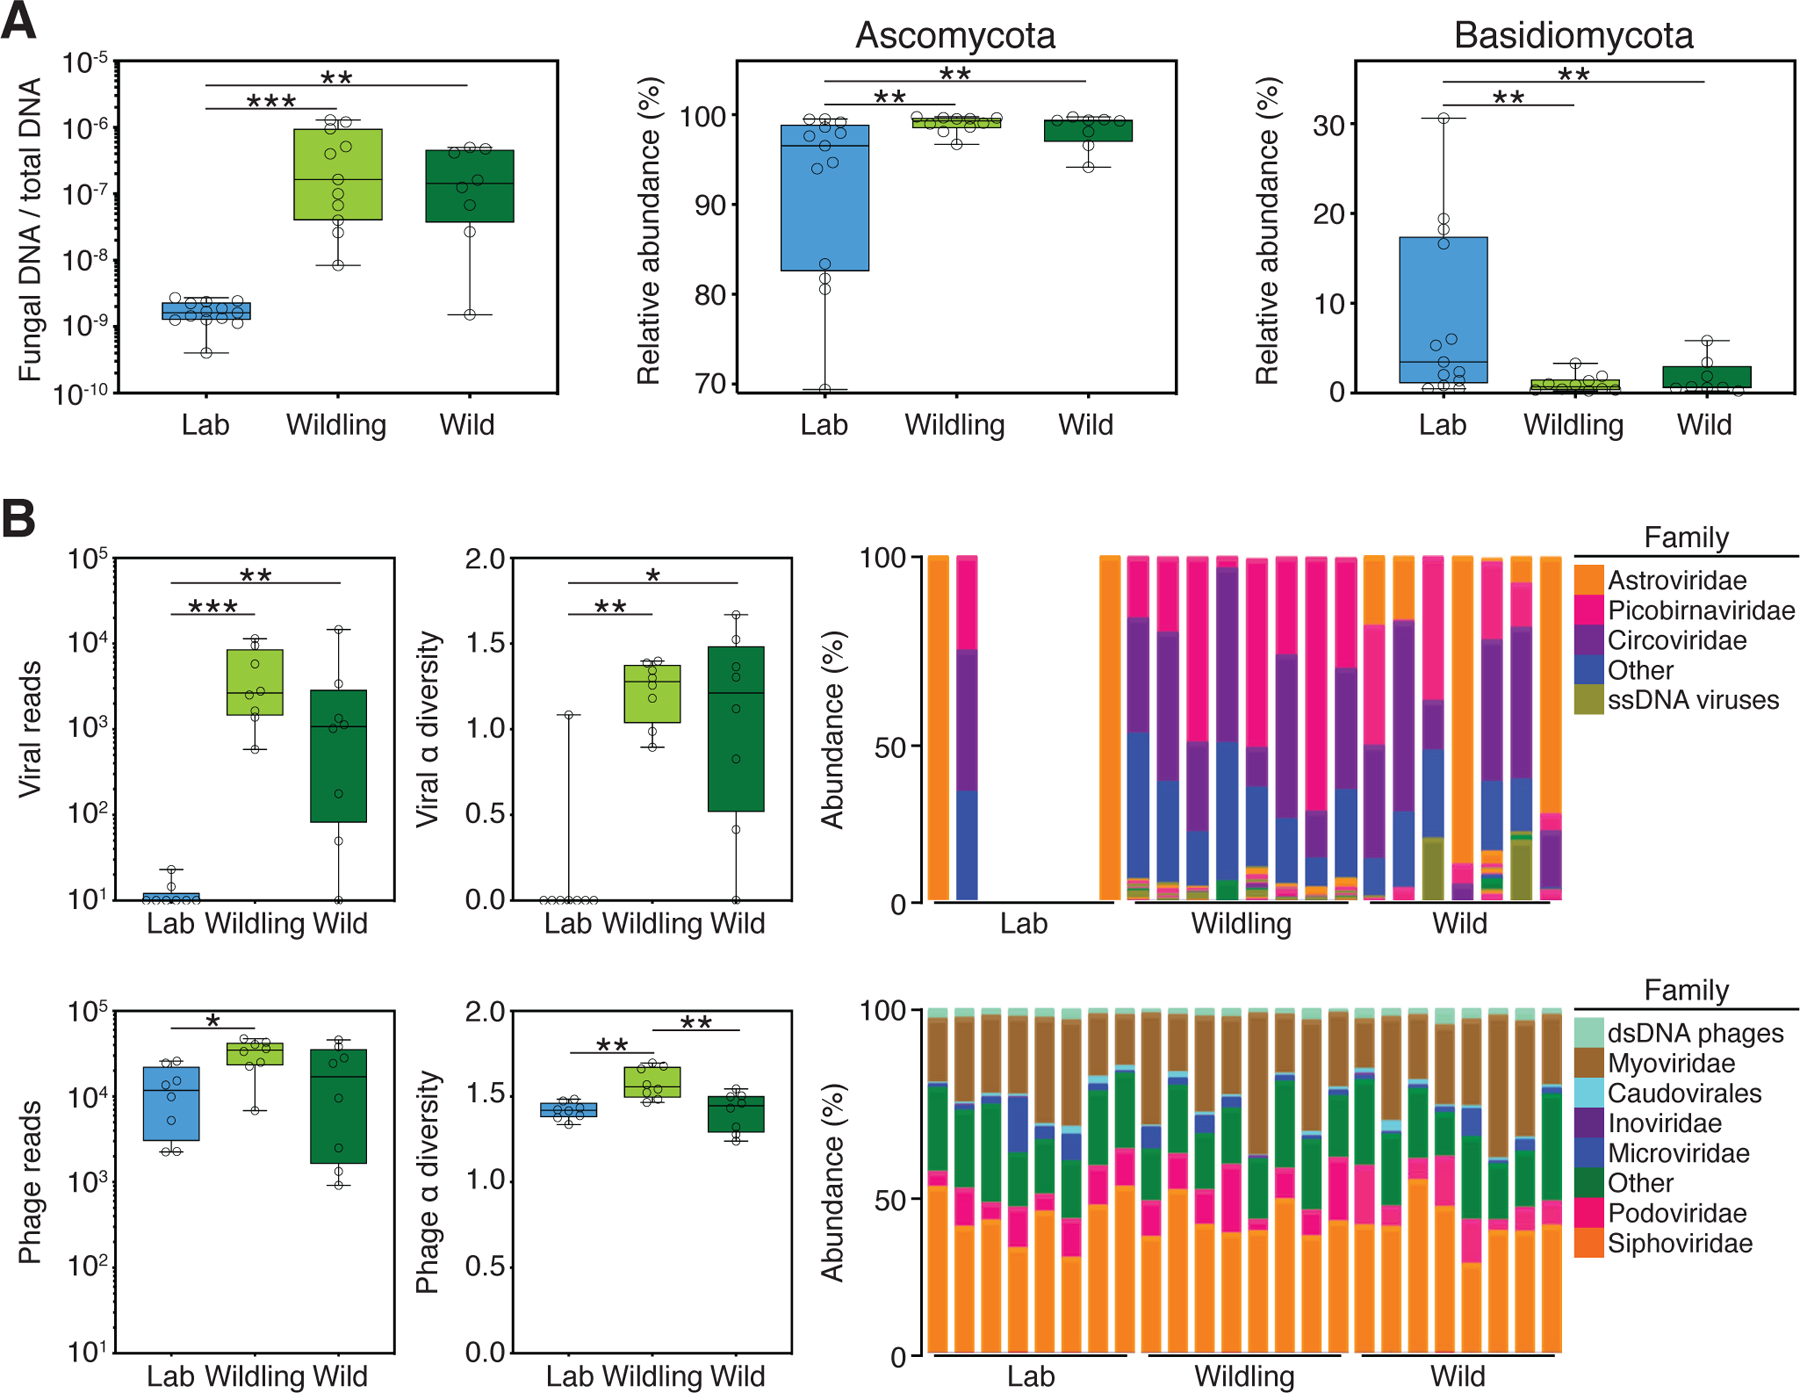
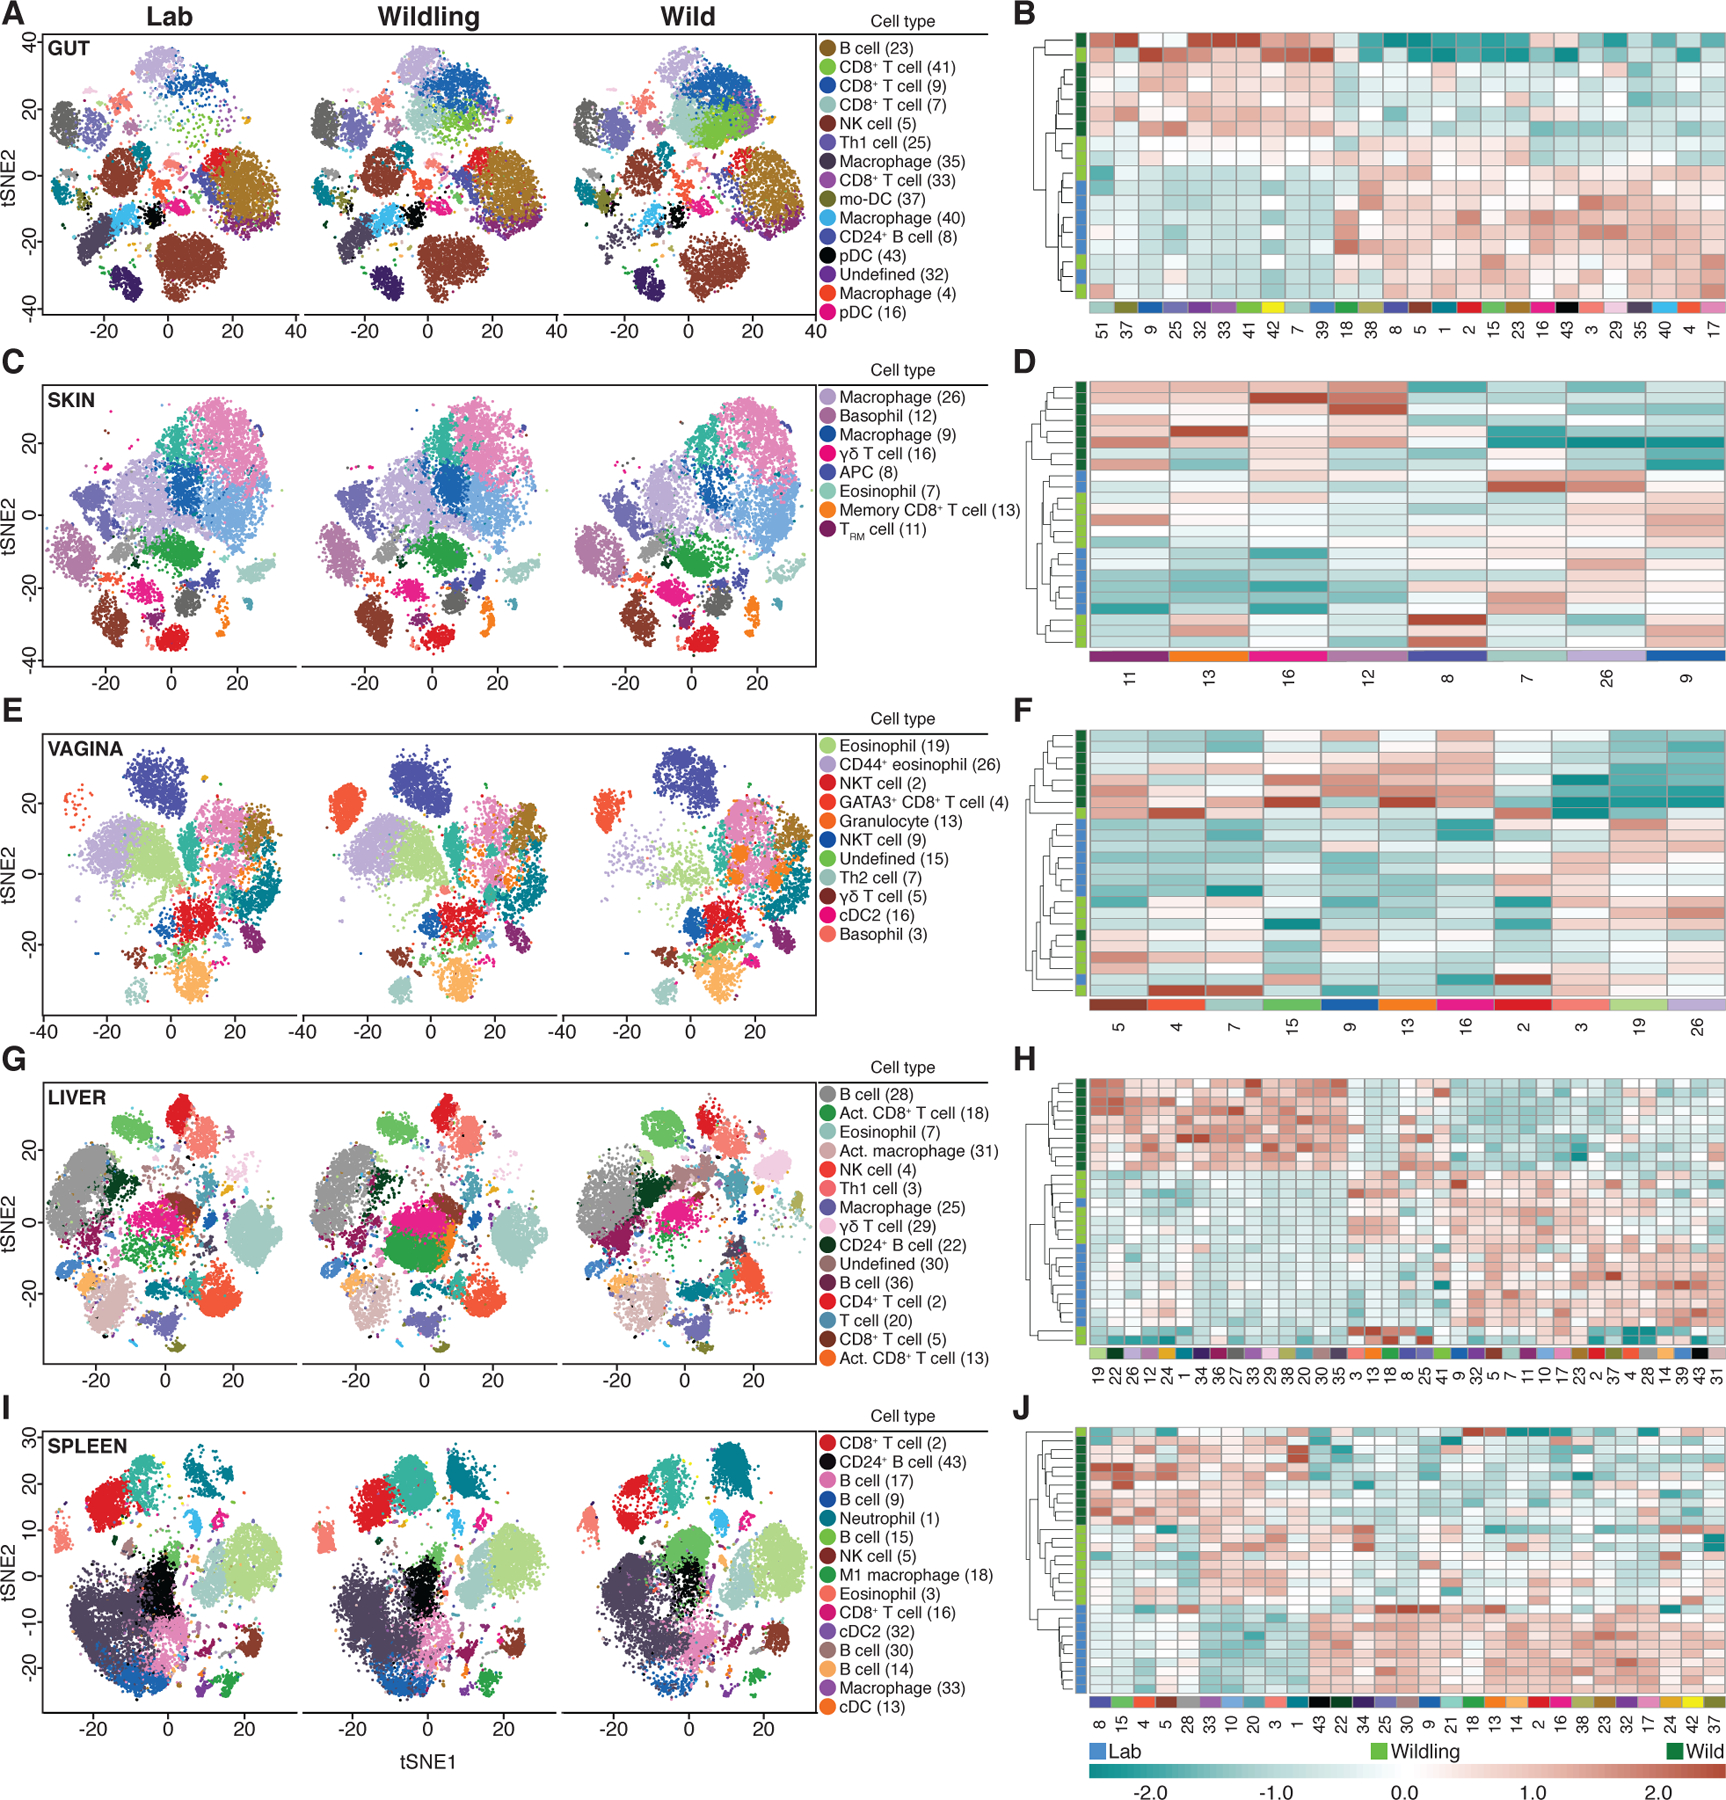
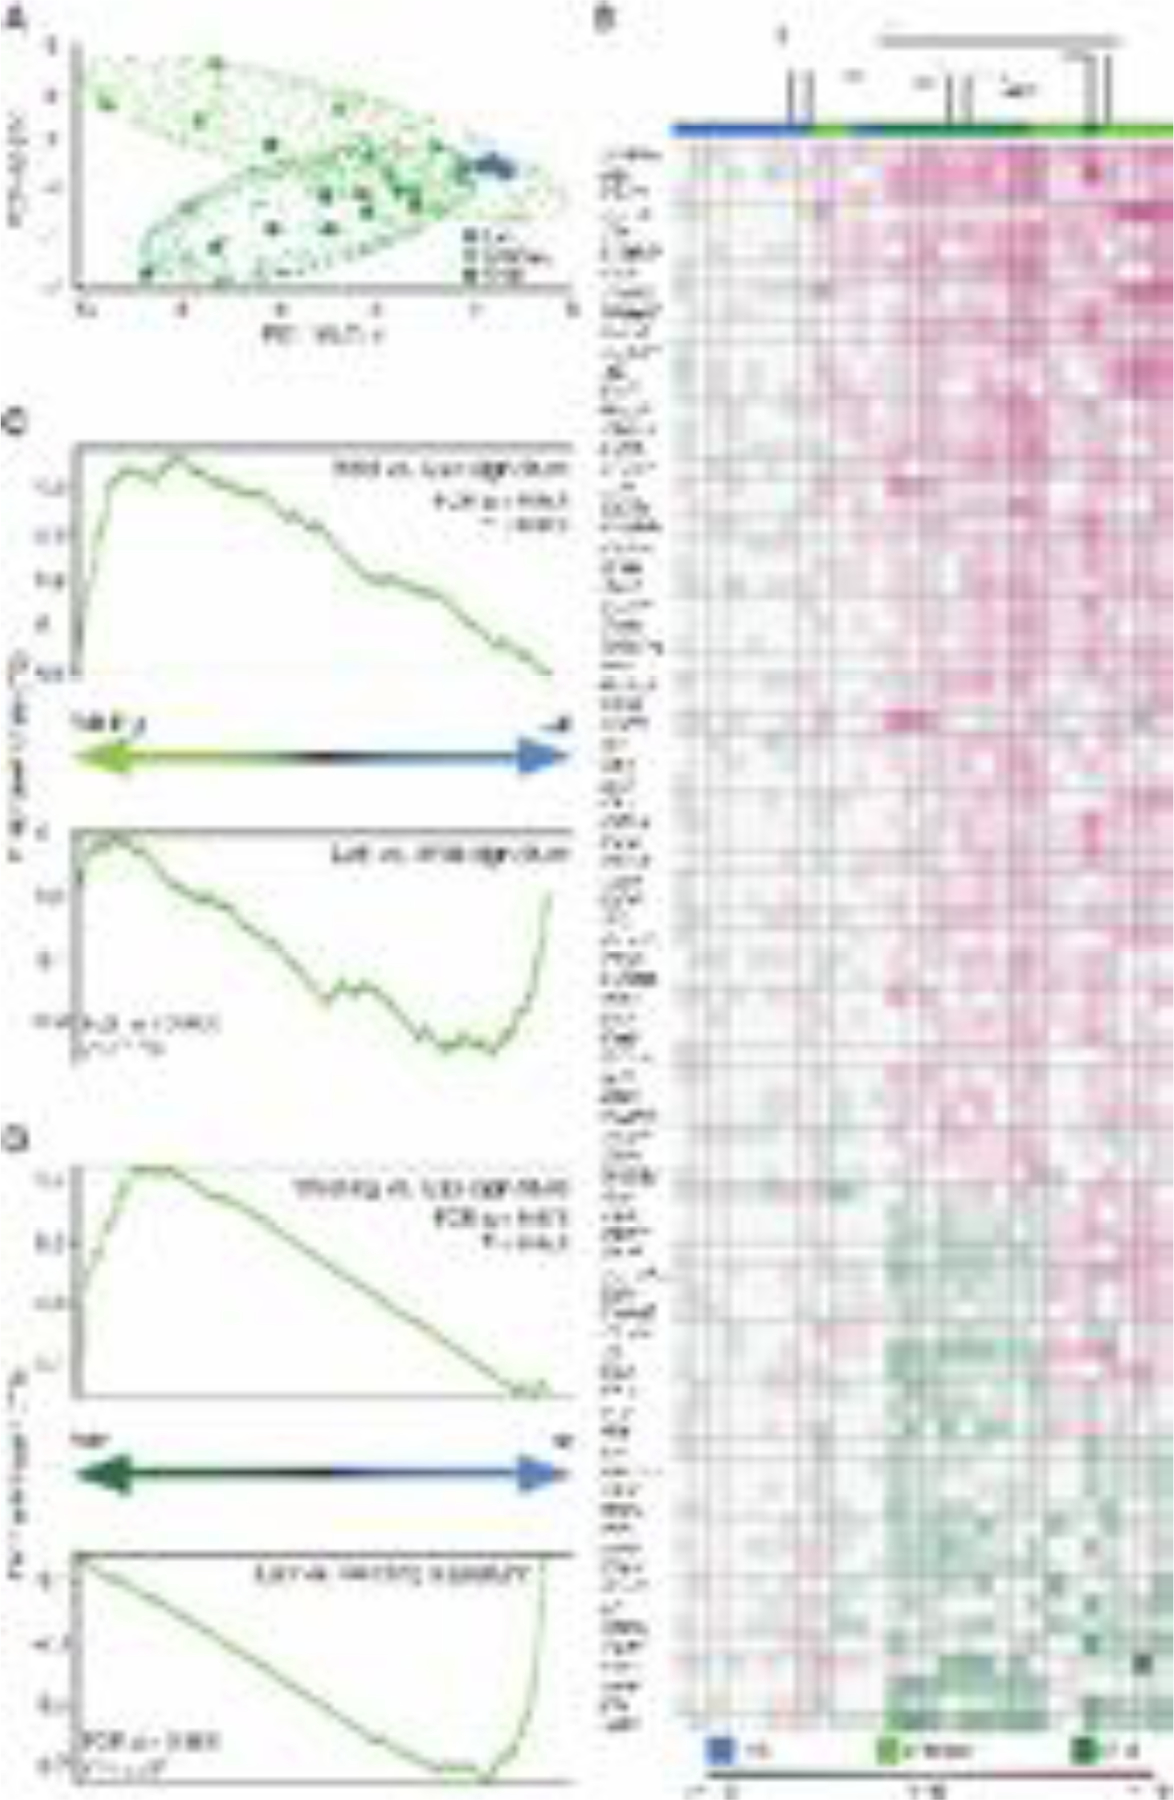
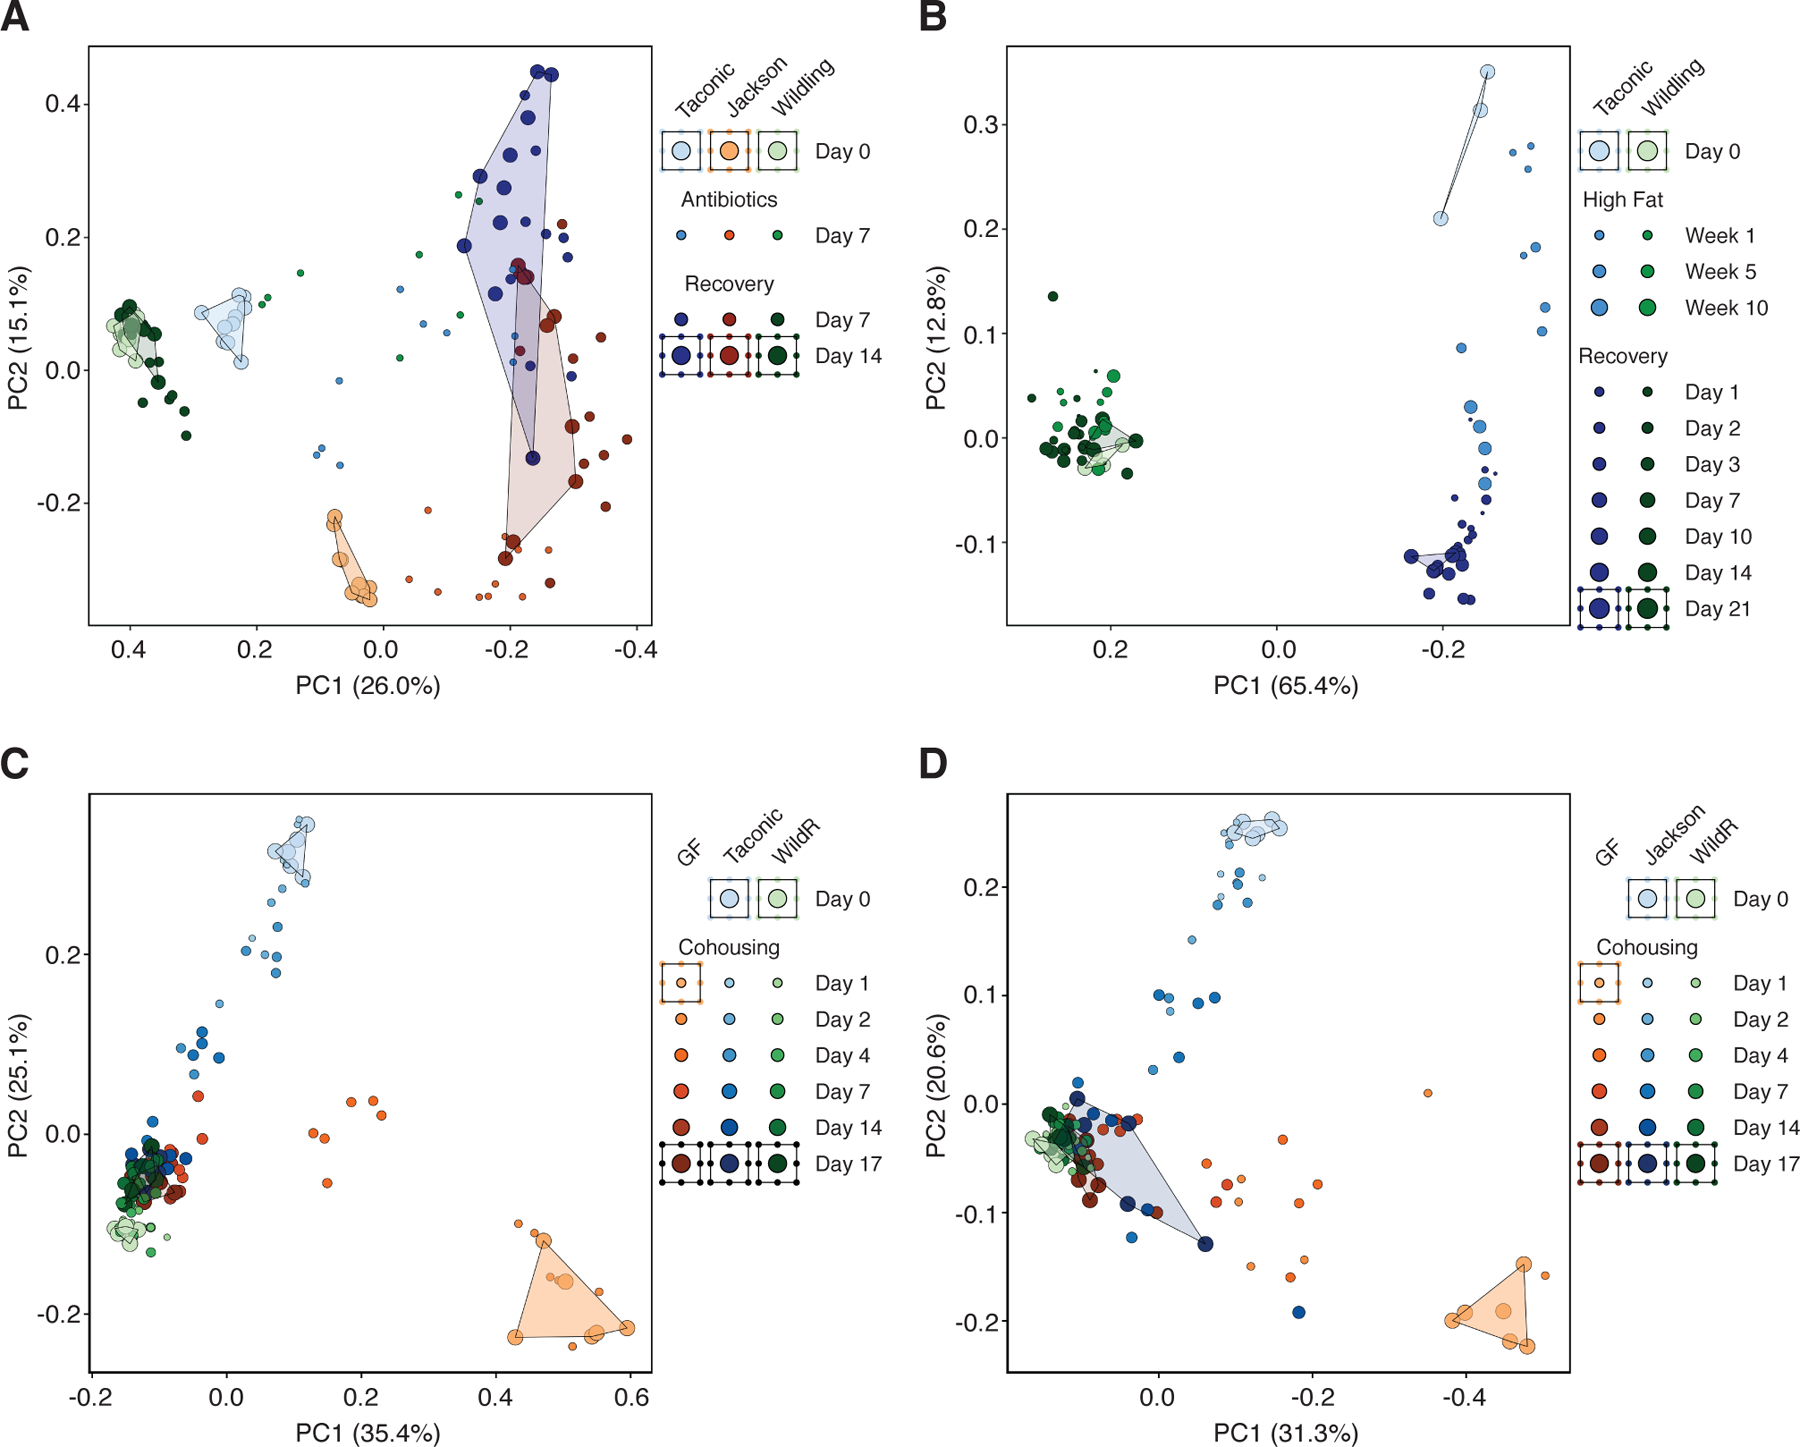
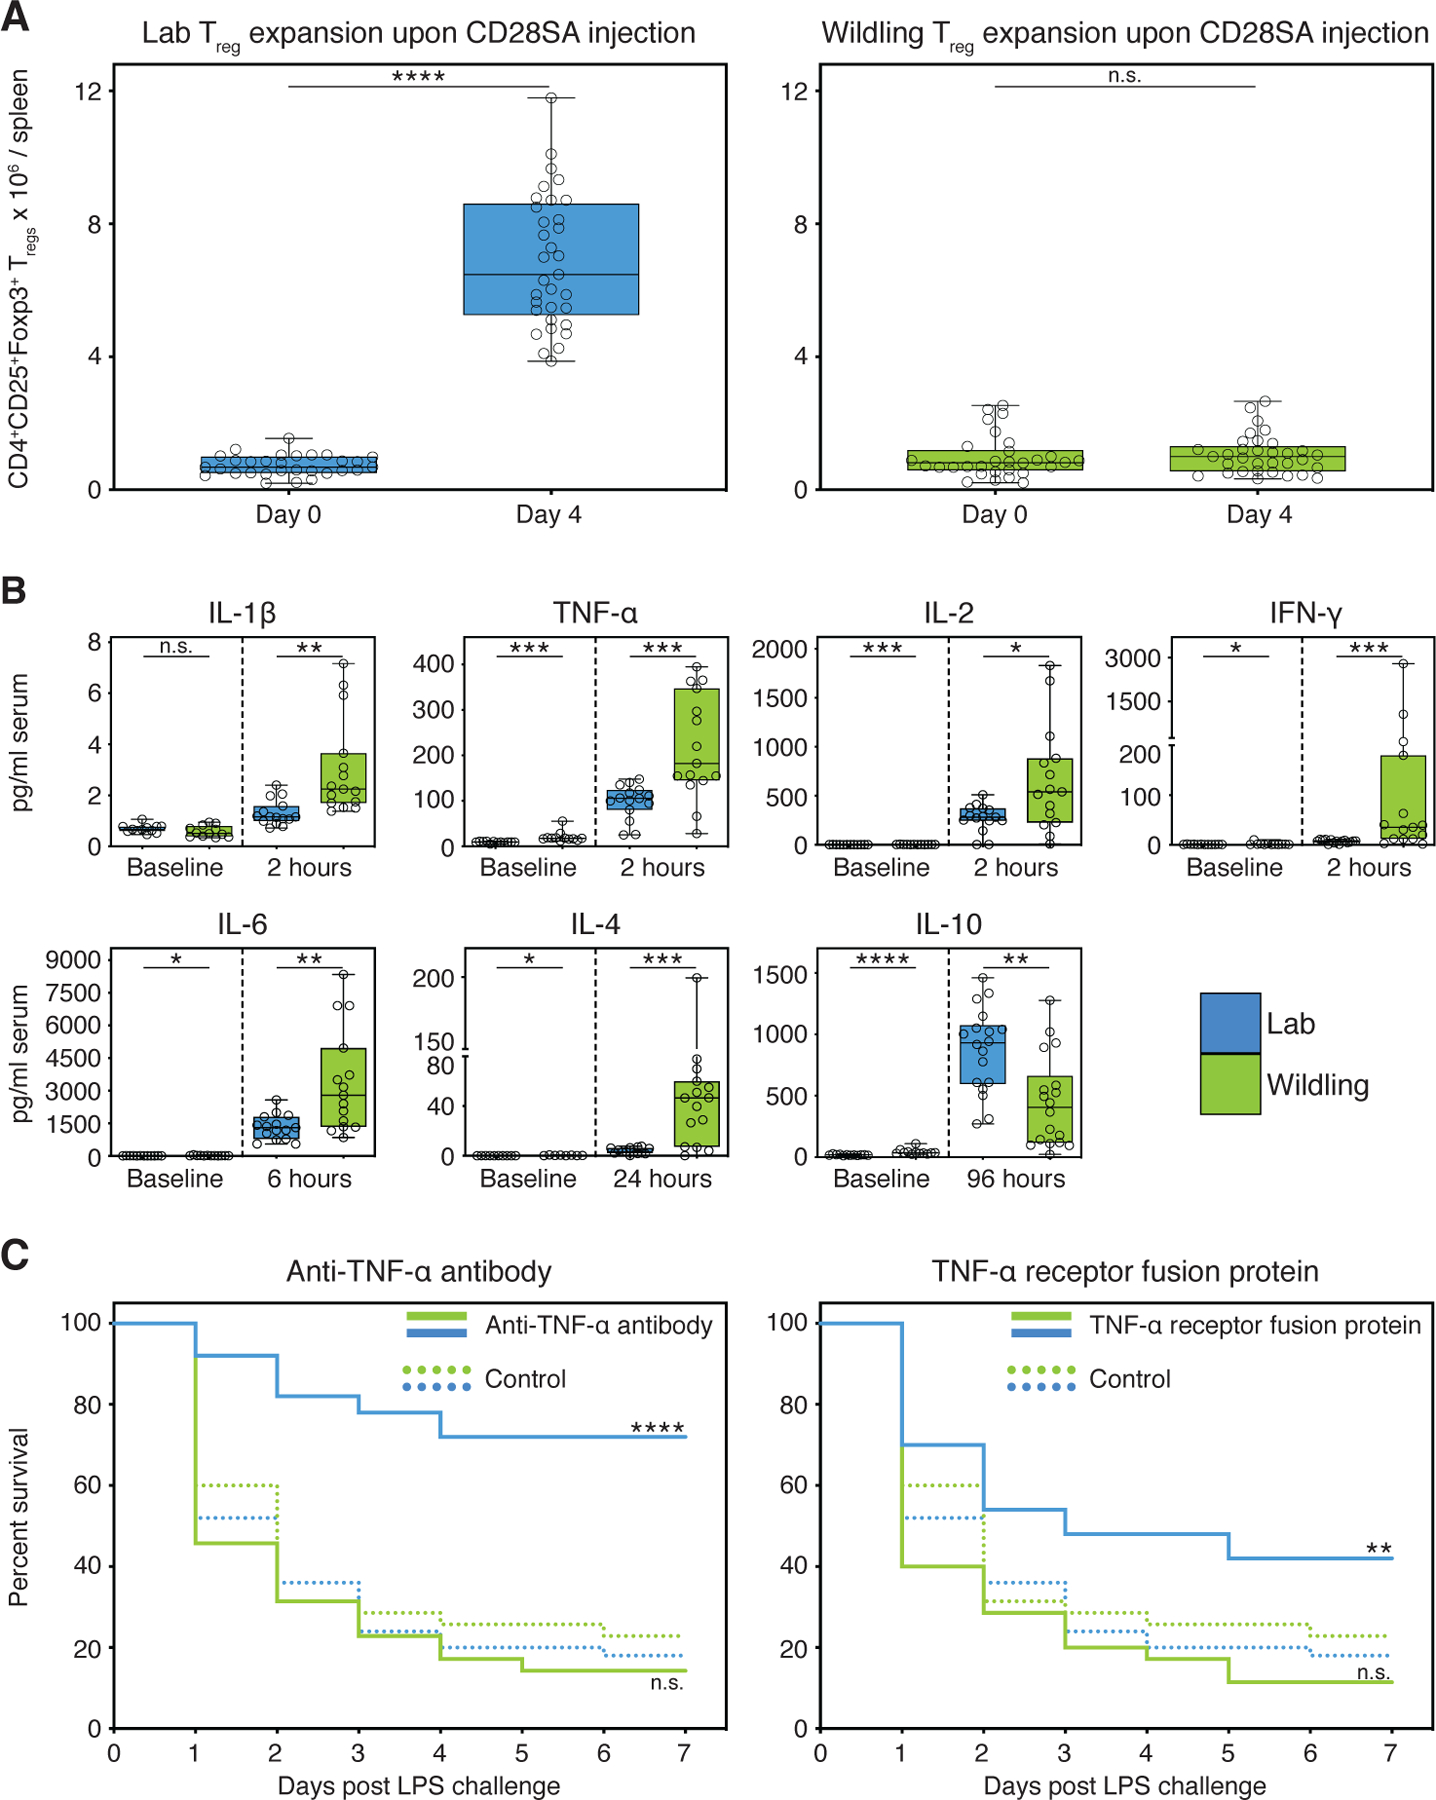
Laboratory mouse studies are paramount for understanding basic biological phenomena but also have limitations. These include conflicting results caused by divergent microbiota and limited translational research value. To address both shortcomings, we transferred C57BL/6 embryos into wild mice, creating "wildlings." These mice have a natural microbiota and pathogens at all body sites and the tractable genetics of C57BL/6 mice. The bacterial microbiome, mycobiome, and virome of wildlings affect the immune landscape of multiple organs. Their gut microbiota outcompete laboratory microbiota and demonstrate resilience to environmental challenges. Wildlings, but not conventional laboratory mice, phenocopied human immune responses in two preclinical studies. A combined natural microbiota- and pathogen-based model may enhance the reproducibility of biomedical studies and increase the bench-to-bedside safety and success of immunological studies.


Conflict of interest statement

Competing interests:

Authors declare no competing interests. S.P.R. and B.R. disclose that Taconic Biosciences licensed WildR mice with natural gut microbiota from NIDDK.

Figures

Fig. 1.
Fig. 1.. Wildlings resemble wild mice and differ significantly from conventional laboratory mice in their bacterial microbiome at major microbial niches and immunological barrier sites.
The bacterial microbiome of wildlings, wild mice (Wild), and conventional laboratory mice (Lab) was profiled at gut, skin and vagina by 16S rRNA sequencing: (A) Weighted UniFrac PCoA. (B and C) Relative abundance at the rank of phylum and family. (D) The heatmap shows the last known taxa with greatest variance among groups (log2-fold change values). Data shown are from 6 to 11 independent biological replicates per group. Each skin and vaginal replicate represents tissue pooled from 3 mice. Significance in (A) was determined by PERMANOVA.
Fig. 2.
Fig. 2.. Wildlings resemble wild mice and differ significantly from conventional laboratory mice in the composition and size of the gut mycobiome and virome.
ITS1–2 rDNA profiling and next generation virome sequencing data comparing the gut microbiome of wildlings, wild mice (Wild), and conventional laboratory mice (Lab). (A) Relative abundance of fungi by qPCR (18S) and ITS1–2 rDNA next generation sequencing; fungal DNA relative to total DNA (left); relative abundance at the rank of phylum by next generation sequencing (center and right). (B) Next-generation sequencing data for viruses and phages. Left panel: Total amount of reads. Center panel: Shannon α diversity index. Right panel: Relative abundance at the rank of family. Data shown are from 8–13 independent biological replicates per group. Box plots show median, IQR (box), and minimum to maximum (whiskers). *P < 0.05, **P < 0.01, ***P < 0.001; as determined by parametric one-way ANOVA with Tukey multiple comparison with 95% confidence interval (Gaussian model), or non-parametric Kruskal–Wallis H test with Dunn’s multiple comparison.
Fig. 3.
Fig. 3.. The microbial genome shapes the immune landscape of the spleen and contributes to the immune landscape of barrier sites and the liver.
CyTOF data characterizing and comparing the immune phenotype of wildlings, wild mice (Wild), and conventional laboratory mice (Lab) at major microbial niches and immunologically important epithelial barriers (A, B: Gut; C, D: Skin; E, F: Vagina), a central non-lymphoid organ (G, H: Liver), and a central lymphoid organ (I, J: Spleen).Left panels: Rphenograph analysis of immune phenotypes. Right panels: Unsupervised clustering of significantly different cell subsets. Labelled clusters are the most abundant and significantly different cell subsets between Lab and Wild. Each cell subset and heatmap row is labelled with the corresponding cluster numbers; median marker expression values of each cluster are visualized in Fig. S2. Data shown are from 6–10 independent biological replicates per group.
Fig. 4.
Fig. 4.. The microbial genome shapes the immune landscape of blood.
RNA sequencing data comparing the transcriptional profile of wildlings, wild mice (Wild), and conventional laboratory mice (Lab). (A) Principal component analysis of reads per kilobase million (RPKM) values of significantly deregulated immune-related genes in blood mononuclear cells. (B) Unsupervised clustering (Kendal) of immune-related genes that are differentially expressed in Wild versus Lab (log2–fold change values). (C, D) Gene set enrichment analysis (GSEA) of all genes with RPKM > 5. (C) Gene sets ranked by differential expression in wildling versus Lab; Wild vs. Lab and Lab vs. Wild signature (top 100 gene sets). (D) Gene sets ranked by differential expression in Wild versus Lab; Wildling vs. Lab and Lab vs. Wildling signature (top 100 gene sets). Data shown are from 9–10 independent biological replicates per group.
Fig. 5.
Fig. 5.. Natural gut microbiota are resilient and outcompete gut microbiota of conventional laboratory mice.
16S rRNA gene profiling data of bacterial gut microbiota during strong environmental disturbances, displayed by unweighted UniFrac PCoA’s. (A) Antibiotic challenge (amoxicillin/clavulanate) of wildlings, and conventional laboratory mice from Taconic and Jackson.(B) Dietary challenge (high-fat diet) of wildlings and conventional laboratory mice from Taconic. (C,D) Microbiological challenge through cohousing of 3 mice: a B6 mouse with pathogen-free wild mouse gut microbiota (WildR), a germ-free C57BL/6 mouse (GF) and a B6 mouse with conventional laboratory gut microbiota from Taconic (C), or Jackson (D). Data in panel B are from one experiment with 3–4 mice per group; data in panels A, C and D are from two independent experiments with 5–6 mice per group.
Fig. 6.
Fig. 6.. In contrast to standard laboratory models, the wildling model faithfully predicts the results of two clinical trials.
(A) Absolute numbers of Tregs at baseline (day 0) and day 4 post intraperitoneal CD28SA injection in wildlings and conventional laboratory mice (Lab). (B) Blood cytokine concentrations (pg/ml) at timepoint of greatest significant difference between wildlings and conventional laboratory mice. Significance was determined using unpaired two-tailed Student’s t-test (Gaussian model), or non-parametric Mann–Whitney U test. (C) Kaplan–Meier survival curves of wildlings in comparison to conventional laboratory mice (Lab). Mice were intraperitoneally injected with anti-TNF-α antibody, or TNF receptor:Fc fusion protein, or control antibody at hour −6, followed by a lethal intraperitoneal injection of Escherichia coli strain 0127:B8 LPS at hour 0. Data shown are from ≥ 3 independent experiments with 5–20 mice per group. Box plots show median, IQR (box), and minimum to maximum (whiskers). *P < 0.05, **P < 0.01, ***P < 0.001, ****P < 0.0001; as determined by log-rank (Mantel–Cox) analysis, n.s. = not significant.

Comment in

  • Walk on the wildling side.
    Nobs SP, Elinav E. Nobs SP, et al. Science. 2019 Aug 2;365(6452):444-445. doi: 10.1126/science.aay2864. Science. 2019. PMID: 31371599 No abstract available.
  • Gone Wildling: Building a Better Lab Mouse.
    [No authors listed] [No authors listed] Cancer Discov. 2019 Oct;9(10):1331. doi: 10.1158/2159-8290.CD-NB2019-100. Epub 2019 Aug 29. Cancer Discov. 2019. PMID: 31466945
  • Lab mice go native.
    Villanueva MT. Villanueva MT. Nat Rev Drug Discov. 2019 Sep;18(10):745. doi: 10.1038/d41573-019-00145-1. Nat Rev Drug Discov. 2019. PMID: 31570840 No abstract available.
  • A wild microbiome improves mouse modeling of the human immune response.
    Hamilton SE, Griffith TS. Hamilton SE, et al. Lab Anim (NY). 2019 Nov;48(11):337-338. doi: 10.1038/s41684-019-0421-8. Lab Anim (NY). 2019. PMID: 31591550 No abstract available.

References

    1. Ivanov II et al., Induction of intestinal Th17 cells by segmented filamentous bacteria. Cell 139, 485–498 (2009). - PMC - PubMed
    1. Servick K, Of mice and microbes. Science 353, 741–743 (2016). - PubMed
    1. Stappenbeck TS, Virgin HW, Accounting for reciprocal host-microbiome interactions in experimental science. Nature 534, 191–199 (2016). - PubMed
    1. von Herrath MG, Nepom GT, Lost in translation: barriers to implementing clinical immunotherapeutics for autoimmunity. J Exp Med 202, 1159–1162 (2005). - PMC - PubMed
    1. Hay M, Thomas DW, Craighead JL, Economides C, Rosenthal J, Clinical development success rates for investigational drugs. Nat Biotechnol 32, 40–51 (2014). - PubMed

Publication types