. 2019 Aug 1;10(1):3455.
doi: 10.1038/s41467-019-11119-7.

Cyfip1 haploinsufficient rats show white matter changes, myelin thinning, abnormal oligodendrocytes and behavioural inflexibility

Affiliations

Cyfip1 haploinsufficient rats show white matter changes, myelin thinning, abnormal oligodendrocytes and behavioural inflexibility

Ana I Silva et al. Nat Commun. .

Abstract

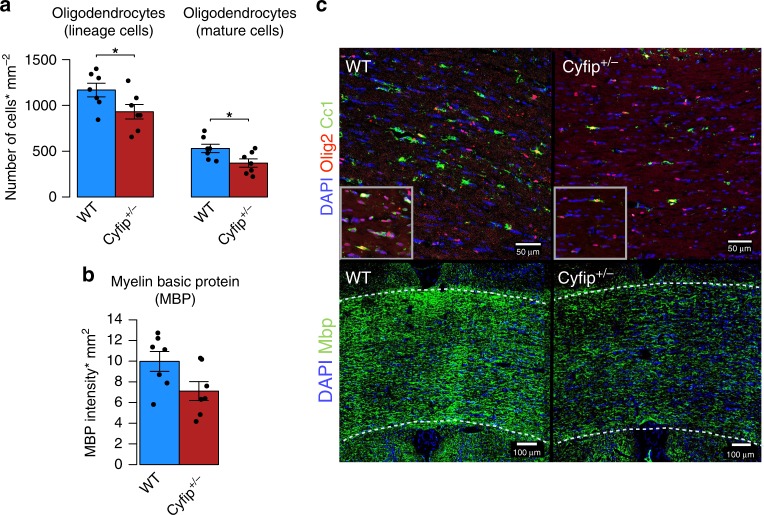
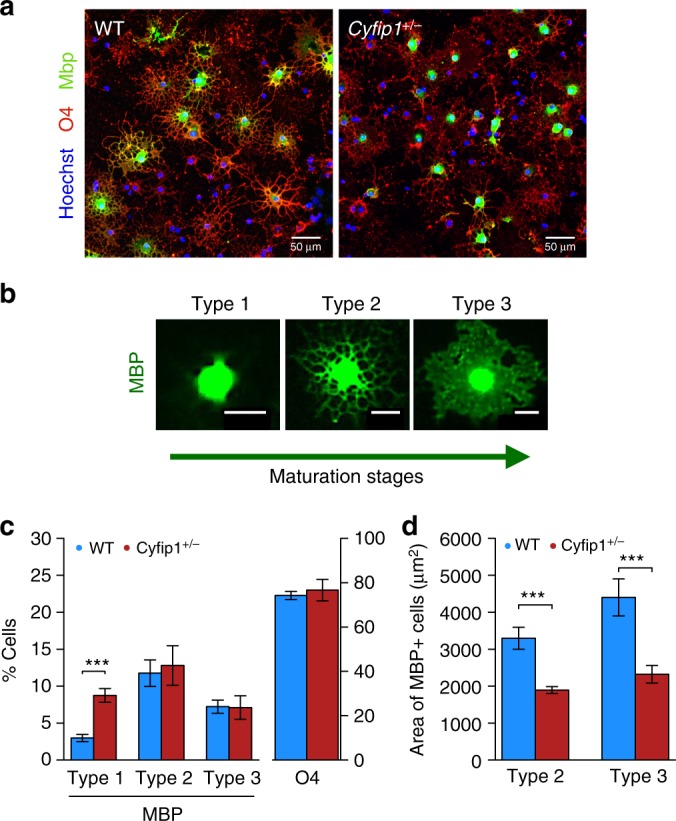
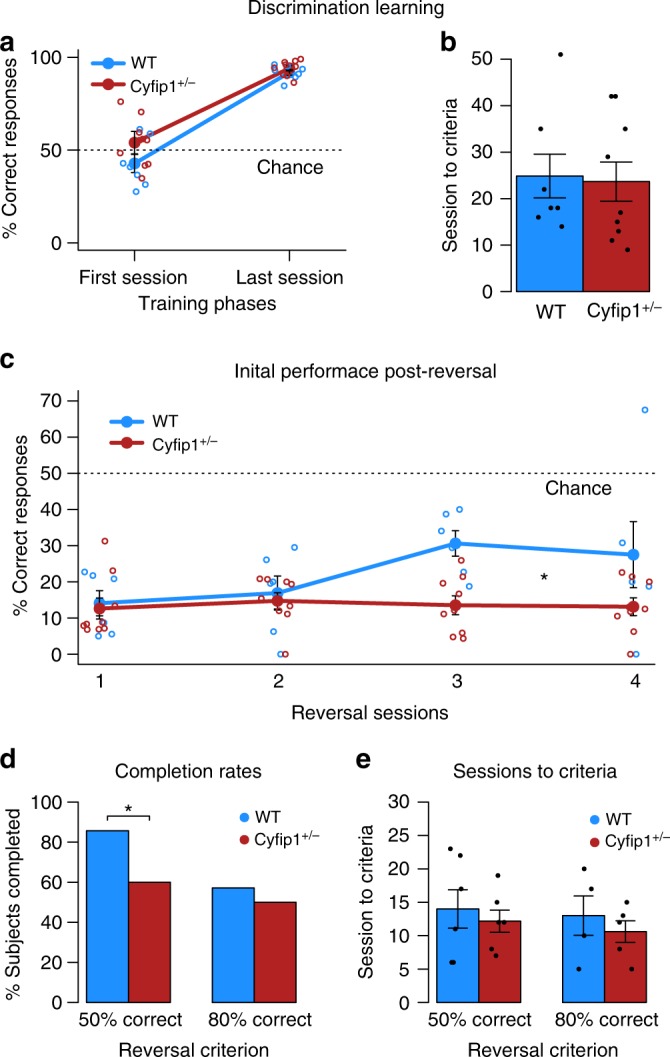
The biological basis of the increased risk for psychiatric disorders seen in 15q11.2 copy number deletion is unknown. Previous work has shown disturbances in white matter tracts in human carriers of the deletion. Here, in a novel rat model, we recapitulated low dosage of the candidate risk gene CYFIP1 present within the 15q11.2 interval. Using diffusion tensor imaging, we first showed extensive white matter changes in Cyfip1 mutant rats, which were most pronounced in the corpus callosum and external capsule. Transmission electron microscopy showed that these changes were associated with thinning of the myelin sheath in the corpus callosum. Myelin thinning was independent of changes in axon number or diameter but was associated with effects on mature oligodendrocytes, including aberrant intracellular distribution of myelin basic protein. Finally, we demonstrated effects on cognitive phenotypes sensitive to both disruptions in myelin and callosal circuitry.


Conflict of interest statement

The authors declare no competing interests.

Figures

Fig. 1
Fig. 1
Cyfip1 haploinsufficiency disrupts white matter microstructure. White matter changes comparing WT (n = 12) and Cyfip1+/− (n = 12) rats. Data shows significant group differences using two-tailed unpaired t-tests based on Threshold-Free Cluster Enhancement (TFCE) algorithm after a family-wise error (FWE) rate correction for fractional anisotropy (FA), and b false discovery rate (FDR) correction based on the Benjamini–Hochberg procedure for FA, axial diffusivity (AD), radial diffusivity (RD) and mean diffusivity (MD). All the parametric maps were generated at a significance level of p < 0.05. c Scale bars indicating the direction of the changes in both a, b, where relative decreases in Cyfip1+/− rats are represented by a gradient of blue (less significant) to green (more significant), and relative increases in Cyfip1+/− are represented by a gradient of red (less significant) to yellow (more significant)
Fig. 2
Fig. 2
Decreased myelin thickness in the corpus callosum in the Cyfip1+/−rats. a Representative electron micrographs of axons in the WT (n = 5 animals and n = 7148 axons) and Cyfip1+/− (n = 4 animals and n = 5979 axons) rats. b Schematic illustration of the axon and myelin sheath and calculation of the g-ratio and myelin thickness. c Mean number of myelinated (t = −0.63, df = 5.72, p = 0.55, ns) and unmyelinated axons per group (t = 0.39, df = 5.15, p = 0.71, ns), assessed with a two-tailed unpaired t-test. d Mean axon diameter of myelinated fibres per group (LME: χ2(1) = 0.05, p = 0.83). e Mean g-ratio per group (LME: χ2(1) = 2.03, p = 0.15) and mean myelin thickness per group (LME: χ2(1) = 14.63,***), showing significant decreased myelin thickness in Cyfip1+/− rats. f mean g-ratios calculated for small (n = 1510 WT and 1276 Cyfip1+/− axons; LME: χ2(1) = 4.23,*), medium-small (n = 2283 WT and 2043 Cyfip1+/− axons; LME: χ2(1) = 4.44,*), medium-large (n = 2551 WT and 1993 Cyfip1+/− axons; LME: χ2(1) = 7.14,**), and large (n = 804 WT and 667 Cyfip1+/− axons; LME: χ2(1) = 13.92,***) myelinated axons, showing significant increases in g-ratio in all different axon diameter ranges, and more significant in larger axons. g Scatter plot of myelin thickness values across all axon diameters WT (n = 7148 axons) and Cyfip1+/− (n = 5979 axons). Differences between axon diameter, g-ratio and myelin thickness measures were assessed using linear mixed effects (LME) models adjusted for individual variability. Data are mean ± SEM; *<0.05, **<0.01, ***<0.001. Source data are provided as a Source Data file
Fig. 3
Fig. 3
Altered number of oligodendrocyte lineage and mature cells, and levels of myelin basic protein (MBP), in the corpus callosum of the Cyfip1+/−rats. a Mean number of oligodendrocyte lineage (n = 7 each; t = 2.18, df = 11.94, *), stained with Olig2, and mature (n = 7 each; t = 2.48, df = 11.99, *), stained with Olig2 and Cc1, cells per mm2. b Mean MBP intensity multiplied by the percentage area (mm2) of the staining (n = 7 each; t = 2.16, df = 11.96, p = 0.052). c Representative images (at magnification ×20 (top) and ×10 (bottom)) for the following immunomarkers: DAPI, Olig2, Cc1 and Mbp in the corpus callosum of the WT and Cyfip1+/−rats. Scale bars = 50 μm (top) and 100 μm (bottom). Differences between groups were assessed using a two-tailed unpaired t-test. Data are mean ± SEM; *<0.05, **<0.01, ***<0.001. Source data are provided as a Source Data file
Fig. 4
Fig. 4
Cyfip1 haploinsufficiency influences the intracellular distribution of myelin basic protein (MBP) in cultured oligodendrocytes. a Immunostaining of oligodendrocytes for MBP and O4 from wild type (WT) and Cyfip1+/, scale bar = 50 μm, illustrating the punctate intracellular pattern of staining of MBP in Cyfip1+/ relative to the more diffused, widespread pattern of staining in WT. b Representative images of oligodendrocytes staining for MBP exhibiting features of Type 1 (MBP localised to the cell body), Type 2 (MBP ramifying into the cell processes), Type 3 (MBP distributed throughout the cell and within the membranes of cell processes) reflecting increasing maturation stages of oligodendrocytes, scale bar = 20 μm. c the effects of genotype on the percentage of Type 1 (n = 172 WT and 637 Cyfip1+/− cells; LME: χ2(1) = 68.49, ***), Type 2 (n = 735 WT and 905 Cyfip1+/− cells, LME: χ2(1) = 0.59, p = 0.44), Type 3 (n = 456 WT and 454 Cyfip1+/− cells; LME: χ2(1) = 0.02, p = 0.88), and O4 + cells (n = 4917 WT and 5789 Cyfip1+/− cells; LME: χ2(1) = 1.44, p = 0.23), as a proportion of all cells (n = 6623 WT and 7845 Cyfip1+/− cells) in the culture (stained with Hoechst); this panel also illustrates the effects of genotype on the overall proportion of differentiating oligodendrocytes as indexed by all cells staining for O4. d effects of genotype on the area of intracellular MBP staining in Type 2 (n = 491 WT and 591 Cyfip1+/− cells; LME: χ2(1) = 258.03, ***) and Type 3 (n = 265 WT and 341 Cyfip1+/− cells; LME: χ2(1) = 145.52, ***) oligodendrocytes, as depicted in the representative images in b. Values were obtained from 3 independent experiments. Differences between number of cells and area were quantified using linear mixed effects (LME) models adjusted for variability in each biological repeat. Data are mean ± SEM; *<0.05, **<0.01, ***<0.001. Source data are provided as a Source Data file
Fig. 5
Fig. 5
Cyfip1 haploinsufficient rats show deficits in behavioural flexibility in a reversal learning paradigm. WT (n = 7) and Cyfip1+/− (n = 9) rats successfully acquire the visual discrimination in the touchscreen boxes, reaching the same level of performance (% correct) a during the last session of training, and b reaching criteria in a similar number of sessions (ANOVA: F(1,14) = 0.03, p = 0.86). One Cyfip1+/− rat did not complete initial learning. c Cyfip1+/− rats show more persistent responses to the original stimulus response contingencies during the first few sessions of reversal, (WT (n = 6) and Cyfip1+/− (n = 9), ANOVA: GENOTYPE X SESSION interaction, F(3,39) = 3.76,*), where one of the WT rats did not start reversal learning task. d A larger proportion of Cyfip1+/− rats failed to reach the 50% correct criterion during reversal than WT rats, (Chi-squared: χ2 = 9.61,*). e However, those that do reach criteria do so in a similar number of sessions as WT rats (effect of GENOTYPE, ANOVA: 50% criteria (F(1,10) = 0.31, p = 0.59), and 80% criteria (F(1,7) = 0.44, p = 0.57). Data are mean ± SEM. *<0.05, **<0.01, ***<0.001. The raw number of animals completing each task can be seen in Supplementary Table 1a. Source data are also provided as a Source Data file
Fig. 6
Fig. 6
Cyfip1 haploinsufficient rats show deficits in flexible responses in orienting behaviour on a mismatch task. a There are no genotype effects on habituation to the experimental apparatus. Both WT (n = 21) and Cyfip1+/− (n = 15) show reduced activity to the experimental chambers over the course of each 30-min long session (5 min blocks). b Both WT and Cyfip1+/− rats showed reduced orienting to the auditory-visual sequences presented during training (ANOVA: F(1,34) = 2.4, p = 0.62), and c WT rats preferentially responded to the novel mismatched visual stimuli over the familiar matched stimuli (discrimination ratio <0.50). In contrast, Cyfip1+/− rats showed no preference, responding equally to both matched and mismatched visual cues (ANOVA: F(1,34) = 5.92,*). *<0.05, **<0.01, ***<0.001. Source data are provided as a Source Data file

Comment in

Similar articles

Cited by

References

    1. Cox DM, Butler MG. The 15q11.2 BP1–BP2 Microdeletion syndrome: a review. Int. J. Mol. Sci. 2015;16:4068–4082. doi: 10.3390/ijms16024068. - DOI - PMC - PubMed
    1. Butler MG. Clinical and genetic aspects of the 15q11.2 BP1–BP2 microdeletion disorder. J. Intellect. Disabil. Res. 2017;61:568–579. doi: 10.1111/jir.12382. - DOI - PMC - PubMed
    1. Chai J-H, et al. Identification of four highly conserved genes between breakpoint hotspots BP1 and BP2 of the prader-willi/angelman syndromes deletion region that have undergone evolutionary transposition mediated by flanking duplicons. Am. J. Hum. Genet. 2003;73:898–925. doi: 10.1086/378816. - DOI - PMC - PubMed
    1. De Rubeis S, et al. CYFIP1 coordinates mRNA translation and cytoskeleton remodeling to ensure proper dendritic spine formation. Neuron. 2013;79:1169–1182. doi: 10.1016/j.neuron.2013.06.039. - DOI - PMC - PubMed
    1. Lozano R, Rosero CA, Hagerman RJ. Fragile X spectrum disorders. Intractable Rare Dis. Res. 2014;3:134–146. doi: 10.5582/irdr.2014.01022. - DOI - PMC - PubMed

Publication types

MeSH terms