Spatial Regulation of Mitochondrial Heterogeneity by Stromal Confinement in Micropatterned Tumor Models
- PMID: 31371796
- PMCID: PMC6671984
- DOI: 10.1038/s41598-019-47593-8
Spatial Regulation of Mitochondrial Heterogeneity by Stromal Confinement in Micropatterned Tumor Models
Abstract
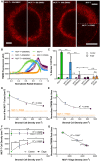
Heterogeneity of mitochondrial activities in cancer cells exists across different disease stages and even in the same patient, with increased mitochondrial activities associated with invasive cancer phenotypes and circulating tumor cells. Here, we use a micropatterned tumor-stromal assay (μTSA) comprised of MCF-7 breast cancer cells and bone marrow stromal cells (BMSCs) as a model to investigate the role of stromal constraints in altering the mitochondrial activities of cancer cells within the tumor microenvironment (TME). Using microdissection and RNA sequencing, we revealed a differentially regulated pattern of gene expression related to mitochondrial activities and metastatic potential at the tumor-stromal interface. Gene expression was confirmed by immunostaining of mitochondrial mass, and live microscopic imaging of mitochondrial membrane potential (ΔΨm) and optical redox ratio. We demonstrated that physical constraints by the stromal cells play a major role in ΔΨm heterogeneity, which was positively associated with nuclear translocation of the YAP/TAZ transcriptional co-activators. Importantly, inhibiting actin polymerization and Rho-associated protein kinase disrupted the differential ΔΨm pattern. In addition, we showed a positive correlation between ΔΨm level and metastatic burden in vivo in mice injected with MDA-MB-231 breast cancer cells. This study supports a new regulatory role for the TME in mitochondrial heterogeneity and metastatic potential.
Conflict of interest statement
The authors declare no competing interests.
Figures


Similar articles
-
Precise targeting of transcriptional co-activators YAP/TAZ annihilates chemoresistant brCSCs by alteration of their mitochondrial homeostasis.Signal Transduct Target Ther. 2025 Feb 21;10(1):61. doi: 10.1038/s41392-025-02133-x. Signal Transduct Target Ther. 2025. PMID: 39979255 Free PMC article.
-
Prostate tumor-induced stromal reprogramming generates Tenascin C that promotes prostate cancer metastasis through YAP/TAZ inhibition.Oncogene. 2022 Feb;41(6):757-769. doi: 10.1038/s41388-021-02131-7. Epub 2021 Nov 29. Oncogene. 2022. PMID: 34845375 Free PMC article.
-
Type I collagen deposition via osteoinduction ameliorates YAP/TAZ activity in 3D floating culture clumps of mesenchymal stem cell/extracellular matrix complexes.Stem Cell Res Ther. 2018 Dec 7;9(1):342. doi: 10.1186/s13287-018-1085-9. Stem Cell Res Ther. 2018. PMID: 30526677 Free PMC article.
-
Non-hippo kinases: indispensable roles in YAP/TAZ signaling and implications in cancer therapy.Mol Biol Rep. 2023 May;50(5):4565-4578. doi: 10.1007/s11033-023-08329-0. Epub 2023 Mar 6. Mol Biol Rep. 2023. PMID: 36877351 Review.
-
Multiple roles and context-specific mechanisms underlying YAP and TAZ-mediated resistance to anti-cancer therapy.Biochim Biophys Acta Rev Cancer. 2020 Jan;1873(1):188341. doi: 10.1016/j.bbcan.2020.188341. Epub 2020 Jan 10. Biochim Biophys Acta Rev Cancer. 2020. PMID: 31931113 Review.
Cited by
-
Mitochondrial heterogeneity in diseases.Signal Transduct Target Ther. 2023 Aug 23;8(1):311. doi: 10.1038/s41392-023-01546-w. Signal Transduct Target Ther. 2023. PMID: 37607925 Free PMC article. Review.
-
Microfabricated Organ-Specific Models of Tumor Microenvironments.Annu Rev Biomed Eng. 2025 May;27(1):307-333. doi: 10.1146/annurev-bioeng-110222-103522. Annu Rev Biomed Eng. 2025. PMID: 40310890 Free PMC article. Review.
-
Cancer cell metabolic plasticity in migration and metastasis.Clin Exp Metastasis. 2021 Aug;38(4):343-359. doi: 10.1007/s10585-021-10102-1. Epub 2021 Jun 2. Clin Exp Metastasis. 2021. PMID: 34076787 Review.
-
Novel Approach to Skin Anti-Aging: Boosting Pharmacological Effects of Exogenous Nicotinamide Adenine Dinucleotide (NAD+) by Synergistic Inhibition of CD38 Expression.Cells. 2024 Oct 30;13(21):1799. doi: 10.3390/cells13211799. Cells. 2024. PMID: 39513906 Free PMC article.
-
Engineered in vitro tumor models for cell-based immunotherapy.Acta Biomater. 2021 Sep 15;132:345-359. doi: 10.1016/j.actbio.2021.03.076. Epub 2021 Apr 20. Acta Biomater. 2021. PMID: 33857692 Free PMC article. Review.
References
-
- Morais R, et al. Tumor-forming Ability in Athymic Nude Mice of Human Cell Lines Devoid of Mitochondrial DNA. Cancer Res. 1994;54:3889–3896. - PubMed
Publication types
MeSH terms
Substances
Grants and funding
LinkOut - more resources
Full Text Sources
Medical
Molecular Biology Databases
Miscellaneous

