. 2019 Aug 1;9(1):11184.
doi: 10.1038/s41598-019-47705-4.

Aspergillus oryzae spore germination is enhanced by non-thermal atmospheric pressure plasma

Affiliations

Aspergillus oryzae spore germination is enhanced by non-thermal atmospheric pressure plasma

Mayura Veerana et al. Sci Rep. .

Abstract

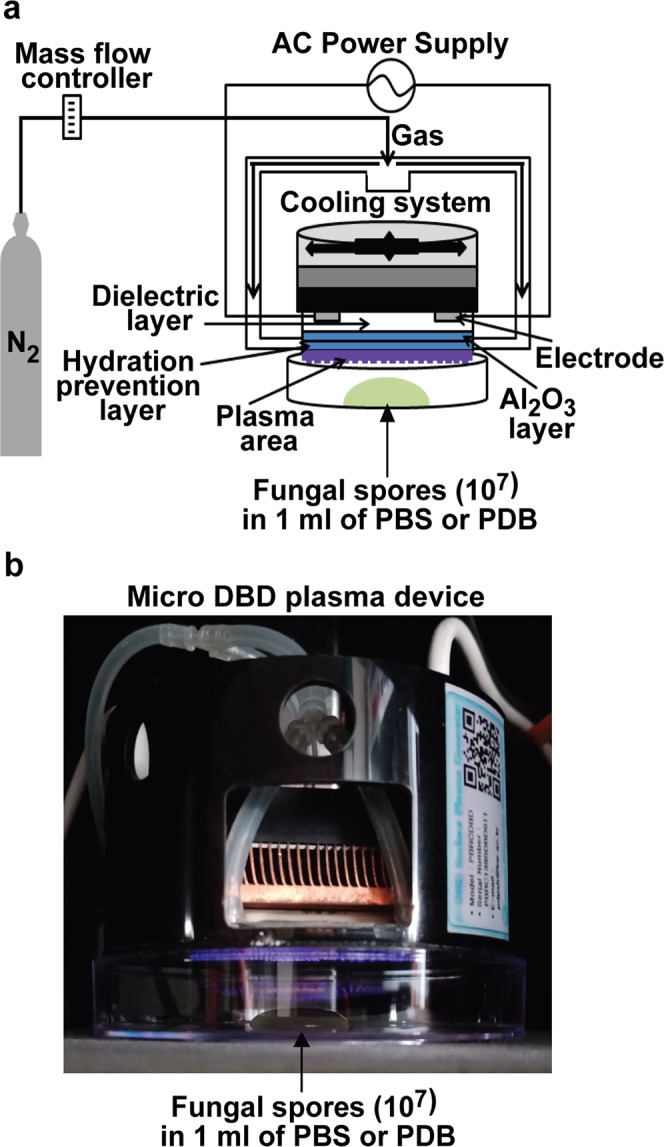
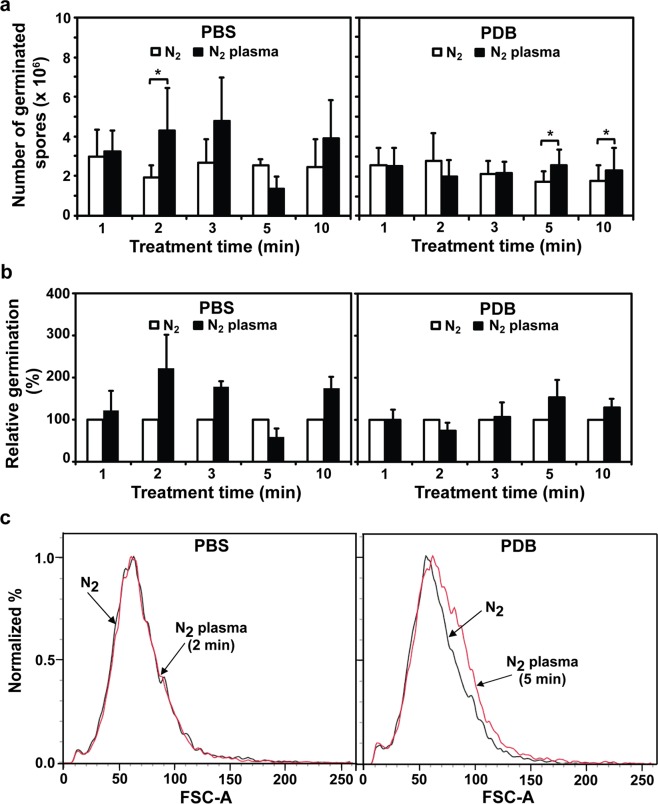
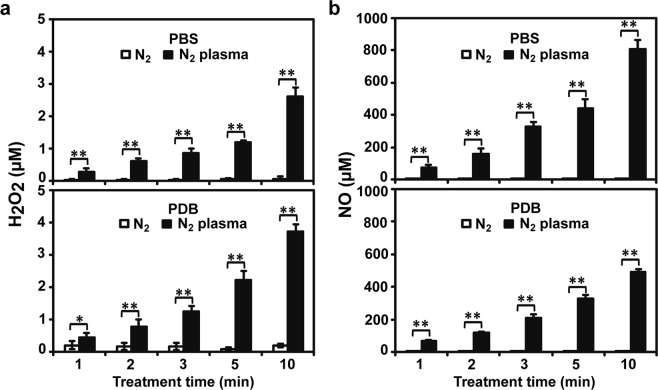
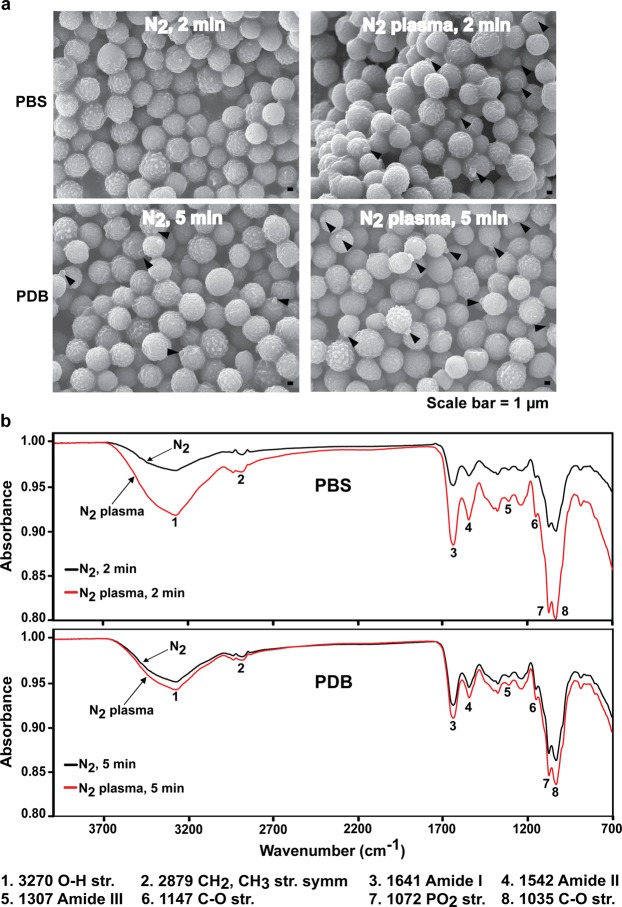
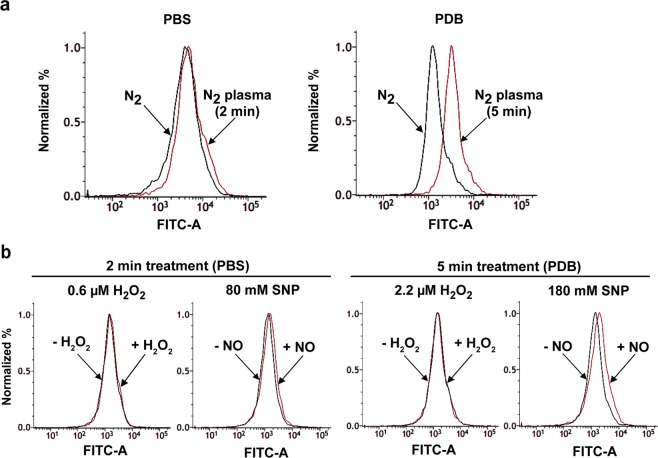
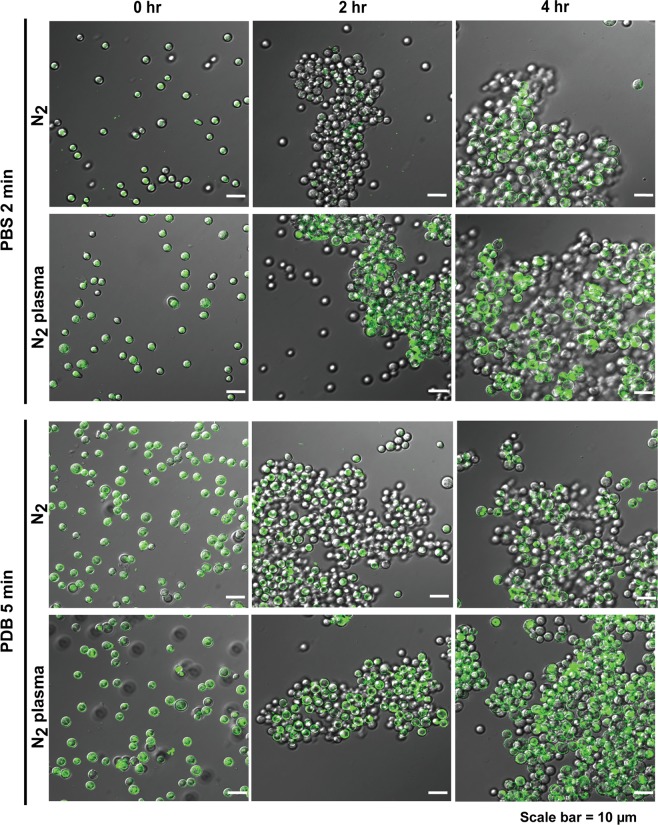
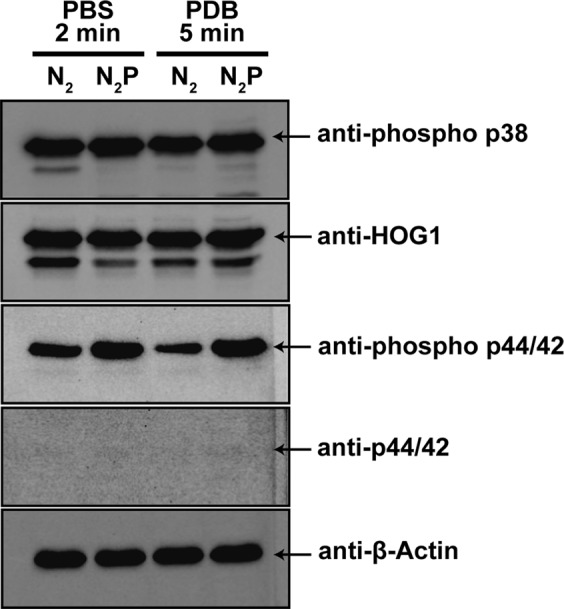
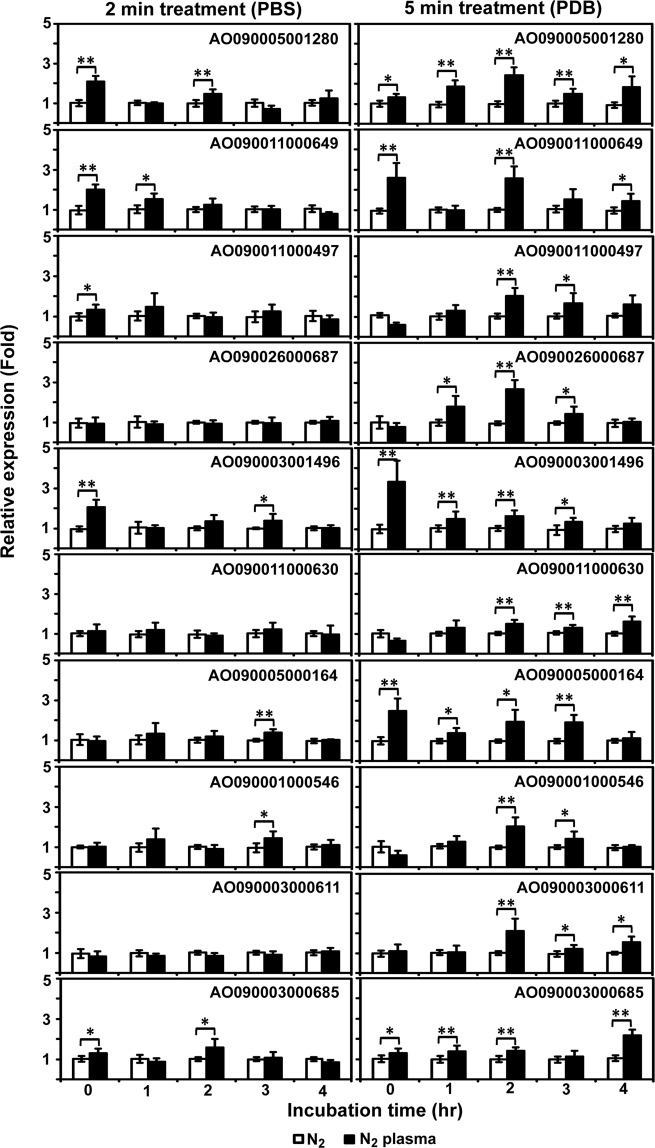
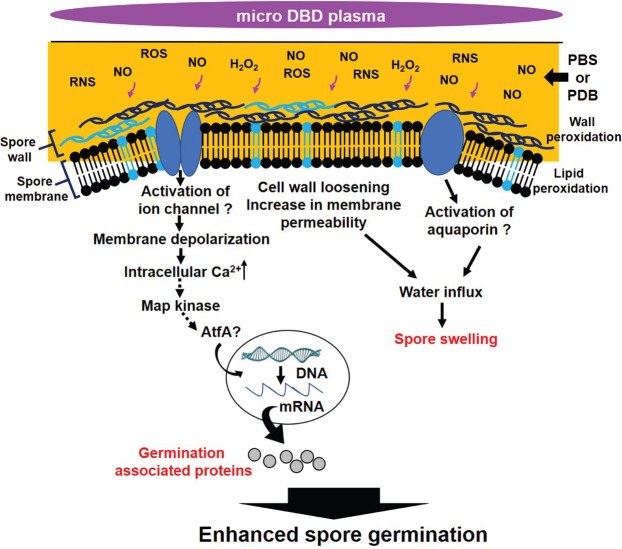
Poor and unstable culture growth following isolation presents a technical barrier to the efficient application of beneficial microorganisms in the food industry. Non-thermal atmospheric pressure plasma is an effective tool that could overcome this barrier. The objective of this study was to investigate the potential of plasma to enhance spore germination, the initial step in fungal colonization, using Aspergillus oryzae, a beneficial filamentous fungus used in the fermentation industry. Treating fungal spores in background solutions of phosphate buffered saline (PBS) and potato dextrose broth (PDB) with micro dielectric barrier discharge plasma using nitrogen gas for 2 and 5 min, respectively, significantly increased the germination percentage. Spore swelling, the first step in germination, was accelerated following plasma treatment, indicating that plasma may be involved in loosening the spore surface. Plasma treatment depolarized spore membranes, elevated intracellular Ca2+ levels, and activated mpkA, a MAP kinase, and the transcription of several germination-associated genes. Our results suggest that plasma enhances fungal spore germination by stimulating spore swelling, depolarizing the cell membrane, and activating calcium and MAPK signaling.


Conflict of interest statement

The authors declare no competing interests.

Figures

Figure 1
Figure 1
Non-thermal micro DBD plasma device. (a) Schematic of the micro DBD plasma device and the experimental set-up for fungal spore treatment with plasma. (b) Photograph of spore plasma treatment.
Figure 2
Figure 2
Germination of fungal spores following plasma treatment. (a) Number of germinated A. oryzae spores after treatment with nitrogen (N2) gas (control) and plasma in PBS or PDB. (b) Relative spore germination percentage following plasma treatment compared to that of the control (N2 gas treatment): (number of germinated spores treated with plasma or gas/number of germinated spores treated with gas only) × 100. (c) FACS analysis of spore size. Spores treated with plasma in PBS and PDB for 2 min and 5 min, respectively, were analyzed. Black and red lines represent N2 gas (control) and plasma treatment, respectively. Each value was averaged from a total of 24 replicates in (a,b) and FACS analysis was repeated once in (c). *p < 0.05.
Figure 3
Figure 3
Reactive species levels in background solutions after plasma treatment. (a) H2O2 concentrations in PBS and PDB after treatment with nitrogen (N2) gas and plasma. (b) NO concentrations in PBS and PDB after treatment with N2 gas and plasma. Each value represents the mean of 6–9 replicate measurements. *p < 0.05 and **p < 0.01.
Figure 4
Figure 4
Effect of plasma on spore surface. (a) Surface morphology of fungal spores analyzed via SEM after plasma treatment for 2 and 5 min in PBS and PDB solutions, respectively. Arrows indicate the protruded germ tube. (b) FTIR spectra of fungal spores following plasma treatment in PBS and PDB for 2 min and 5 min, respectively. Black and red lines represent N2 gas and plasma treatments, respectively.
Figure 5
Figure 5
Analysis of A. oryzae spore membrane potential by DiBAC4(3) staining. Histograms show the proportion of fungal spores with different fluorescence intensities following DiBAC4 staining (3). Fluorescence indicates that the cell membrane is depolarized. (a) The proportion of fungal spores exhibiting different fluorescence intensities following plasma treatment for 2 min in PBS and 5 min in PDB. Black and red lines represent spores treated with nitrogen (N2) gas (control) and plasma, respectively. (b) The proportion of fungal spores exhibiting different fluorescence intensities following treatment with the indicated concentrations of SNP or H2O2 dissolved in PBS and PDB. Treatment time was 2 min for PBS and 5 min for PDB solutions. Black and red lines represent spores treated without and with H2O2 and SNP, respectively.
Figure 6
Figure 6
Intracellular Ca2+ levels in fungal spores following plasma treatment. Fungal spores labeled with the Fluo-3-AM probe examined under a confocal laser scanning microscope at laser 488 nm. Fungal spores were treated with nitrogen gas and plasma for 2 min in PBS and 5 min in PDB solutions and then incubated at 30 °C for 0, 2, and 4 h.
Figure 7
Figure 7
Western blot analysis of MAPK phosphorylation following plasma treatment. Total proteins were extracted from fungal spores incubated for 4 h following plasma treatment (2 min in PBS and 5 min in PDB). N2; treatment with only N2 gas, N2P; treatment with N2 and plasma. Arrows indicate protein bands corresponding to each MAP kinase (hogA or mpkA) with or without phosphorylation and β-actin (reference protein). The phosphorylation and protein levels of each MAP kinase were detected using following antibodies: hogA (expected molecular weight 41.8 kDa); anti-phospho p38 (phosphorylation) and anti-Hog1 (protein), mpkA (expected molecular weight 47.8 kDa); anti-phospho p44/42 (phosphorylation) and anti-p44/42 (protein).
Figure 8
Figure 8
Expression of germination-related genes following plasma treatment in PBS and PDB. The mRNA levels of 10 germination-related genes were quantified using QPCR. Spores were treated with nitrogen plasma for 2 min in PBS and 5 min in PDB and then incubated for 0, 1, 2, 3, and 4 h. Each value is the mean of 3–9 replicate measurements. *p < 0.05, **p < 0.01.
Figure 9
Figure 9
Proposed model for the mechanism(s) of plasma-activated spore germination.

Similar articles

Cited by

References

    1. Vivek N, et al. Recent advances in the production of value added chemicals and lipids utilizing biodiesel industry generated crude glycerol as a substrate - Metabolic aspects, challenges and possibilities: An overview. Bioresour. Technol. 2017;239:507–517. doi: 10.1016/j.biortech.2017.05.056. - DOI - PubMed
    1. Zhang YHP, Sun JB, Ma YH. Biomanufacturing: history and perspective. J. Ind. Microbiol. Biotechnol. 2017;44:773–784. doi: 10.1007/s10295-016-1863-2. - DOI - PubMed
    1. Feng R, Chen L, Chen K. Fermentation trip: amazing microbes, amazing metabolisms. Ann. Microbiol. 2018;68:717–729. doi: 10.1007/s13213-018-1384-5. - DOI
    1. Tortorella E, et al. Antibiotics from deep-sea microorganisms: current discoveries and perspectives. Marine Drugs. 2018;16:16. doi: 10.3390/md16100355. - DOI - PMC - PubMed
    1. Clomburg JM, Crumbley AM, Gonzalez R. Industrial biomanufacturing: The future of chemical production. Science. 2017;355:11. doi: 10.1126/science.aag0804. - DOI - PubMed

Publication types

MeSH terms