. 2019 Aug;21(8):1003-1014.
doi: 10.1038/s41556-019-0363-9. Epub 2019 Aug 1.

IMP dehydrogenase-2 drives aberrant nucleolar activity and promotes tumorigenesis in glioblastoma

Affiliations

IMP dehydrogenase-2 drives aberrant nucleolar activity and promotes tumorigenesis in glioblastoma

Satoshi Kofuji et al. Nat Cell Biol. 2019 Aug.

Abstract

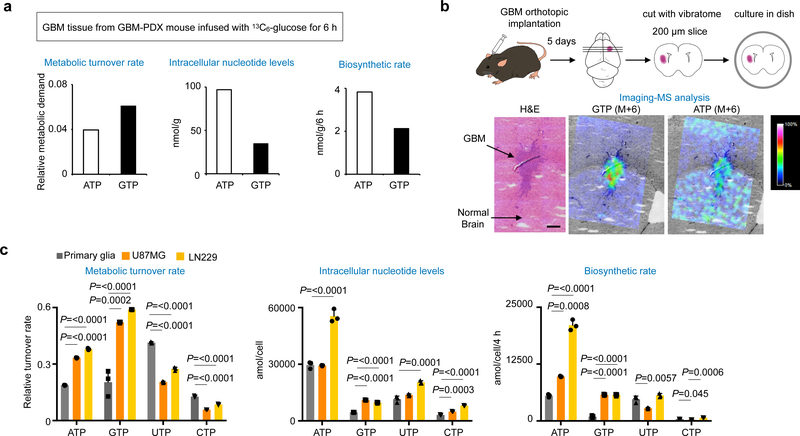
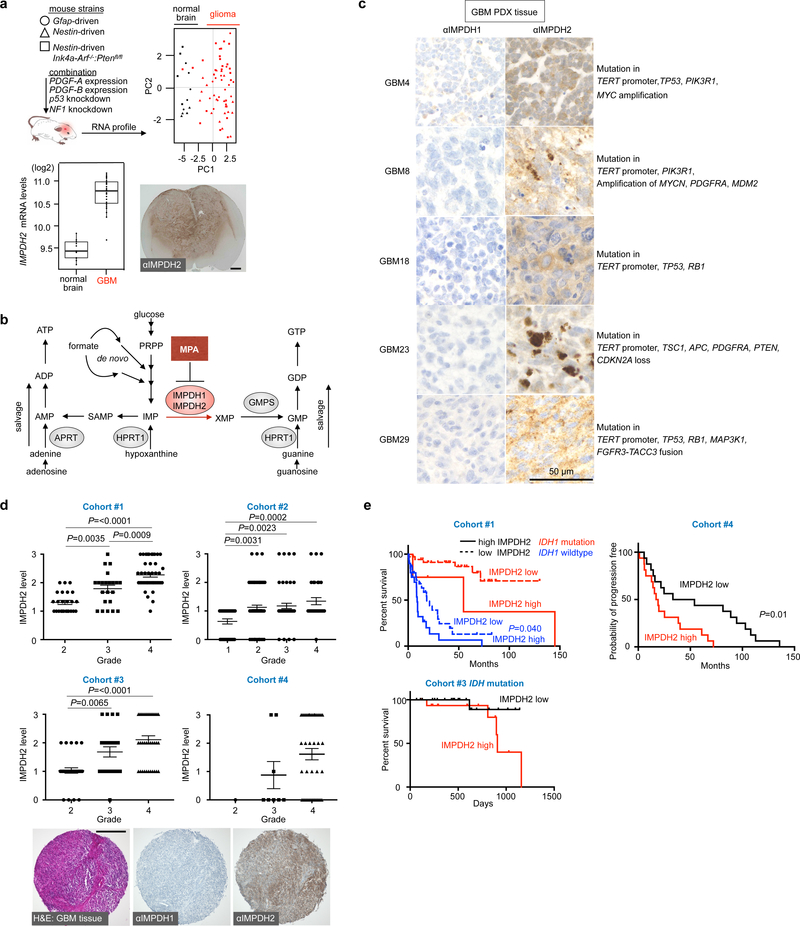
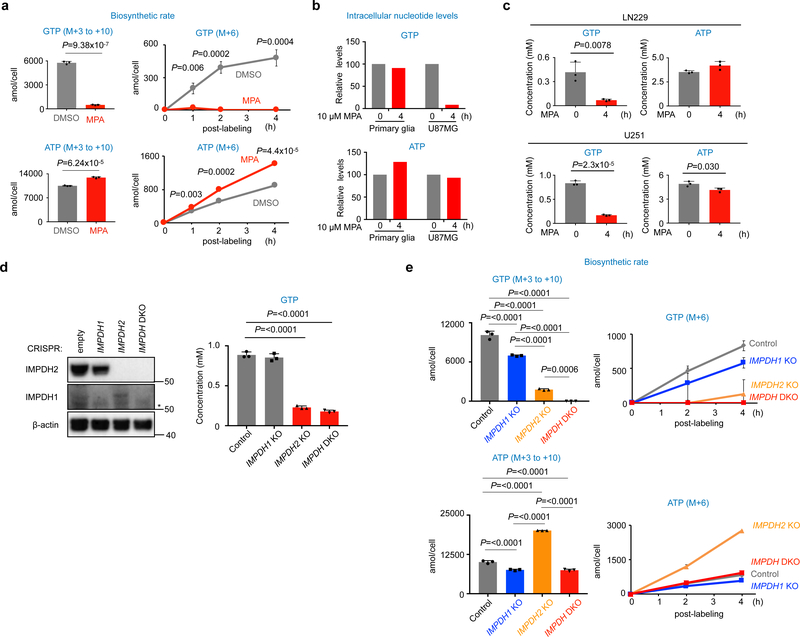
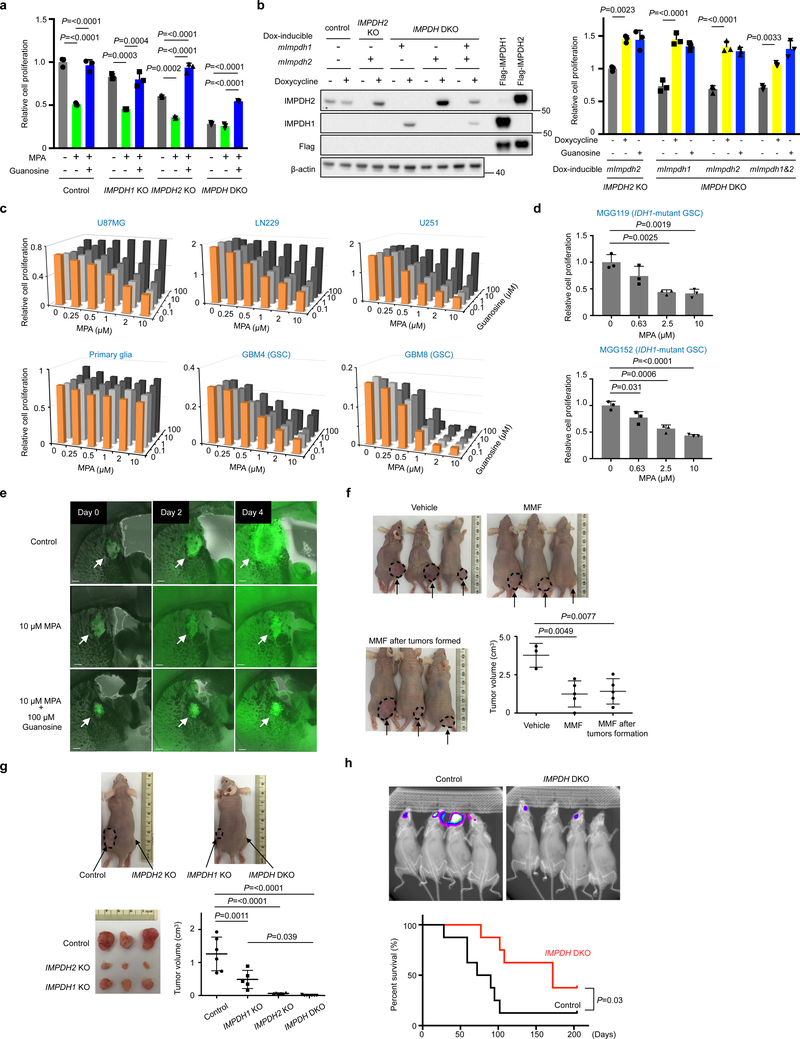
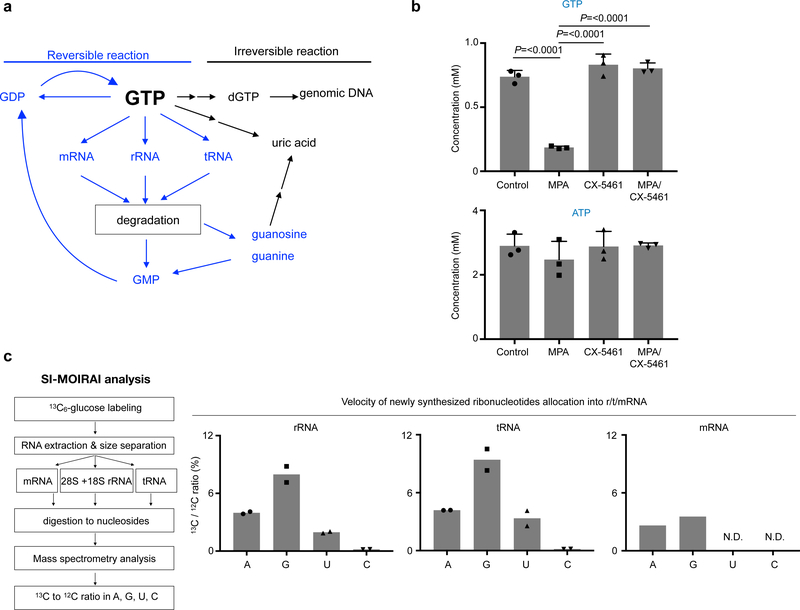
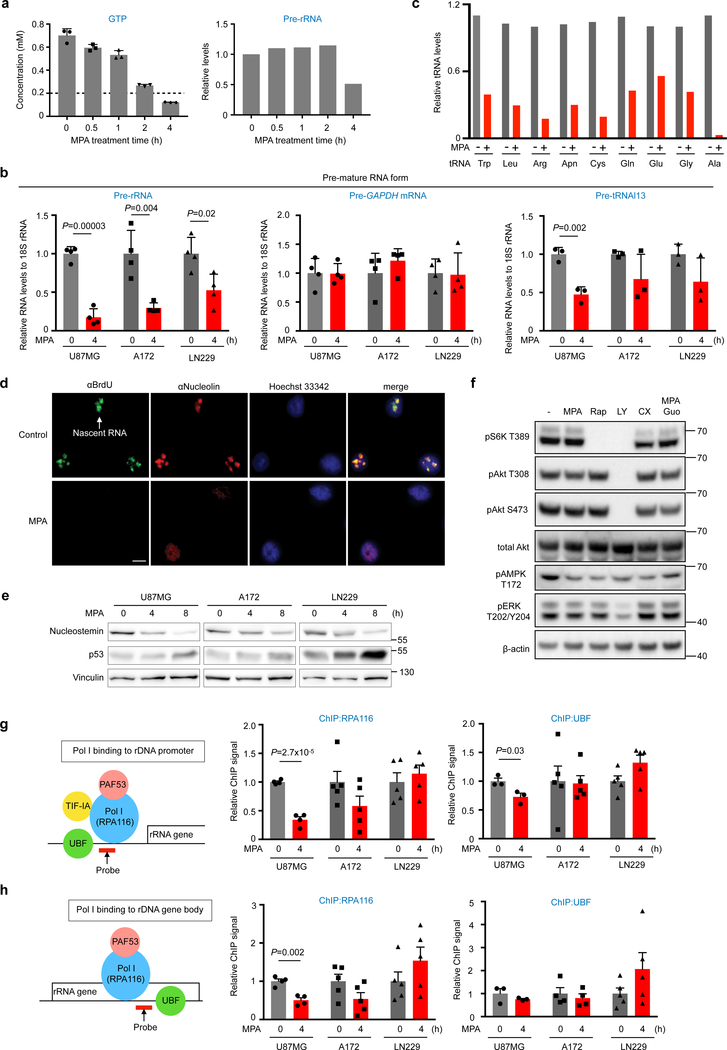
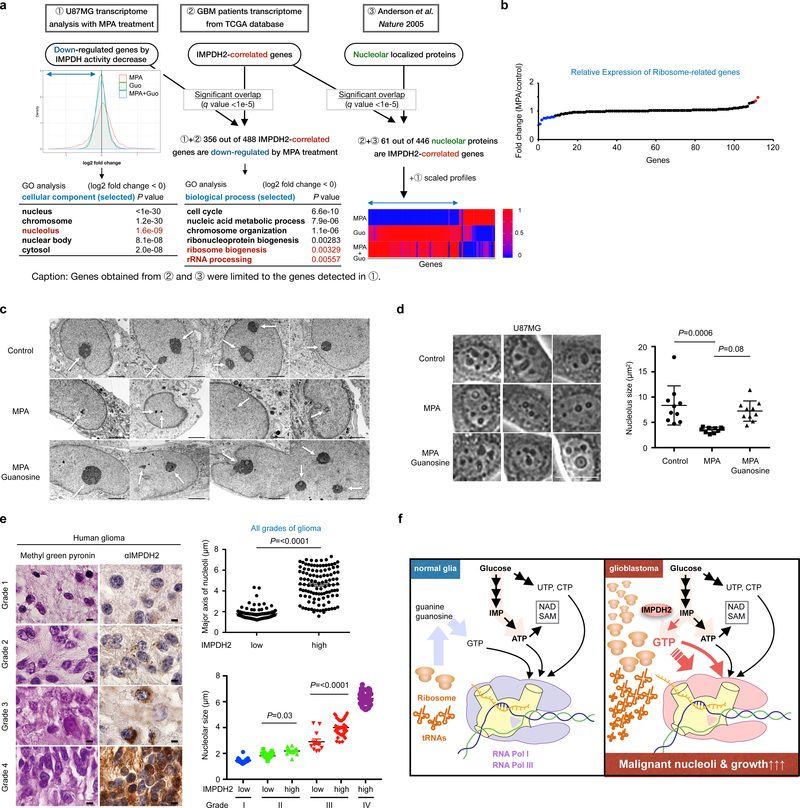
In many cancers, high proliferation rates correlate with elevation of rRNA and tRNA levels, and nucleolar hypertrophy. However, the underlying mechanisms linking increased nucleolar transcription and tumorigenesis are only minimally understood. Here we show that IMP dehydrogenase-2 (IMPDH2), the rate-limiting enzyme for de novo guanine nucleotide biosynthesis, is overexpressed in the highly lethal brain cancer glioblastoma. This leads to increased rRNA and tRNA synthesis, stabilization of the nucleolar GTP-binding protein nucleostemin, and enlarged, malformed nucleoli. Pharmacological or genetic inactivation of IMPDH2 in glioblastoma reverses these effects and inhibits cell proliferation, whereas untransformed glia cells are unaffected by similar IMPDH2 perturbations. Impairment of IMPDH2 activity triggers nucleolar stress and growth arrest of glioblastoma cells even in the absence of functional p53. Our results reveal that upregulation of IMPDH2 is a prerequisite for the occurance of aberrant nucleolar function and increased anabolic processes in glioblastoma, which constitutes a primary event in gliomagenesis.


Conflict of interest statement

Competing interest

R.J.D. is an advisor for Agios Pharmaceuticals. P.S.M. is a cofounder, has equity and serves as a consultant for Pretzel Therapeutics, Inc.

Figures

Fig. 1 |
Fig. 1 |. Upregulation of GTP biosynthesis in human and murine GBM.
a, Metabolic turnover of GTP is higher than the other nucleotides in GBM-PDX mouse model. Metabolic turnover rate of the indicated nucleotides is calculated based on intracellular pool size (middle) and biosynthetic rate (right) of ribonucleotides in the GBM tissues infused with [U-13C]glucose for 6 h. b, Murine GBM brain section was treated with [U-13C]glucose and subjected to imaging-mass spectrometry (MS) analysis. M+6 GTP was detected in organotypic GBM but not in normal brain tissue, while M+6 ATP was detected both in GBM and normal brain tissue. Representative images were shown from 2 independent experiments. Scale bar indicates 300 μm. c, Metabolic turnover of GTP is higher than the other nucleotides in GBM cells, not in primary glia. Metabolic turnover rate of the indicated nucleotides is calculated based on intracellular pool size (middle) and biosynthetic rate (bottom) of ribonucleotides in the indicated cells labeled with [U-13C]glucose for 4 h. Data are presented as mean+s.d. n=3 biologically independent samples. One-way ANOVA.
Fig. 2 |
Fig. 2 |. Upregulation of IMPDH2 in human and murine GBM.
a, Principal component analysis in ten clinically relevant glioma mouse models by Illumina cDNA microarray (upper). Black dots are control normal brain samples, red dots are glioma samples. The experiment contains the gene expression profiles from 13 normal and 59 glioma mice (n=72). Impdh2 expression at mRNA levels (lower left) and immunohistochemical (IHC) analysis of IMPDH2 in the Nestin-driven Pdgf-B in lnk4a-arf−/−;Ptenfl/fl mouse brain (lower right). Boxplots follow a Turkey style, in which lower and upper hinges correspond to the first and third quartiles. The IHC image is a representative one from 4 independent animals. Scale bar indicates 1000 μm. b, A schematic diagram of purine biosynthesis pathway. c, GBM tissue from the GBM PDX mouse expresses IMPDH2, while IMPDH1 protein was undetectable level. n=1 experiment. d, Analysis of four cohorts showed the increased IMPDH2 expression in human glioma specimens with different WHO grades (bottom). H&E staining of GBM and representative IHC for IMPDH1 and IMPDH2. Data are presented as mean±s.e.m. n=91 for Cohort#1, n=191 for Cohort#2, n=91 for Cohort#3, n=53 for Cohort#4. One-way ANOVA. The IHC image is the representative one from Cohort#4 (n=53). Scale bar indicates 300 μm. e, Kaplan-Meier survival curves shown for three cohorts of glioma patients on the basis of IDH mutational status (Cohort #1 (n=90), #3 (n=38)) and the relative strength of cytoplasmic IMPDH2 expression. Cohort #4 (n=32) is progression-free survival and the others are overall survival. Log-rank tests (two-sided) were used for the statistical analysis.
Fig. 3 |
Fig. 3 |. IMPDH2 reprograms GTP-metabolism in GBM.
a, Biosynthetic rate of GTP, but not ATP, is decreased by pharmacological inhibition of IMPDH in U87MG cells. Isotopomer distribution (M+6) of GTP and ATP from [U-13C]glucose is shown in right. Data are presented as mean+s.d. n=3 biologically independent samples. Unpaired two-sided Student’s t-test. b, GTP levels were decreased by 4 h of MPA treatment in U87MG cells. n=1 experiment. c, Pharmacological inhibition of IMPDH activity leads to acute decrease of GTP concentration, but not ATP in GBM cells. The indicated cells were treated with 10 μM MPA for 4 h and GTP and ATP concentrations were quantified by HPLC for U251 cells and CE-MS for LN229 cells. Data are presented as mean+s.d. n=3 biologically independent samples. Unpaired two-sided Student’s t-test. d, The indicated IMPDH KO U87MG cells were generated by the CRISPR/Cas9 system as in the Method. Western blot shows the upregulation of IMPDH1 in IMPDH2 KO U87MG and LN229 cells. Cells were maintained with 100 μM guanosine supplemented media, which was replaced to DMEM/10% dialyzed FBS media 24 h before the assay. GTP levels were quantified by HPLC. Data are presented as mean+s.d. n=3 biologically independent samples. One-way ANOVA. Western blot analysis was performed at least twice. e, IMPDH2 KO and IMPDH DKO U87MG decreased biosynthetic rate of GTP. The assay was performed as in (a). Data are presented as mean+s.d. n=3 biologically independent samples. One-way ANOVA.
Fig. 4 |
Fig. 4 |. IMPDH2 promotes growth of GBM cells in vitro and in vivo.
a, IMPDH2 KO and IMPDH DKO U87MG cells decrease cell proliferation and MPA sensitivity. Data are presented as mean+s.d. n=3 biologically independent samples. One-way ANOVA. Western blot showing inducible expression of mouse (m)Impdh1 and mImpdh2, which are insensitive to IMPDH sgRNA-mediated targeting. b, Reconstitution by doxycycline (Dox)-inducible mouse (m)Impdh1 and mImpdh2, which are insensitive to IMPDH sgRNA-mediated targeting, rescue the cell proliferation defect of IMPDH2 KO and IMPDH DKO U87MG cells. Data are presented as mean+s.d. n=3 biologically independent samples. One-way ANOVA. n=1 experiment for Western blot analysis. c, MPA treatment suppresses GBM cell proliferation, but not primary glia. Data are shown as an average of 2 biologically independent samples. d, MPA treatment suppresses IDH1-mutated GBM stem cell proliferation. Data are presented as mean+s.d. n=3 biologically independent samples. One-way ANOVA. e, Growth of murine GSC in brain tissue is inhibited by MPA. GFP-expressing murine GSC brain explant slices in immunocompetent mice were cultured with or without 10 μΜ MPA and 100 μM guanosine. Scale bar indicates 300 μm. n=1 experiment. Similar MPA responses were confirmed in Supplementary Figure 5a. f, Clinically used IMPDH inhibitor (mycophenolate mofetil, MMF,,) suppresses GBM growth in vivo. MMF was orally administrated (120 mg/kg) to immuno-compromised mice after subcutaneous implantation of U87MG cells. Vehicle (n=3), MMF treatment (n=5). In one group, MMF treatment was initiated after tumor sizes reached 200 mm3. Mice were assessed at day 35. Arrows and dot circles indicate tumors. Data are presented as mean±s.d. One-way ANOVA. g, IMPDH2 KO and IMPDH DKO significantly decrease in vivo tumorigenic activity. The indicated U87MG cells were injected subcutaneously in immunocompromised mice and assessed at day 37. Control (n=6), IMPDH1 KO (n=5), IMPDH2 KO (n=6), IMPDH DKO (n=7). Arrows and dot circles indicate tumors. Data are presented as mean±s.d. One-way ANOVA. h, Orthotopic xenografts derived from IMPDH DKO U87MG cells were less progressive and mice survived longer than those with wildtype U87MG (upper). Bioluminescence imaging was performed 4 weeks after the implantation. Data are from Control (n=8) and IMPDH DKO (n=8). Log-rank test (two-sided) was used for the statistical analysis.
Fig. 5 |
Fig. 5 |. SI-MOIRAI analysis identified metabolic fate of GTP for rRNA and tRNA synthesis.
a, A schematic diagram of reversible and irreversible reaction of GTP metabolism. b, GTP depletion by IMPDH inhibition is abolished by Pol I inhibition. GTP and ATP concentrations quantified by HPLC in 10 μM MPA (4 h) and 1 μM CX-5461 (CX) (5 h including 1 h pretreatment)-treated U87MG cells. Data are presented as mean+s.d. n=3 biologically independent samples. One-way ANOVA. c, A schematic flow of SI-MOIRAI analysis (left). Metabolic utility of newly synthesized nucleotides into r/m/tRNA. Ratio of the newly synthesized 13C-labeled nucleosides to total nucleosides in indicated RNA species are shown as percentile (right). n=2 biologically independent samples for r/tRNA, n=1 sample for mRNA. N.D. stands for not detectable.
Fig. 6 |
Fig. 6 |. De novo GTP biosynthesis is critical for rRNA and tRNA transcription in GBM.
a, GTP concentrations were quantified by HPLC and pre-rRNA levels were analyzed by quantitative (Q)-PCR in 10 μM MPA-treated U87MG cells. Data are presented as mean+s.d. n=3 biologically independent samples for GTP measurements, n=1 biologically independent sample normalized from three technical replicates for Q-PCR. b, Nascent transcripts of the indicated genes were analyzed by Q-PCR. Data are presented as mean+s.d. Biologically independent samples for Pre-rRNA (n=4), Pre-GAPDH mRNA (n=4), and Pre-tRNAl13 (n=3). Unpaired two-sided Student’s t-test. c, Mature form of the indicated genes was analyzed by Q-PCR. n=1 biologically independent sample normalized from three technical replicates. d, IMPDH inhibition diminishes nucleolar transcriptions and evokes nucleolar stress response. U87MG cells were treated with MPA for 4 h and 5-fluorouridine for 20 min. Nascent RNA and nucleolus were visualized by anti-BrdU and anti-nucleolin antibodies, respectively. Data are representatives from n=2 independent experiments. Scale bar indicates 20 μm. e, Acute inhibition of IMPDH activity in the indicated GBM cells decrease nucleostemin levels, one of the nucleolar stress responses, with concomitant increase of p53 protein. Data are representatives from n=3 independent experiments. f, Acute inhibition of IMPDH activity has marginal effect on the PI3K, mTOR and ERK/RSK signaling pathways. Western blotting of lysates from U87MG cells, treated with 10 μM MPA, 100 μM guanosine (Guo), 10 nM Rapamycin (Rap), 50 μM LY294002 (LY), 1 μM CX-5461(CX) for 4 h. MPA responses were confirmed in two independent experiments. g, h, Coordinated suppression of RNA Pol I upon IMPDH inhibition in GBM. The indicated GBM cells were treated with or without MPA for 4 h. Binding of RPA116, a subunit of Pol I and UBF, an architectural factor to promoter (f) and gene body (g) of rRNA gene was assessed by ChIP assay. Data are presented as mean+s.e.m. n=4 biologically independent samples for RPA116 of U87MG (g, h) and UBF of A172 (h), n=3 for UBF of U87MG (g, h), n=5 for RPA116 (g, h) and UBF (g) of A172, RPA116 and UBF of LN229 (g, h). Unpaired two-sided Student’s t-test.
Fig. 7 |
Fig. 7 |. IMPDH2 upregulation is critical for nucleolar transformation in GBM.
a, Two-dimensional (2D) transcriptome screening reveals IMPDH2-network and its association with nucleolar activity in GBM. The Gene Ontology (GO) analysis of IMPDH activity-associated genes (left) and the genes associated with both IMPDH2-expression and IMPDH-activity (right) are shown in the tables. Bottom right show the expression of genes encoding nucleolar localizing proteins that are correlated with IMPDH2 mRNA expression in the GBM patient transcriptome. b, 10 μM MPA treatment (24 h) marginally affect the expression of genes encoding ribosomal subunits in U87MG. Red color is for >1.3-fold increased genes, while blue for the >1.3-fold decreased genes. n=1 experiment. c, U87MG cells were treated with or without 10 μM MPA, guanosine for 72 h and analyzed by transmission electron microscope (x 6,000). Scale bar indicates 2 μm. n=1 experiment. d, IMPDH inhibition leads to decrease nucleolar size in U87MG. The area of nucleoli from 10 cells was assessed at 24 h of 10 μM MPA, 100 μM guanosine. Data are presented as mean±s.d. Average nucleolus sizes from 10 different cells in each group were indicated. The results were confirmed in two independent experiments. One-way ANOVA. Scale bar indicates 50 μm. e, IMPDH2 upregulation and glioma malignancy are positively correlated with nucleolar hypertrophy in glioma patients (left). Methyl green pyronin and IMPDH2 staining on human glioma tissue array. Upper right: major axis of nucleoli in human glioma tissue array (all grades of glioma) according to IMPDH2 expression levels (low: n=115, high: n=109 specimens). Lower right: major axis of nucleoli in grade I to IV glioma specimens according to IMPDH2 expression levels (Grade I, low: n=21, Grade II, low: n=61, high: n=16, Grade III, low: n=12, high: n=41, Grade IV, high: n=41 specimens). Data are presented as mean±s.e.m., Mann-Whitney test (two-sided) (upper right), one-way ANOVA (lower right). Scale bar indicates 50 μm. f, A schematic working model. Among four ribonucleotides, GTP biosynthesis from glucose is elevated in glioblastoma cells to fuel rRNA and tRNA via Pol I and Pol III transcription for their malignant growth. Less proliferative glial cells recycle ribonucleotides.

Similar articles

Cited by

References

References for the main text

    1. Pianese G, Teuscher R & Ziegler E Beitrag zur Histologie und Aetiologie des Carcinoms. (1896).
    1. Ruggero D Revisiting the nucleolus: from marker to dynamic integrator of cancer signaling. Science Signaling 5, pe38–pe38 (2012). - PMC - PubMed
    1. Hara A et al. Correlation between nucleolar organizer region staining and Ki-67 immunostaining in human gliomas. Surg Neurol 33, 320–324 (1990). - PubMed
    1. Busch H, Byvoet P & Smetana K The nucleolus of the cancer cell: a review. Cancer Research 23, 313–339 (1963). - PubMed
    1. Tsai RYL & Pederson T Connecting the nucleolus to the cell cycle and human disease. FASEB J. 28, 3290–3296 (2014). - PubMed

References for the Methods

    1. Sampetrean O et al. Invasion precedes tumor mass formation in a malignant brain tumor model of genetically modified neural stem cells. Neoplasia 13, 784–791 (2011). - PMC - PubMed
    1. Kwon C-H et al. Pten haploinsufficiency accelerates formation of high-grade astrocytomas. Cancer Research 68, 3286–3294 (2008). - PMC - PubMed
    1. Chow LML et al. Cooperativity within and among Pten, p53,and Rb Pathways Induces High-Grade Astrocytoma in Adult Brain. Cancer Cell 19, 305–316 (2011). - PMC - PubMed
    1. Steed TC et al. Differential localization of glioblastoma subtype: implications on glioblastoma pathogenesis. Oncotarget 7, 24899–24907 (2016). - PMC - PubMed
    1. Ozawa T et al. Most human non-GCIMP glioblastoma subtypes evolve from a common proneural-like precursor glioma. Cancer Cell 26, 288–300 (2014). - PMC - PubMed

Publication types

MeSH terms