

doi: 10.2337/cd18-0082.
Implementation of A1C Point-of-Care Testing: Serving Under-Resourced Adults With Type 2 Diabetes in a Public Health Department
Affiliations
- PMID: 31371855
- PMCID: PMC6640883
- DOI: 10.2337/cd18-0082
Item in Clipboard
Implementation of A1C Point-of-Care Testing: Serving Under-Resourced Adults With Type 2 Diabetes in a Public Health Department
Clin Diabetes.
2019 Jul.
Abstract
IN BRIEF A1C point-of-care testing (POCT) paired with face-to-face education potentially improves glycemic control in under-resourced populations. In this study, A1C POCT was implemented with same-day face-to-face medication management and education for adults with type 2 diabetes in a public health department in southeastern North Carolina. The combination of POCT, medication management, and education provided together improved glycemic control and decreased clinical inertia in a setting in which access to health care is limited.
Figures
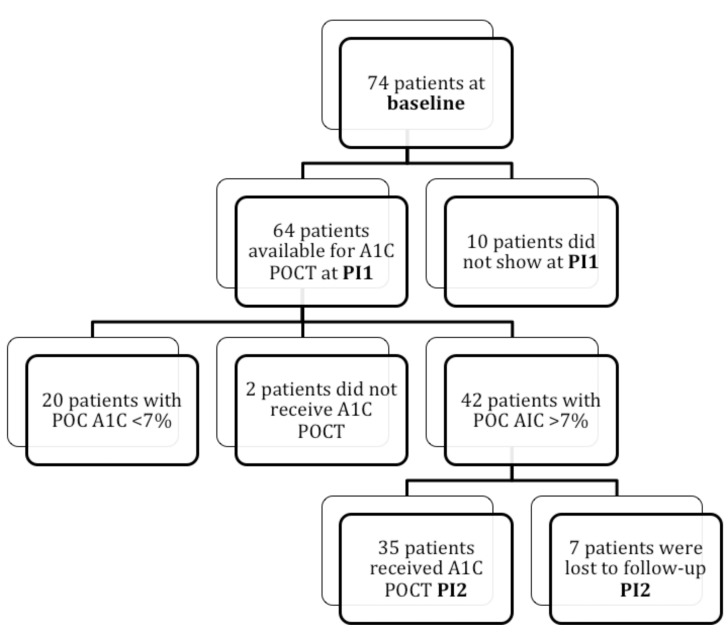
Progression of conveniently sampled participants from baseline through PI1 and final sample (PI2) that progressed through all time points.
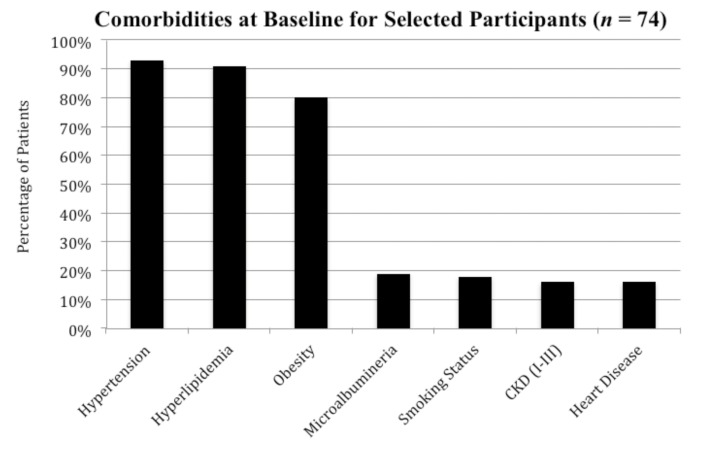
Percentage of participants with hypertension, hyperlipidemia, obesity, microalbuminuria, nicotine dependence, chronic kidney disease, and/or heart disease for patients with an A1C >7% and a diagnosis of type 2 diabetes at baseline. CKD I-III, chronic kidney disease stages 1–3; smoking status, current smoker.
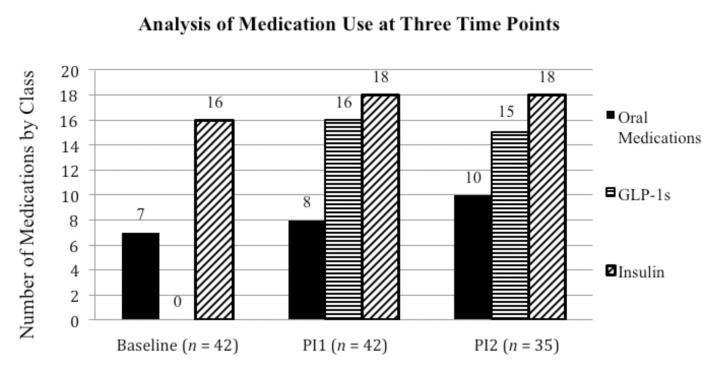
Classes of medications used (started/increased) by patients who received A1C POCT and had an A1C >7% at all time points. GLP-1s, GLP-1 receptor agonists.
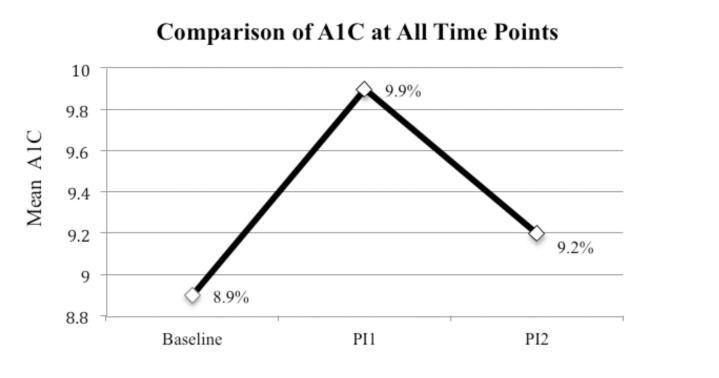
A one-way repeated ANOVA was used to compare the mean A1C for all patients with an A1C >7% before implementation of A1C POCT (baseline), at the initial A1C POCT (PI1), and at the 3-month follow-up A1C POCT (PI2). A significant increase in A1C was seen from baseline to PI1 (P = 0.008), and a significant decrease in A1C was seen from PI1 to PI2 (P = 0.008).
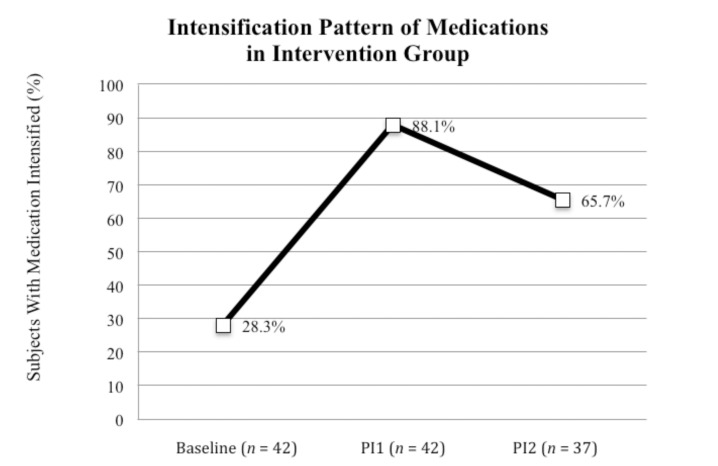
χ2 Test used to analyze pattern of medication intensification for the implementation group at baseline, PI1, and PI2. Significant increases in medication intensification were found from baseline to PI1 and from baseline to PI2, P = 0.008 and P <0.001, respectively.
Similar articles
-
Assessment of Patient Satisfaction with On-Site Point-of-Care Hemoglobin A1c Testing: An Observational Study.Diabetes Ther. 2021 Sep;12(9):2531-2544. doi: 10.1007/s13300-021-01126-7. Epub 2021 Aug 7. Diabetes Ther. 2021. PMID: 34363602 Free PMC article.
-
Evaluation of a training program for device operators in the Australian Government's Point of Care Testing in General Practice Trial: issues and implications for rural and remote practices.Rural Remote Health. 2009 Jul-Sep;9(3):1189. Epub 2009 Aug 10. Rural Remote Health. 2009. PMID: 19689171 Clinical Trial.
-
Implementation of point-of-care testing in a pediatric healthcare setting.Crit Rev Clin Lab Sci. 2019 Jun;56(4):239-246. doi: 10.1080/10408363.2019.1590306. Epub 2019 Apr 11. Crit Rev Clin Lab Sci. 2019. PMID: 30973797 Review.
-
Point-of-care testing in diabetes care.Mini Rev Med Chem. 2011 Feb;11(2):178-84. doi: 10.2174/138955711794519474. Mini Rev Med Chem. 2011. PMID: 21222582
-
Clinical inertia, reverse clinical inertia, and medication non-adherence in type 2 diabetes.J Endocrinol Invest. 2019 May;42(5):495-503. doi: 10.1007/s40618-018-0951-8. Epub 2018 Oct 6. J Endocrinol Invest. 2019. PMID: 30291589 Review.
Cited by
-
Physician related barriers towards insulin therapy at primary care centres in Trinidad: a cross-sectional study.BMC Fam Pract. 2020 Sep 21;21(1):197. doi: 10.1186/s12875-020-01271-1. BMC Fam Pract. 2020. PMID: 32957991 Free PMC article.
-
Comparison of Point-of-Care and Laboratory Glycated Hemoglobin A1c and Its Relationship to Time-in-Range and Glucose Variability: A Real-World Study.Cureus. 2023 Jan 5;15(1):e33416. doi: 10.7759/cureus.33416. eCollection 2023 Jan. Cureus. 2023. PMID: 36643084 Free PMC article.
-
Clinical Need for Point-of-Care Testing for Diabetes in Clinical and Laboratory Improvement Amendments-Waived Settings.Clin Diabetes. 2024 Oct 30;43(2):227-239. doi: 10.2337/cd24-0071. eCollection 2025 Spring. Clin Diabetes. 2024. PMID: 40290824 Free PMC article.
-
Observational assessment of the utilization of donated point of care tests and glycemic control at free and charitable clinics across the United States.Pract Lab Med. 2025 Jan 10;44:e00450. doi: 10.1016/j.plabm.2025.e00450. eCollection 2025 Apr. Pract Lab Med. 2025. PMID: 39897629 Free PMC article.
-
Intensifying approaches to address clinical inertia among cardiovascular disease risk factors: A narrative review.Patient Educ Couns. 2022 Dec;105(12):3381-3388. doi: 10.1016/j.pec.2022.08.005. Epub 2022 Aug 18. Patient Educ Couns. 2022. PMID: 36002348 Free PMC article. Review.
References
-
- Centers for Disease Control and Prevention National Diabetes Statistics Report, 2017. Available from www.diabetes.org/assets/pdfs/basics/cdc-statistics-report-2017.pdf. Accessed 7 May 2017
-
- Marmot M. Addressing social determinants of health in primary care. American Academy of Family Physicians; 2018. Available from www.aafp.org/dam/AAFP/documents/patient_care/everyone_project/team-based.... Accessed 7 April 2018
-
- Centers for Disease Control and Prevention Diagnosed diabetes, age-adjusted percentage, adults with diabetes, total, 2015. Available from gis.cdc.gov/grasp/diabetes/DiabetesAtlas.html. Accessed 5 December 2016
-
- North Carolina Diabetes Advisory Council. Type 2 Diabetes in North Carolina factsheet. 2018. Available from www.diabetesnc.com/downloads/0518/DAC_FactSheet_Diabetes_May2018.pdf. Accessed 10 June 2018
