

The mSHOX2 is capable of assessing the therapeutic effect and predicting the prognosis of stage IV lung cancer
- PMID: 31372283
- PMCID: PMC6626805
- DOI: 10.21037/jtd.2019.05.81
The mSHOX2 is capable of assessing the therapeutic effect and predicting the prognosis of stage IV lung cancer
Abstract
Background: Instant monitoring of the therapeutic effect of systematic therapy in late-stage lung cancer is crucial for response assessment and strategy adjustment. Previous study found that specific plasma methylation markers may be applied to therapeutic effect assessment. In order to investigate the performance of plasma mSHOX2 in assessing the therapeutic effect and predicting the prognosis of stage IV lung cancer, we performed the study focusing on patients underwent chemotherapy or tyrosine kinase inhibitor (TKI)-based targeted therapy.
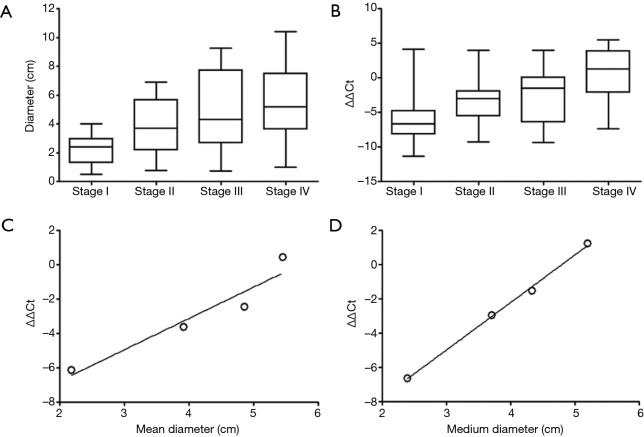
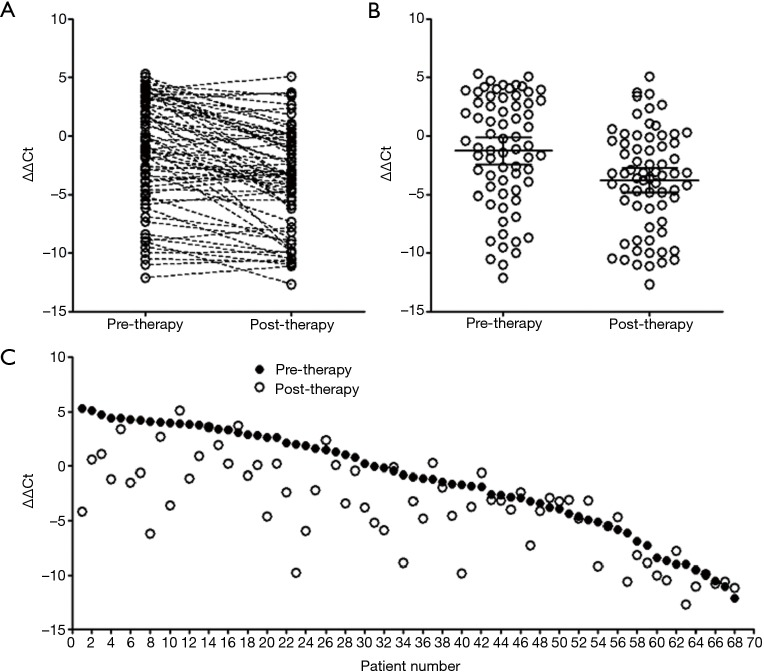
Methods: Blood samples from 163 subjects, including 30 stage I, 29 stage II, 26 stage III and 68 stage IV lung cancer patients, were recruited in this study. Quantitative relationship between primary tumor size and the plasma mSHOX2 level was established. Blood samples before therapy and two cycles after therapy were obtained from 68 stage IV patients, and the mSHOX2 level was quantified as ΔΔCt.
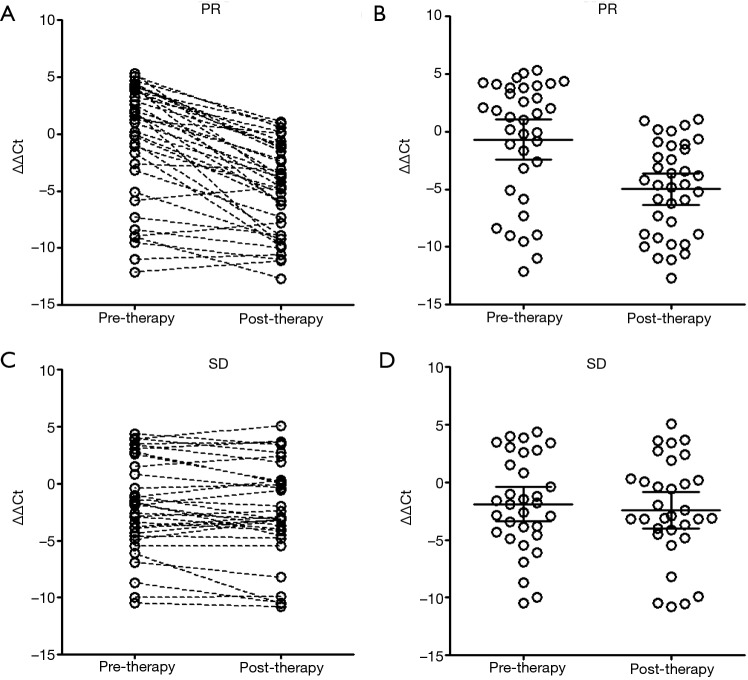
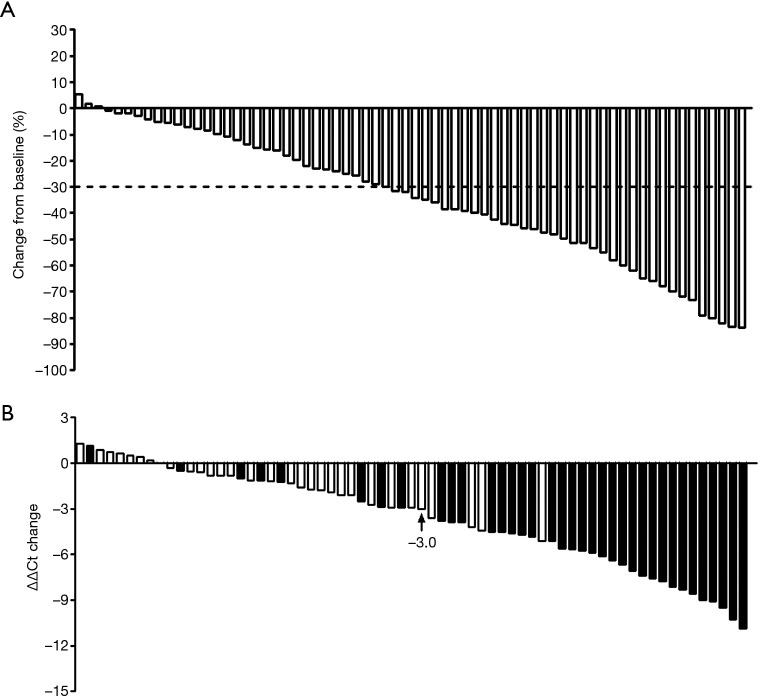
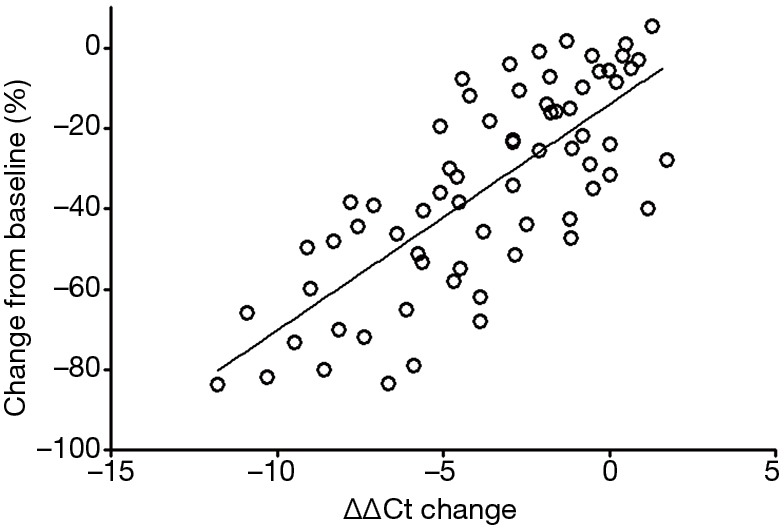
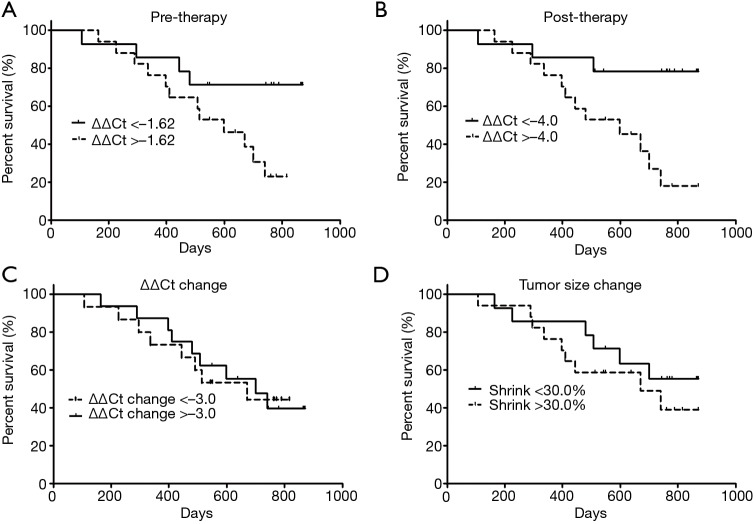
Results: Sharp decrease of plasma mSHOX2 level was seen in patients with partial response (PR) while not in those with stable disease (SD). The plasma mSHOX2 level change reflected the degree of response and correlated with the maximal diameter of primary tumors in linear relationship. The mSHOX2 levels before and two cycles after therapy were predictors of the overall survival, while the mSHOX2 level change or the tumor size change were not predictors of the overall survival. Furthermore, univariable and multivariable Cox regression revealed that mSHOX2 level before therapy was the only independent predictor of the overall survival with a hazard ratio of 1.414.
Conclusions: mSHOX2 is effective for therapeutic effect assessment and prognosis prediction of stage IV lung cancer patients underwent systematic therapy.
Keywords: SHOX2; circulating tumor DNA (ctDNA); lung cancer; mSHOX2; methylation; prognosis; therapy.
Conflict of interest statement
Conflicts of Interest: L Song was previously an employee of BioChain (Beijing) Science and Technology, Inc. BioChain is a collaborator of Epigenomics AG, a Germany-based company that launched the first commercial mSHOX2 assay. The other authors have no conflicts of interest to declare.
Figures
Similar articles
-
Quantification of cell-free mSHOX2 Plasma DNA for therapy monitoring in advanced stage non-small cell (NSCLC) and small-cell lung cancer (SCLC) patients.PLoS One. 2015 Feb 12;10(2):e0118195. doi: 10.1371/journal.pone.0118195. eCollection 2015. PLoS One. 2015. PMID: 25675432 Free PMC article.
-
SHOX2 methylation in Vietnamese patients with lung cancer.Mol Biol Rep. 2022 May;49(5):3413-3421. doi: 10.1007/s11033-022-07172-z. Epub 2022 Jan 27. Mol Biol Rep. 2022. PMID: 35088378
-
The performance of the SHOX2/PTGER4 methylation assay is influenced by cancer stage, age, type and differentiation.Biomark Med. 2020 Apr;14(5):341-351. doi: 10.2217/bmm-2019-0325. Epub 2020 Apr 6. Biomark Med. 2020. PMID: 32250153
-
Hypermethylated SHOX2 in circulating cell-free DNA post renal cell carcinoma surgery as TNM-independent biomarker for recurrence risk.Am J Transl Res. 2024 Jan 15;16(1):304-313. doi: 10.62347/QOBT7285. eCollection 2024. Am J Transl Res. 2024. PMID: 38322559 Free PMC article.
-
Cell-Free Methylated PTGER4 and SHOX2 Plasma DNA as a Biomarker for Therapy Monitoring and Prognosis in Advanced Stage NSCLC Patients.Diagnostics (Basel). 2023 Jun 21;13(13):2131. doi: 10.3390/diagnostics13132131. Diagnostics (Basel). 2023. PMID: 37443525 Free PMC article.
Cited by
-
Plasma levels of methylated septin 9 are capable of detecting hepatocellular carcinoma and hepatic cirrhosis.Mol Med Rep. 2020 Oct;22(4):2705-2714. doi: 10.3892/mmr.2020.11356. Epub 2020 Jul 23. Mol Med Rep. 2020. PMID: 32945374 Free PMC article.
-
Plasma cell-free DNA methylation combined with tumor mutation detection in prognostic prediction of patients with non-small cell lung cancer (NSCLC).Medicine (Baltimore). 2020 Jun 26;99(26):e20431. doi: 10.1097/MD.0000000000020431. Medicine (Baltimore). 2020. PMID: 32590728 Free PMC article.
-
DNA Methylation Analysis of the SHOX2 and RASSF1A Panel Using Cell-Free DNA in the Diagnosis of Malignant Pleural Effusion.J Oncol. 2023 Jan 14;2023:5888844. doi: 10.1155/2023/5888844. eCollection 2023. J Oncol. 2023. PMID: 36691467 Free PMC article.
-
DNA Methylation-Based Testing in Liquid Biopsies as Detection and Prognostic Biomarkers for the Four Major Cancer Types.Cells. 2020 Mar 5;9(3):624. doi: 10.3390/cells9030624. Cells. 2020. PMID: 32150897 Free PMC article. Review.
-
The prognostic impact of circulating homeobox A9 methylated DNA in advanced non-small cell lung cancer.Transl Lung Cancer Res. 2021 Feb;10(2):855-865. doi: 10.21037/tlcr-20-826. Transl Lung Cancer Res. 2021. PMID: 33718027 Free PMC article.
References
-
- Dietrich D, Kneip C, Raji O, et al. Performance evaluation of the DNA methylation biomarker SHOX2 for the aid in diagnosis of lung cancer based on the analysis of bronchial aspirates. Int J Oncol 2012;40:825-32. - PubMed
LinkOut - more resources
Full Text Sources
Research Materials