Review
. 2020 Jan;7(1):011402.
doi: 10.1117/1.NPh.7.1.011402. Epub 2019 Jul 30.

Interpreting in vivo calcium signals from neuronal cell bodies, axons, and dendrites: a review

Affiliations
Review

Interpreting in vivo calcium signals from neuronal cell bodies, axons, and dendrites: a review

Farhan Ali et al. Neurophotonics. 2020 Jan.

Abstract

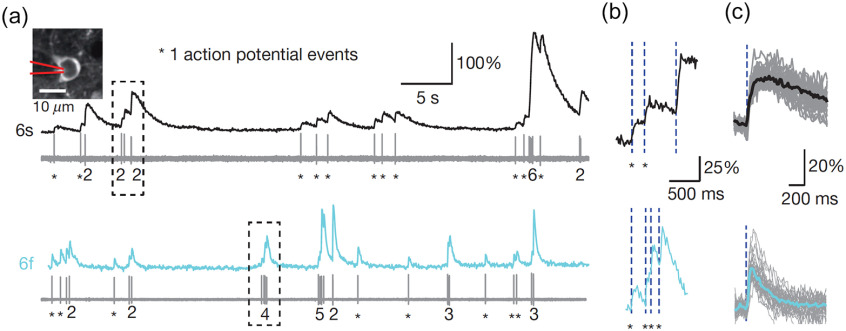
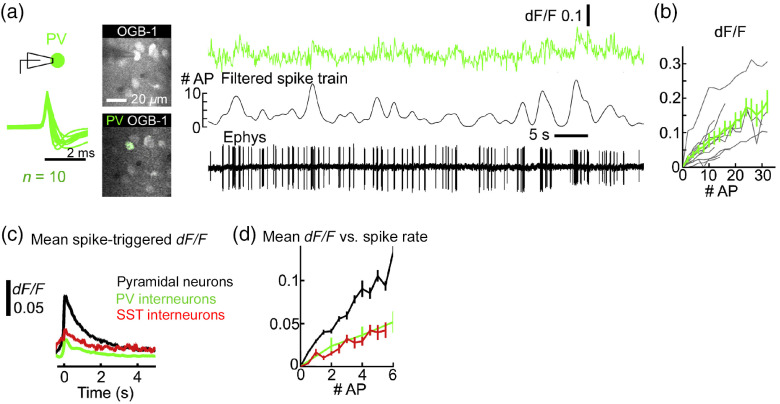
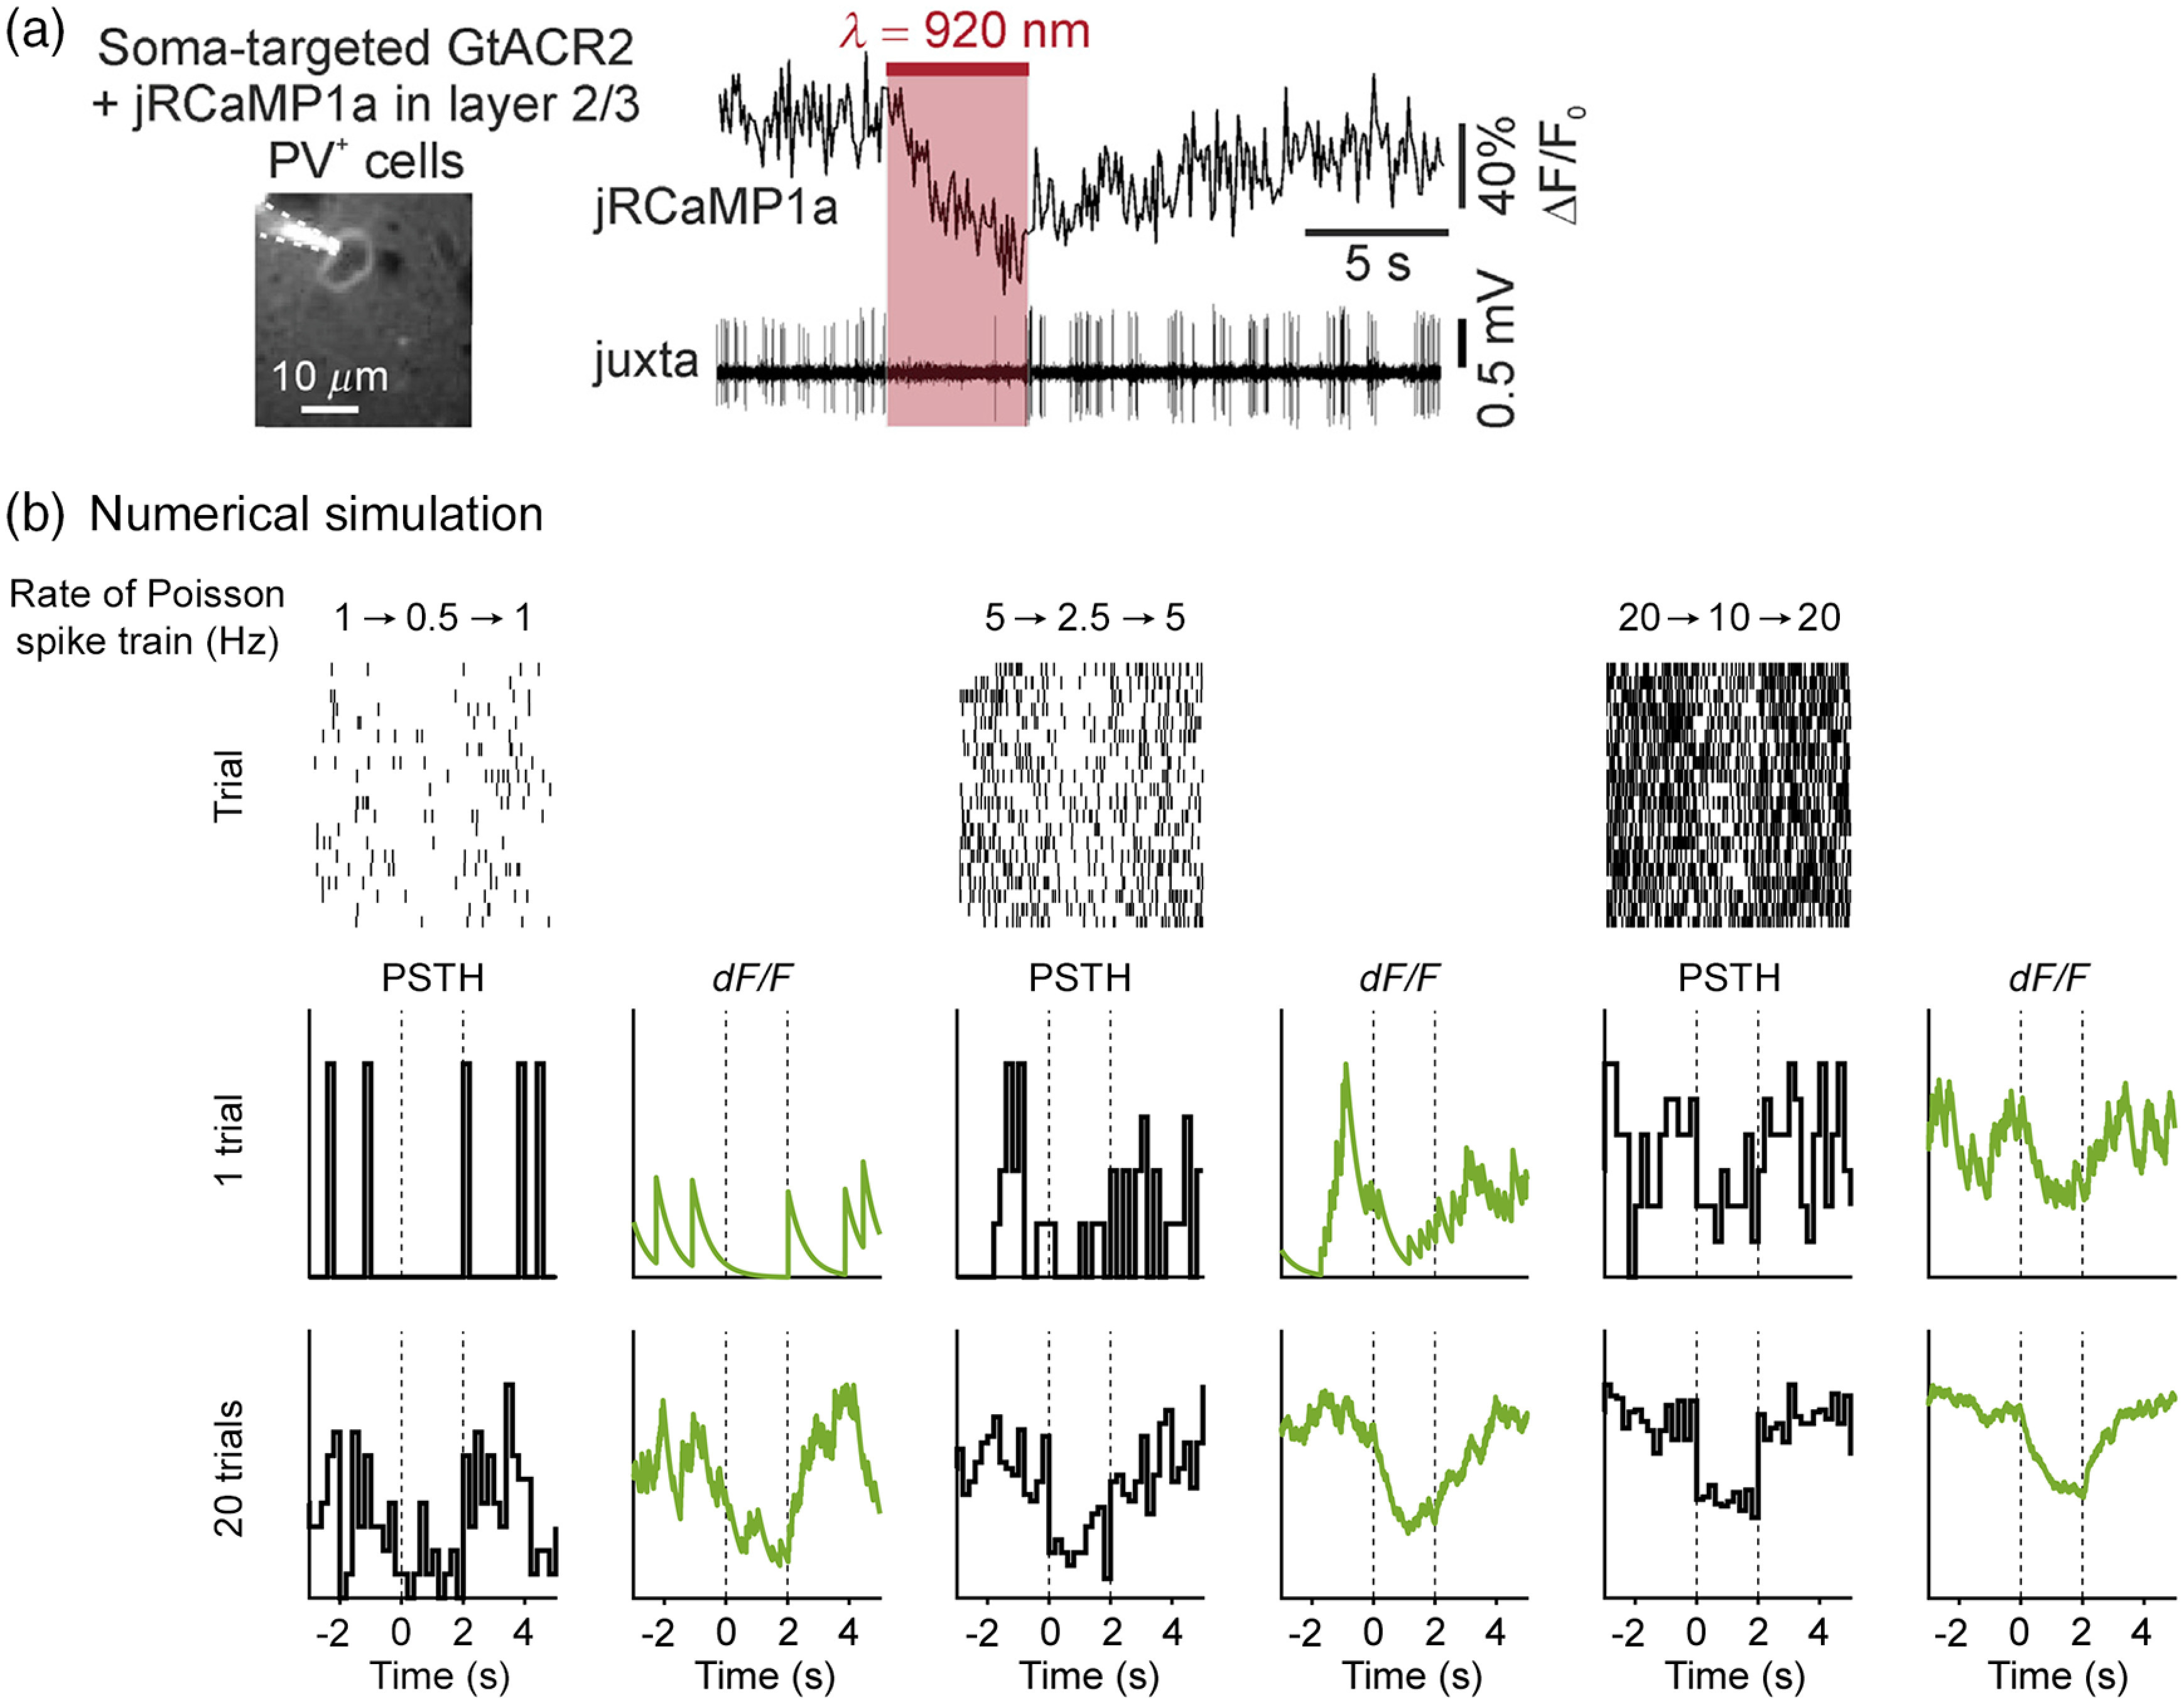
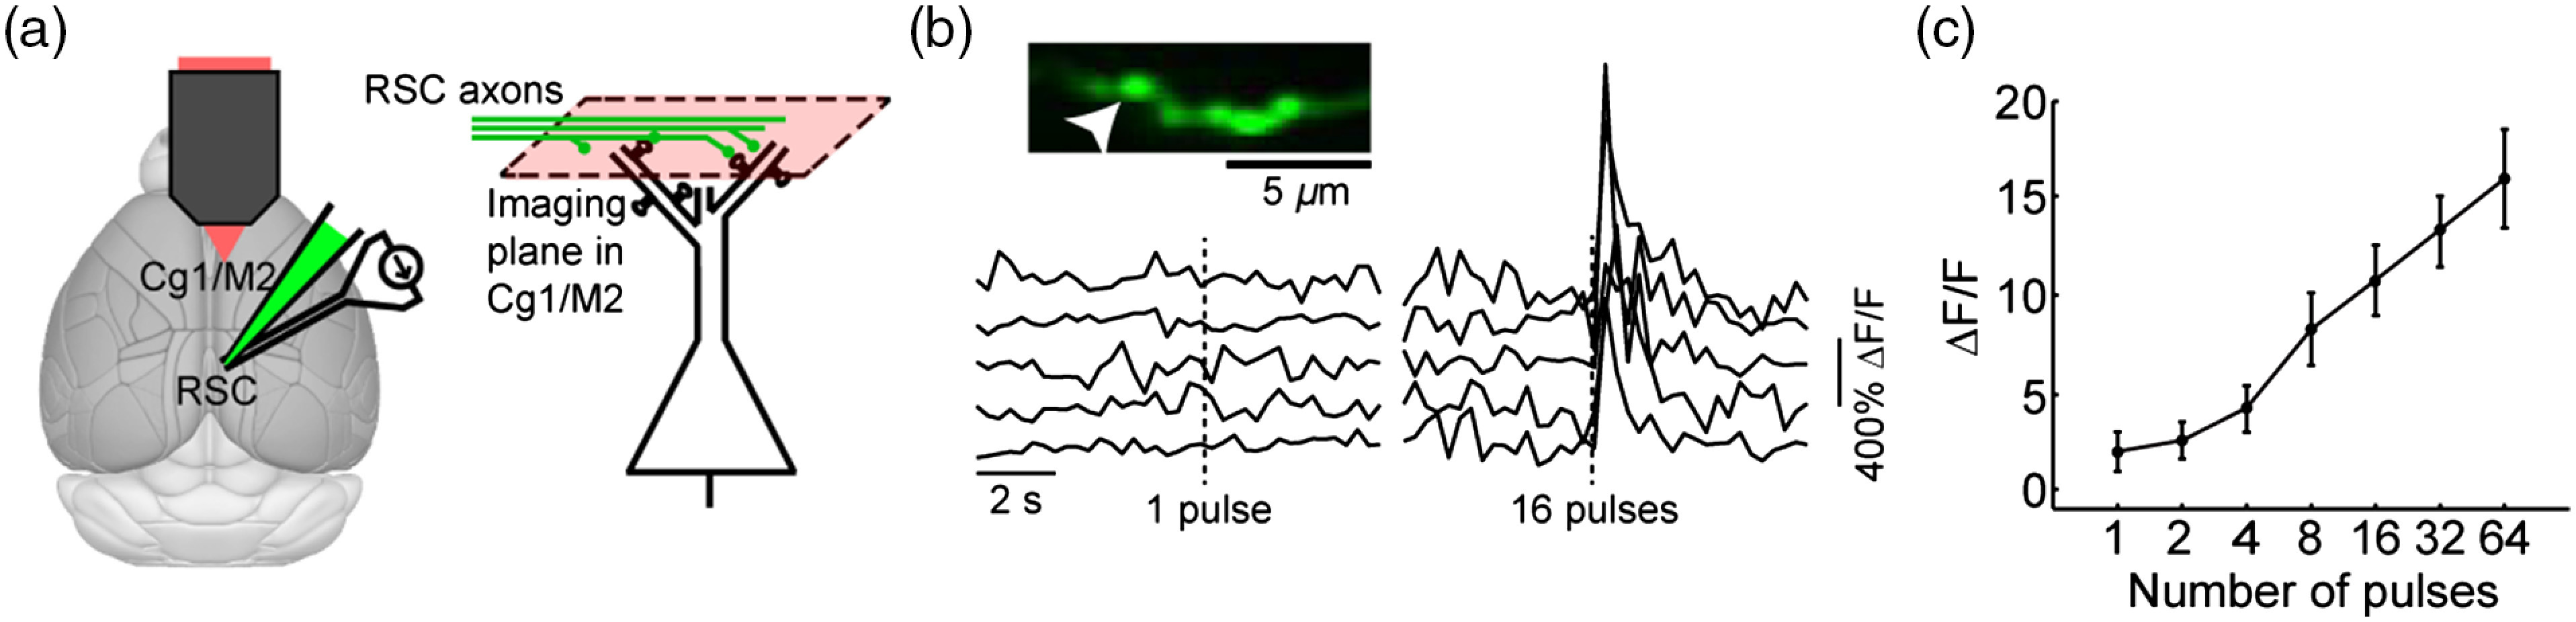
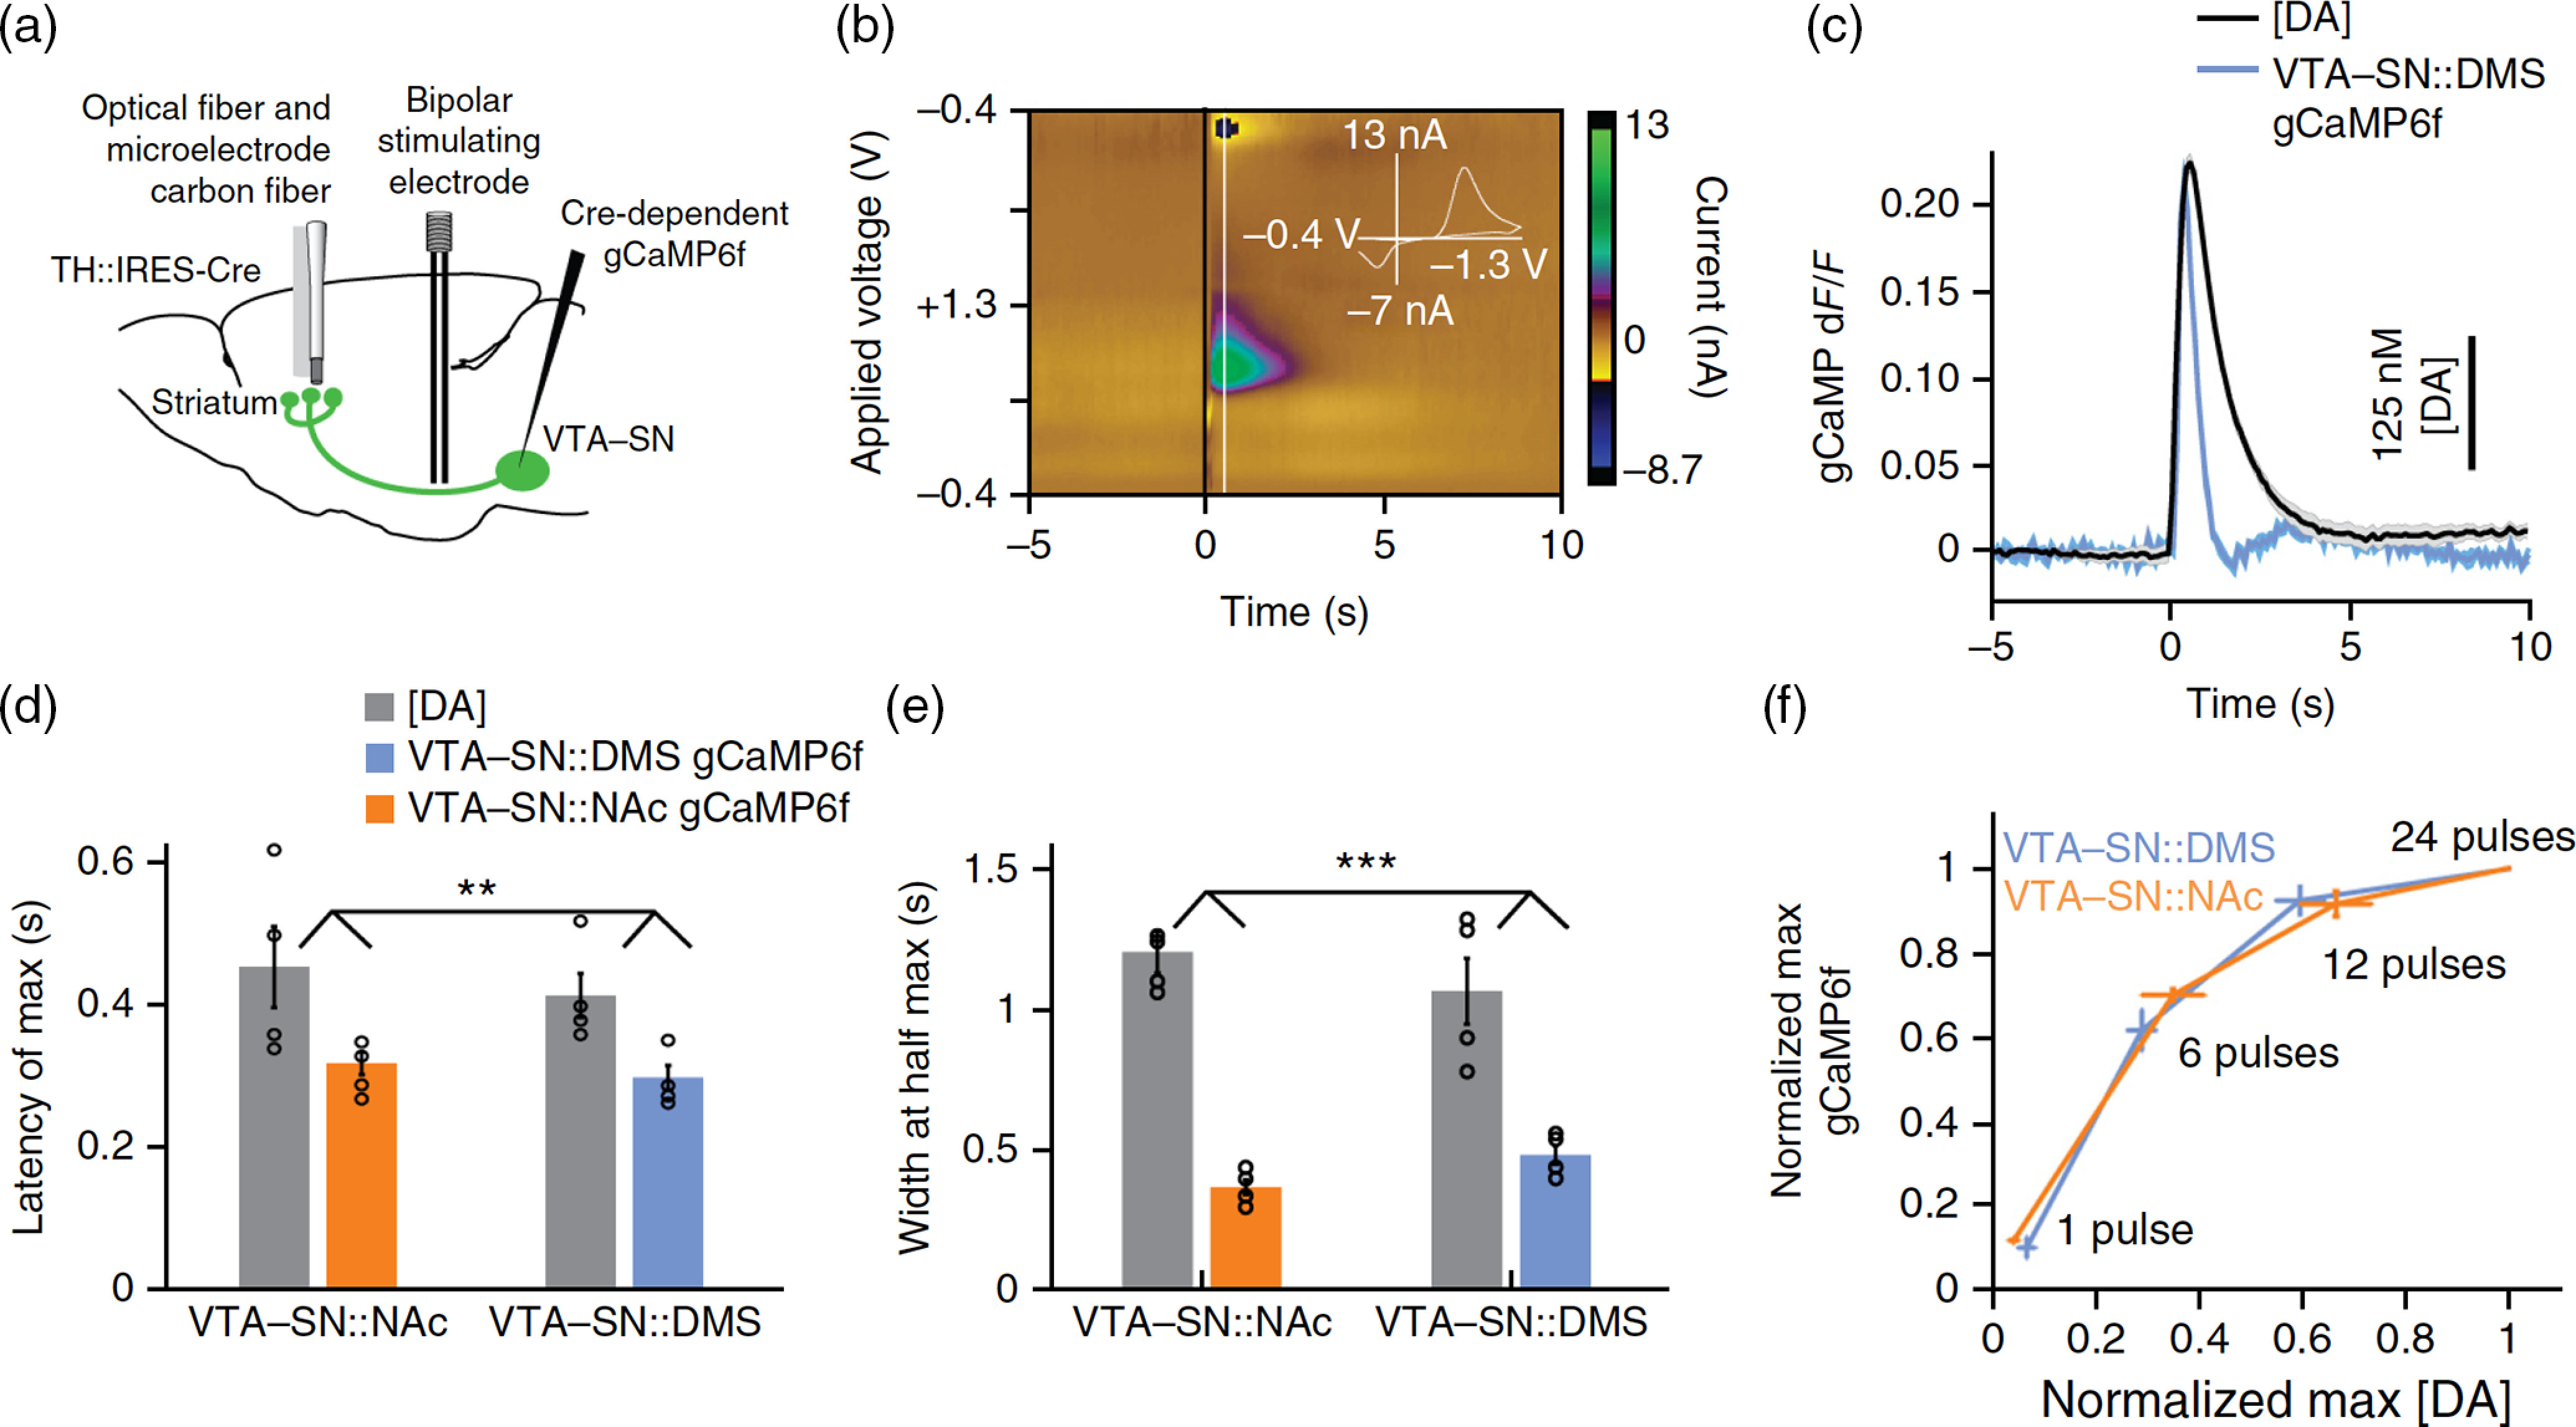
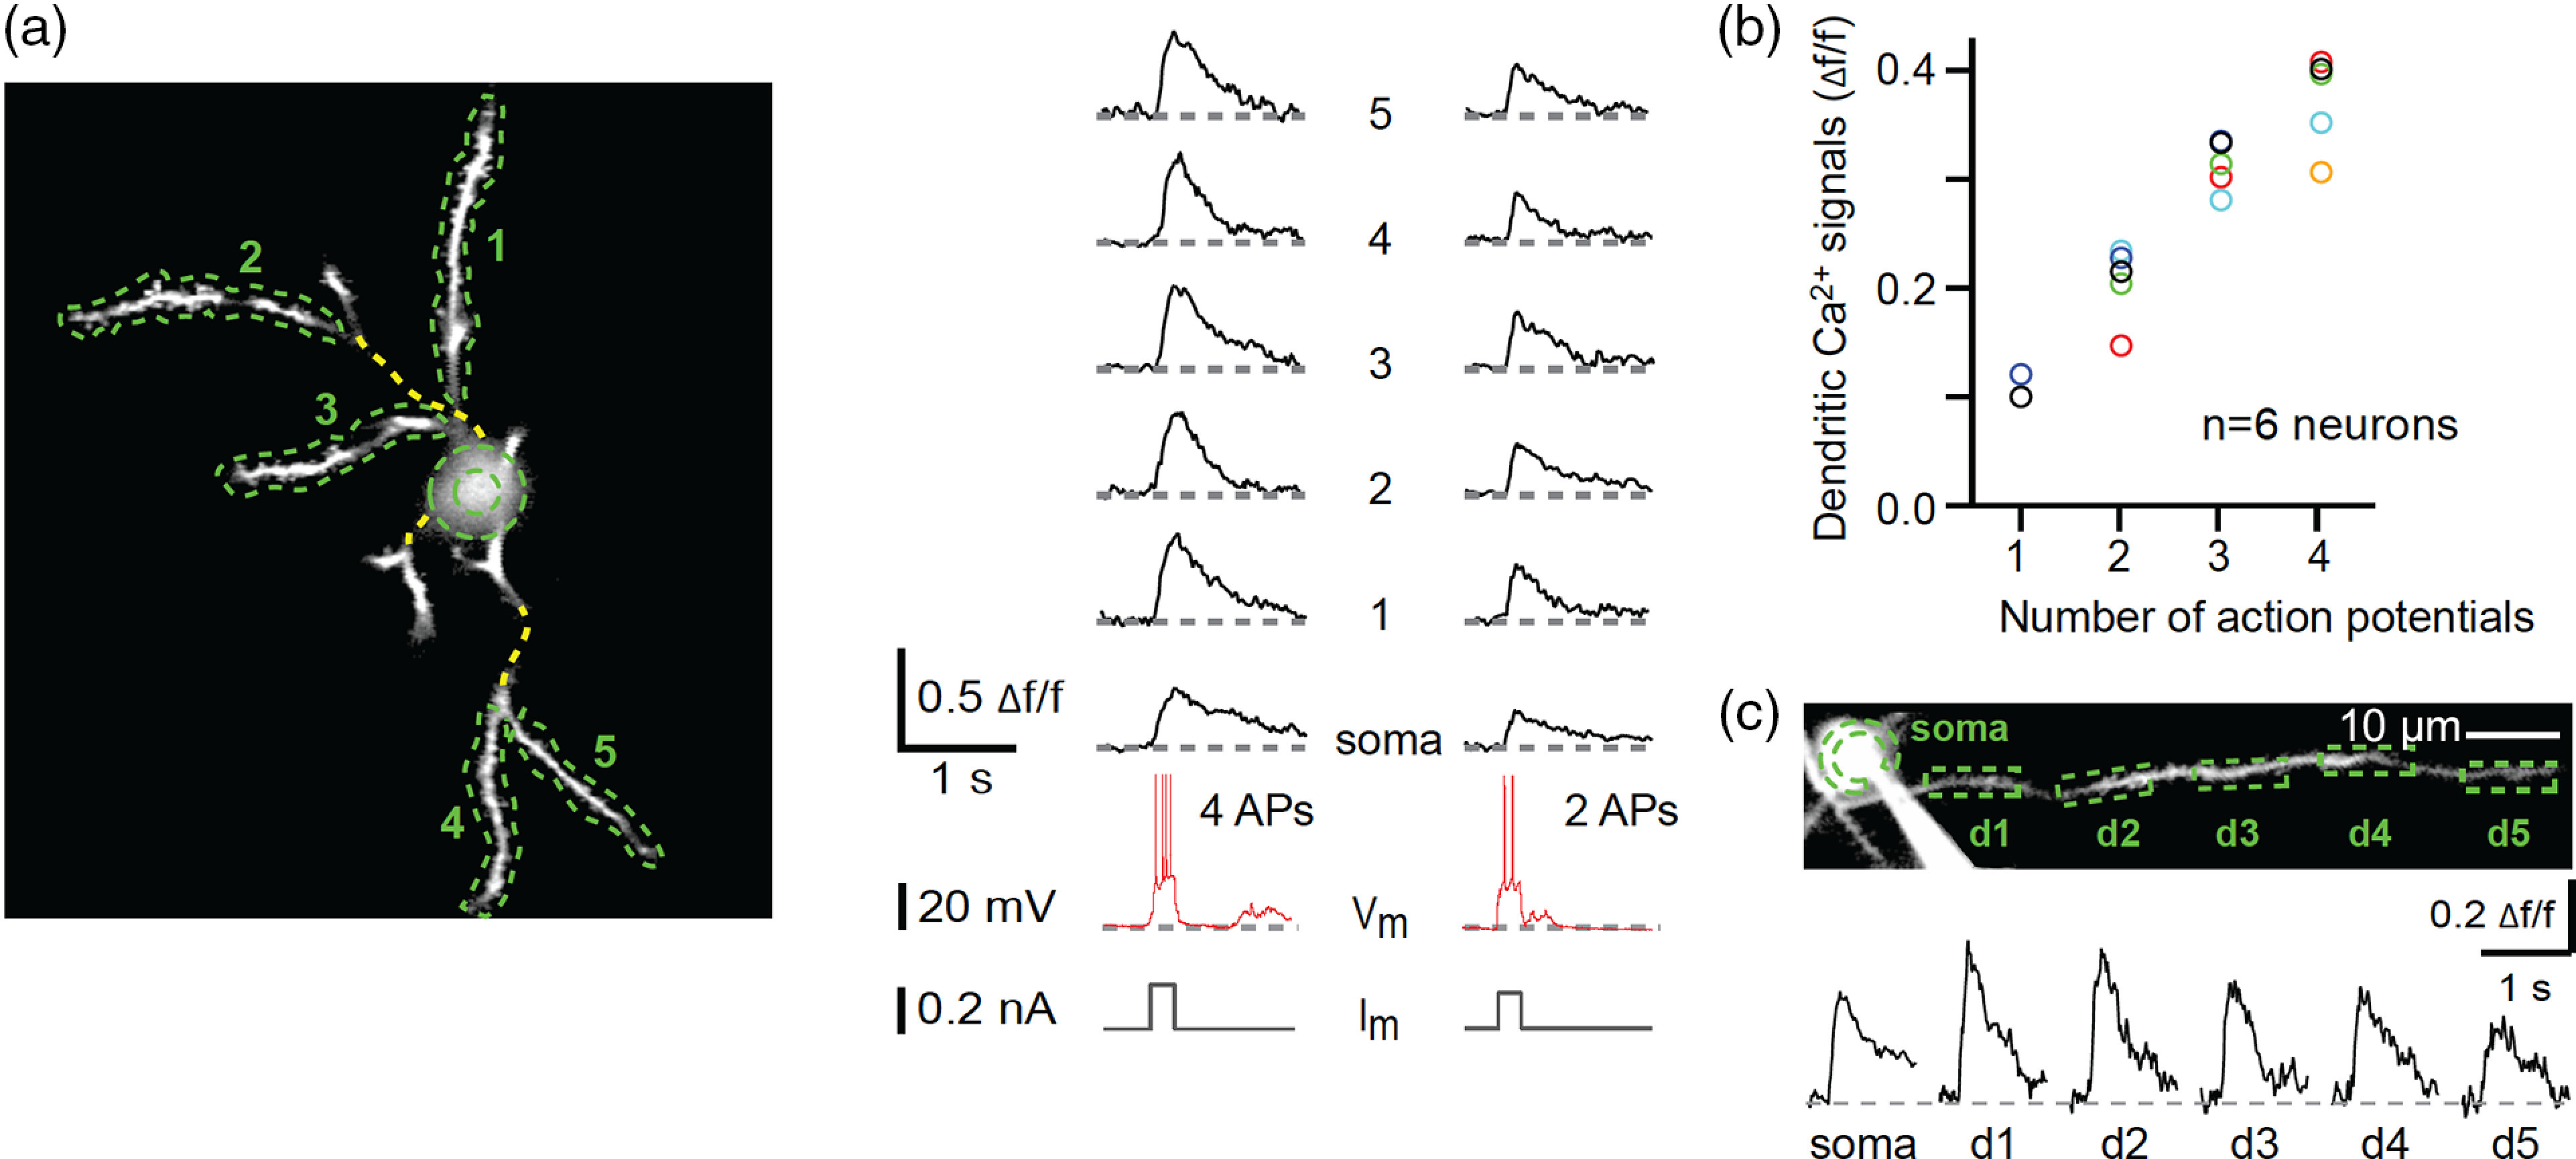
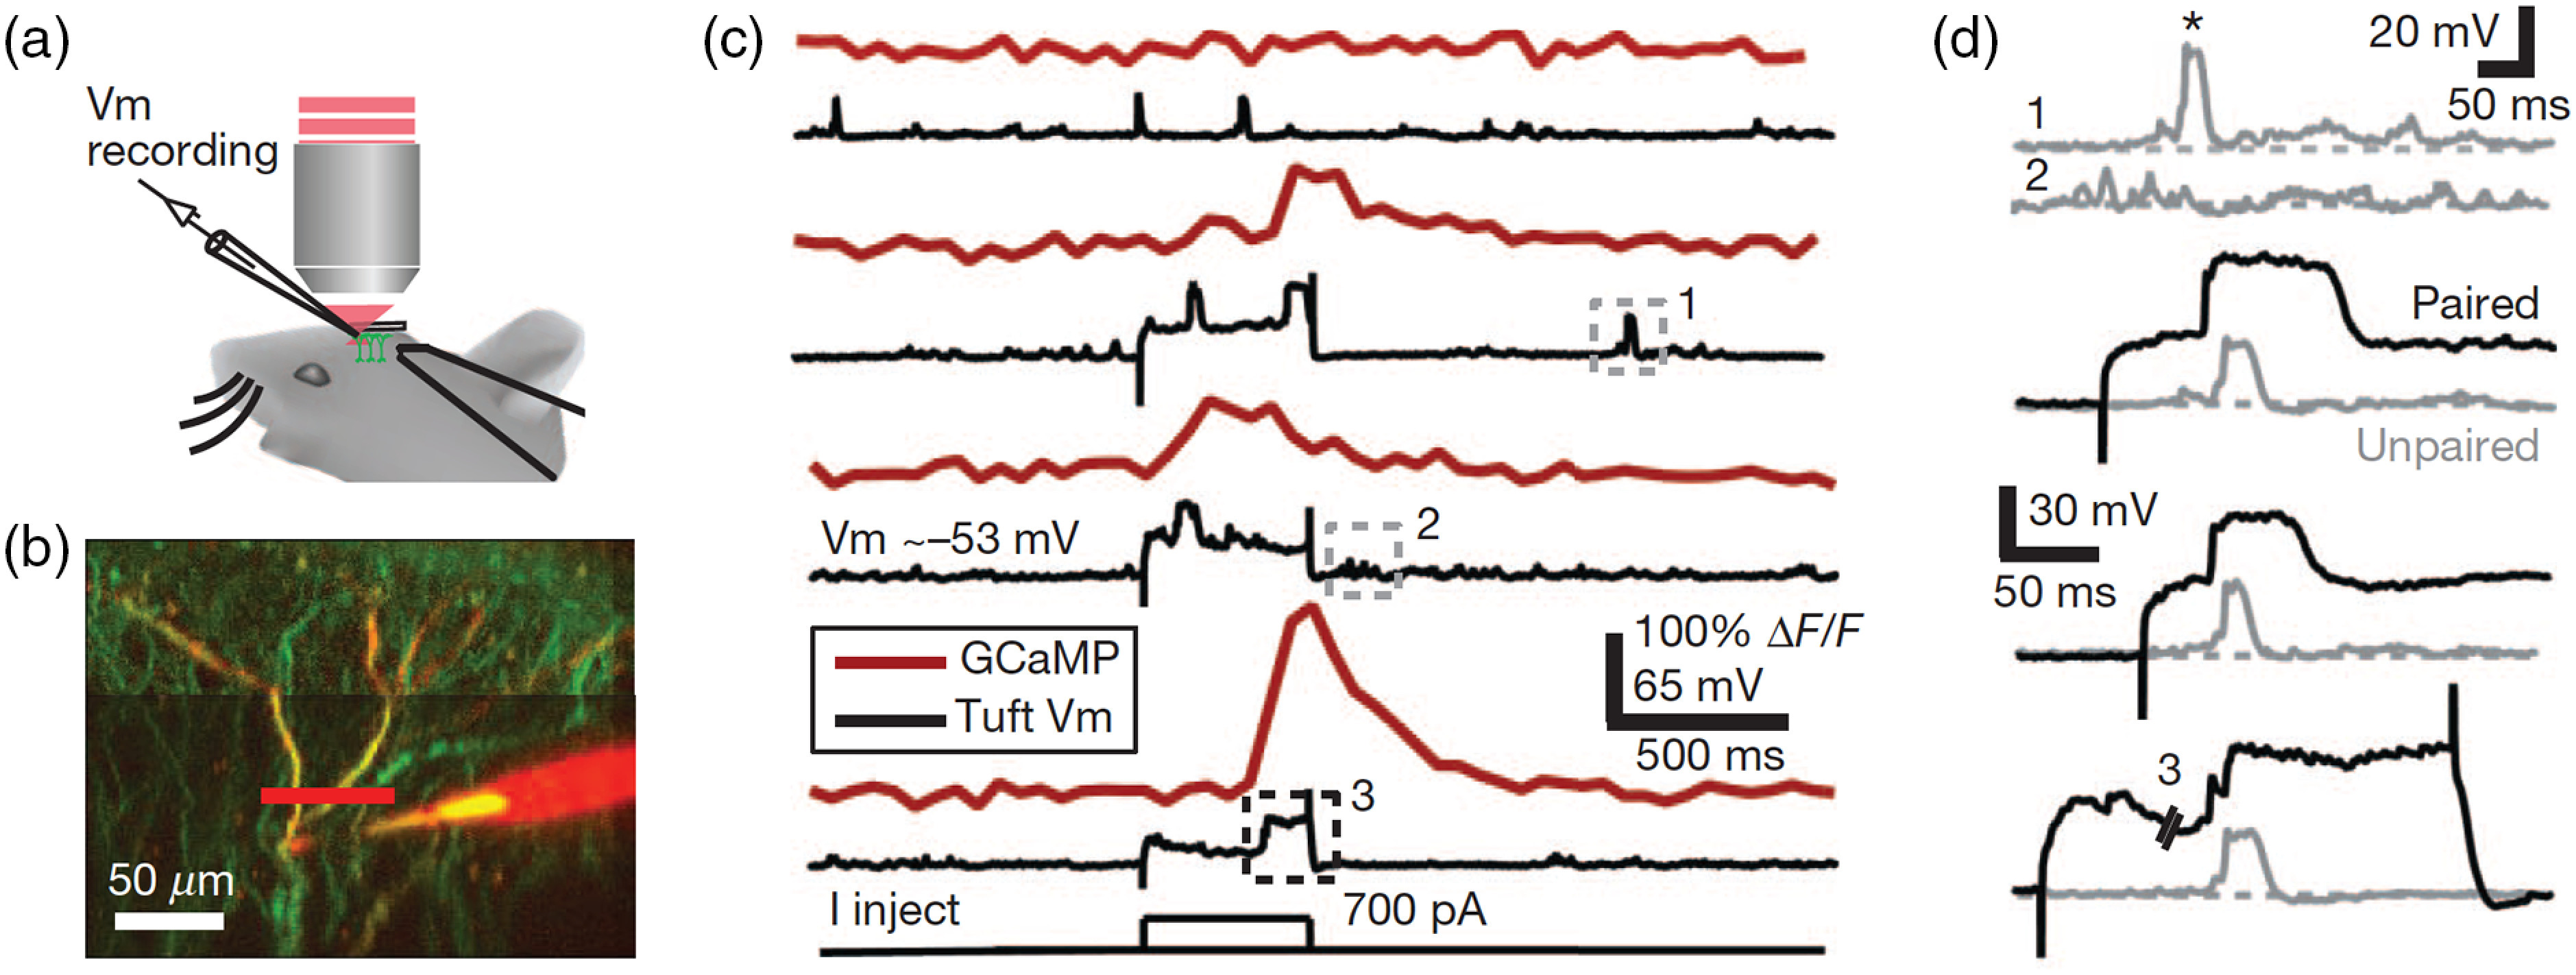
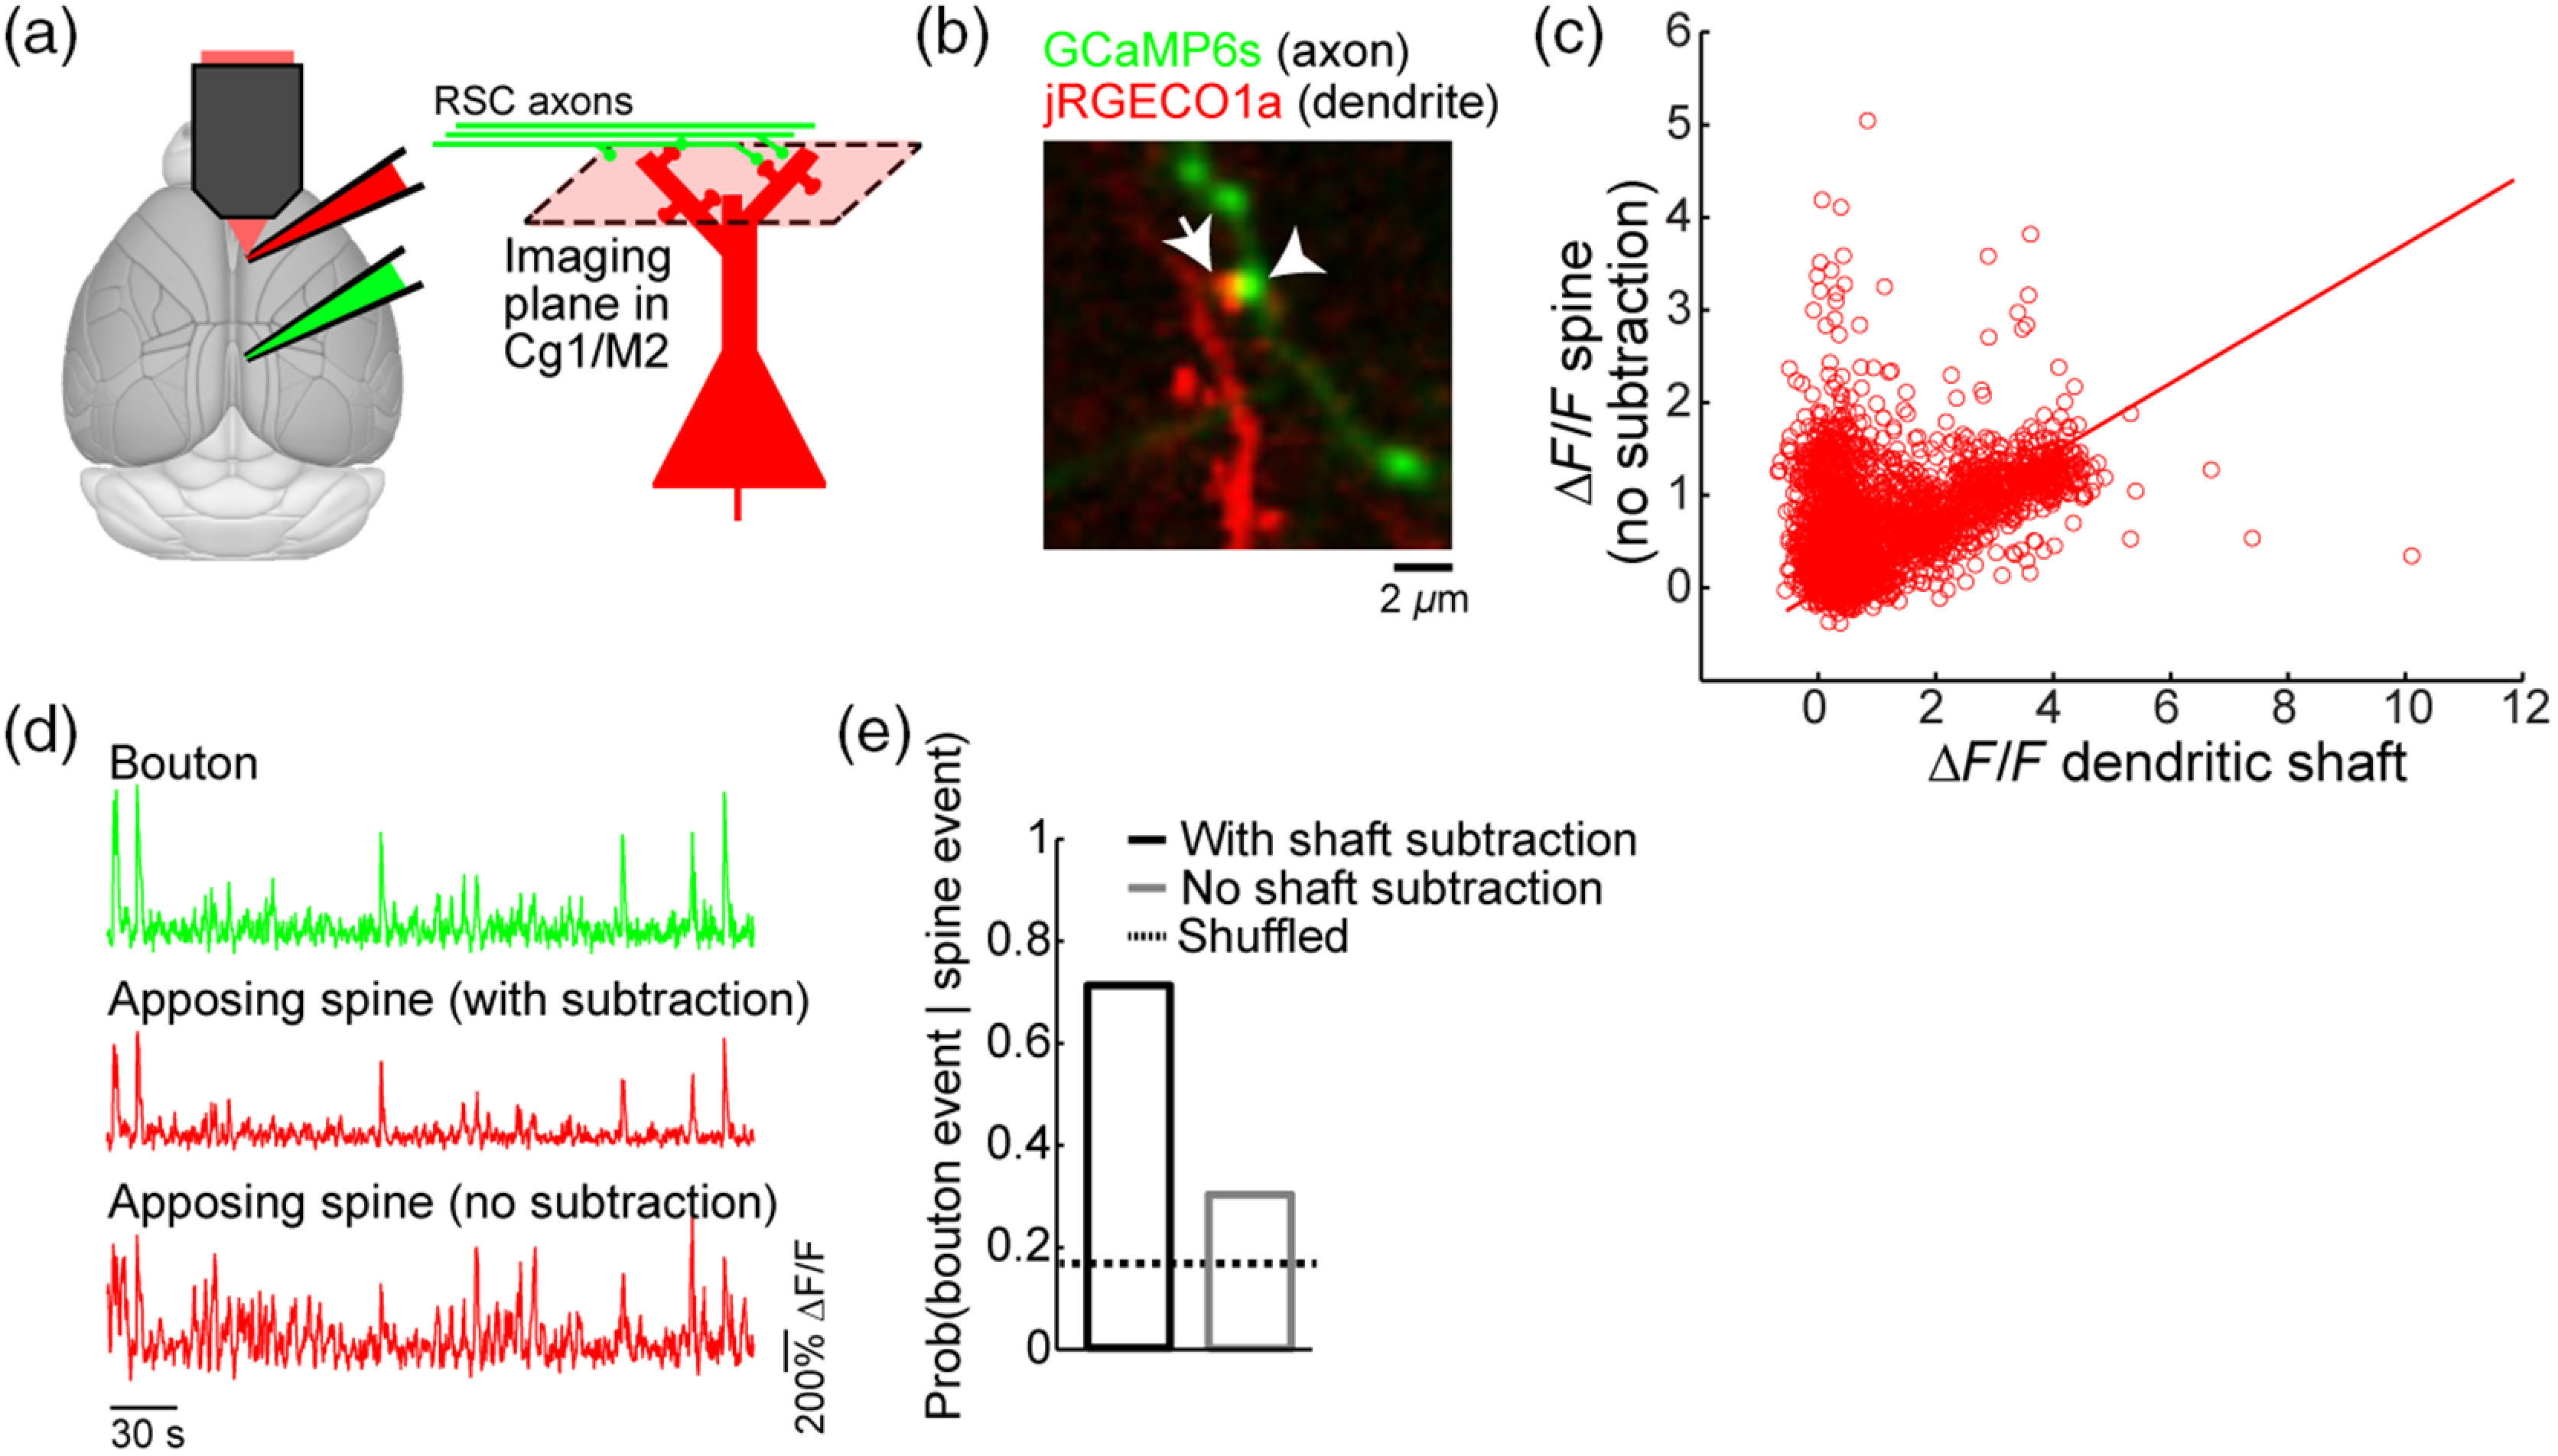
Calcium imaging is emerging as a popular technique in neuroscience. A major reason is that intracellular calcium transients are reflections of electrical events in neurons. For example, calcium influx in the soma and axonal boutons accompanies spiking activity, whereas elevations in dendrites and dendritic spines are associated with synaptic inputs and local regenerative events. However, calcium transients have complex spatiotemporal dynamics, and since most optical methods visualize only one of the somatic, axonal, and dendritic compartments, a straightforward inference of the underlying electrical event is typically challenging. We highlight experiments that have directly calibrated in vivo calcium signals recorded using fluorescent indicators against electrophysiological events. We address commonly asked questions such as: Can calcium imaging be used to characterize neurons with high firing rates? Can the fluorescent signal report a decrease in spiking activity? What is the evidence that calcium transients in subcellular compartments correspond to distinct presynaptic axonal and postsynaptic dendritic events? By reviewing the empirical evidence and limitations, we suggest that, despite some caveats, calcium imaging is a versatile method to characterize a variety of neuronal events in vivo.

Keywords: calcium imaging; calibration; fluorescence; neuron; two-photon microscopy.


Figures

Fig. 1
Fig. 1
Somatic calcium transients reflect spiking activity of cortical neurons. (a) Somatic calcium transients from a GCaMP6s- (top row) or GCaMP6f-expressing neuron (bottom row) in layer 2/3 of the mouse visual cortex, imaged using a two-photon microscope. Spiking activity was recorded from the imaged neurons using a juxtacellular electrode. The numbers denote the number of action potentials. An asterisk denotes a single spike. (b) Magnified view of the boxes in (a). (c) Median fluorescence transient in response to single action potential events with nearby spikes at least 1 s away. Figure adapted from Ref. . Reproduced with permission, courtesy of Springer Nature.
Fig. 2
Fig. 2
Somatic calcium transients correlate with firing rates of cortical GABAergic neurons. (a) Somatic calcium transients from a parvalbumin-expressing (PV) interneuron in layer 2/3 of the mouse visual cortex, imaged using a two-photon microscope. Cell type was identified based on tdTomato expression. Neurons were loaded with the synthetic calcium dye Oregon Green BAPTA-1 (OGB-1). Spiking activity was recorded under cell-attached condition. The left panel shows the mean normalized spike waveforms of 10 cells. The middle panel shows images including a recorded neuron. The right panel shows fluorescence and electrophysiological traces from an example cell. The filtered spike train was smoothed with a Gaussian filter (s.d. = 0.5 s). (b) Fluorescence versus number of action potentials was determined using the filtered spike train. Gray lines, individual cells. Black line, mean ± s.e.m. (c) Mean spike-triggered fluorescence for excitatory (n=16), PV (n=10), and SST neurons (n=8). (d) Mean fluorescence versus number of action potentials for excitatory, PV, and SST neurons. The figure is adapted from Ref. . Reproduced with permission, courtesy of Elsevier.
Fig. 3
Fig. 3
Somatic calcium signals can report a decrease in firing rate. (a) A layer 2/3 PV interneuron expresses the redshifted calcium indicator jRCaMP1a and the soma-targeted opsin GtACR2. Traces show the fluorescence and spiking activity for the neuron in vivo. The red-shaded area denoted the time of the illumination to induce inhibition. (b) In these numerical simulations, for each trial, spike times were generated as a Poisson process, in which the rate parameter was halved at t=0  s and then returned to baseline at t=2  s. The calcium response to a spike was approximated as a single-exponential function with a decay time constant of 0.55 s. To determine the fluorescence signal, the spike-induced calcium transients were summed linearly. Peristimulus time histograms (PSTH) were generated by counting spikes in 200-ms bins. The range of the vertical axis for PSTH and fluorescence signals was arbitrary and rescaled for each plot. Panel (a) is adapted from Ref. . Panel (b) is unpublished data from the Kwan lab.
Fig. 4
Fig. 4
Axonal calcium signals as a function of presynaptic neuronal activation. (a) Schematic of the experimental setup. Viruses were injected to express GCaMP6s in neurons in the RSC. Bipolar stimulating electrodes were implanted also in the RSC. Imaging was done in the Cg1/M2 to visualize the long-range axons from RSC neurons. (b) Top, in vivo two-photon image of a GCaMP6s-expressing axonal segment. Arrowhead, the example bouton analyzed. Bottom, ΔF/F traces from the example bouton in response to either 1 or 16 current injection pulses (±150  μA, 10 ms per pulse) per trial. Five trials were shown for each stimulation strength. (c) The trial-averaged ΔF/F response within 1 s of the stimulation as a function of the stimulation strength, for the example bouton in (b). Line, mean±SEM. These are unpublished data from the Kwan lab, related to a recent study.
Fig. 5
Fig. 5
Axonal calcium signals correlate with evoked dopamine release. (a) The medial forebrain bundle was stimulated to evoke dopamine release in a mouse. In the nucleus accumbens (NAc) or dorsomedial striatum (DMS), an optical fiber and a carbon-fiber microelectrode were inserted for photometric measurements of calcium and cyclic voltammetry of extracellular dopamine, respectively. Calcium signals arise from axons of GCaMP6f-expressing dopaminergic neurons in the ventral tegmental area and substantia nigra (VTA-SN). (b) Example recording of evoked dopamine efflux using cyclic voltammetry. (c) Comparison of the trial-averaged axonal calcium signal with the recorded dopamine transient. (d), (e) The latency and width of the calcium and dopamine signals, plotted separately for VTA-SN-to-NAc and VTA-SN-to-DMS axons. (f) The peak calcium signals as a function of the peak evoked dopamine levels for various stimulation strengths. Figure is adapted from Ref. . Reproduced with permission, courtesy of Springer Nature.
Fig. 6
Fig. 6
Dendritic calcium signals from bAPs. (a) The left panel shows an in vivo two-photon image of a layer 2/3 neuron in the visual cortex loaded with OGB-1. The cell was also targeted for whole-cell recording. Green lines denote the dendritic regions analyzed. The right panel shows fluorescence traces for each of the dendritic region in response to somatic current injection producing either four or two action potentials. (b) The mean amplitude of dendritic calcium signals versus the number of evoked action potentials. Each circle denotes a cell. (c) Fluorescence responses in a dendrite as a function of distance from soma. Figure is adapted from Ref. . Reproduced with permission, courtesy of Springer Nature.
Fig. 7
Fig. 7
Dendritic calcium signals from dendritic regenerative events. (a) Schematic of the experiment involving in vivo two-photon imaging and dendritic patch-clamp recording in an anesthetized mouse. (b) A layer 5 neuron in the barrel cortex expresses GCaMP3 (green). The patch pipette was filled with Alexa Fluor 594 (red). (c) The membrane potential at the apical dendrite (black) was plotted along with calcium signals (red) imaged in line-scan mode as indicated by the red line in (b). The top voltage trace is from a trial without current injection. The lower three voltage traces are from trials with a 500-ms, 700-pA current step. (d) Magnified view of the dashed boxes in (c). The gray traces are spontaneous dendritic voltage events. The black traces show plateau potentials during the paired events in which current was injected. Figure is adapted from Ref. . Reproduced with permission, courtesy of Springer Nature.
Fig. 8
Fig. 8
Dendritic calcium signals from synaptic inputs. (a) The experimental setup involving expression of GCaMP6s in RSC and jRGECO1a in Cg1/M2. (b) An in vivo two-photon image of GCaMP6s-expressing axonal boutons and jRGECO1a-expressing dendrites in Cg1/M2. (c) A scatter plot of the fluorescence transients (ΔF/F) measured from spine indicated by arrow in (b) against the ΔF/F measured from the adjacent dendritic shaft. Each open circle represents an image frame. Line, a least-squares regression line forced through the origin. (d) Fluorescence traces for the bouton and apposing spine (either with subtraction or no subtraction of the shaft contribution) in (b). (e) The probability of detecting a presynaptic calcium event in the bouton within ±0.276  s (i.e., ± the duration of one image frame) given a postsynaptic calcium event in the apposing spine, either with subtraction or no subtraction of the shaft contribution. Calcium events were determined from fluorescence traces using a peeling algorithm. Shuffled level was calculated by randomly shuffling the calcium event times of the bouton, and averaged across 100 replicates. These are unpublished data from the Kwan lab.

References

    1. Takahashi N., et al. , “Active cortical dendrites modulate perception,” Science 354(6319), 1587–1590 (2016).SCIEAS10.1126/science.aah6066 - DOI - PubMed
    1. Makino H., et al. , “Transformation of cortex-wide emergent properties during motor learning,” Neuron 94(4), 880–890.e8 (2017).NERNET10.1016/j.neuron.2017.04.015 - DOI - PMC - PubMed
    1. Siniscalchi M. J., et al. , “Fast and slow transitions in frontal ensemble activity during flexible sensorimotor behavior,” Nat. Neurosci. 19(9), 1234–1242 (2016).NANEFN10.1038/nn.4342 - DOI - PMC - PubMed
    1. Ackman J. B., Burbridge T. J., Crair M. C., “Retinal waves coordinate patterned activity throughout the developing visual system,” Nature 490(7419), 219–225 (2012).10.1038/nature11529 - DOI - PMC - PubMed
    1. de Vries S. E. J., et al. , “A large-scale, standardized physiological survey reveals higher order coding throughout the mouse visual cortex,” bioRxiv 359513 (2019).10.1101/359513 - DOI - PubMed