. 2019 Jul 24:2:272.
doi: 10.1038/s42003-019-0506-3. eCollection 2019.

The role of GRHL2 and epigenetic remodeling in epithelial-mesenchymal plasticity in ovarian cancer cells

Affiliations

The role of GRHL2 and epigenetic remodeling in epithelial-mesenchymal plasticity in ovarian cancer cells

Vin Yee Chung et al. Commun Biol. .

Abstract

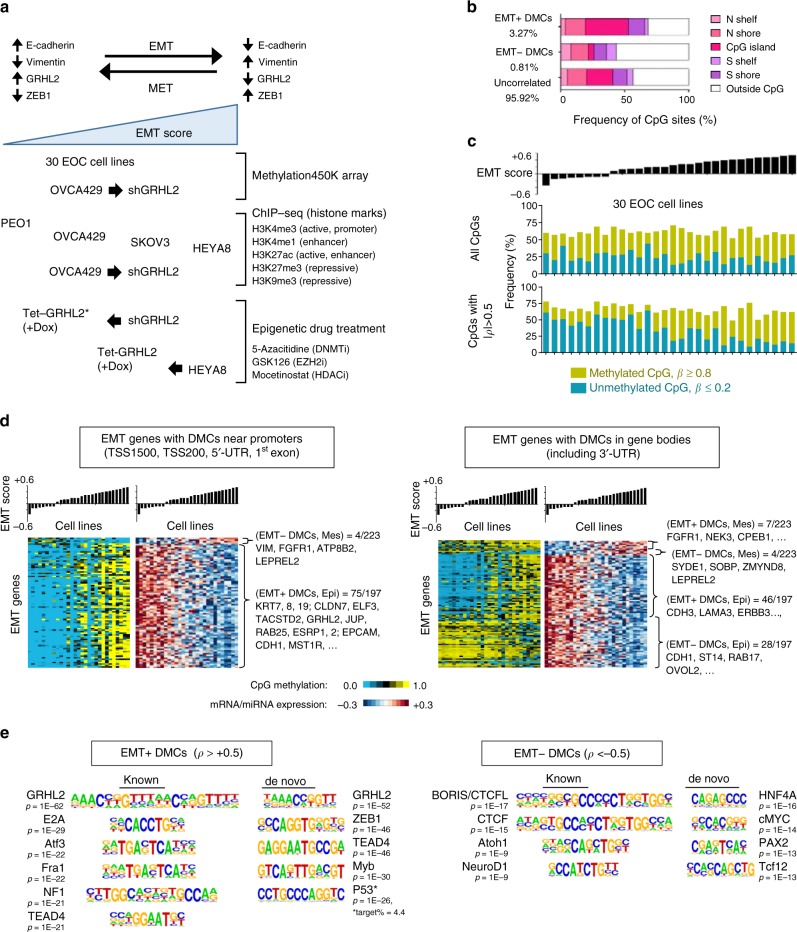
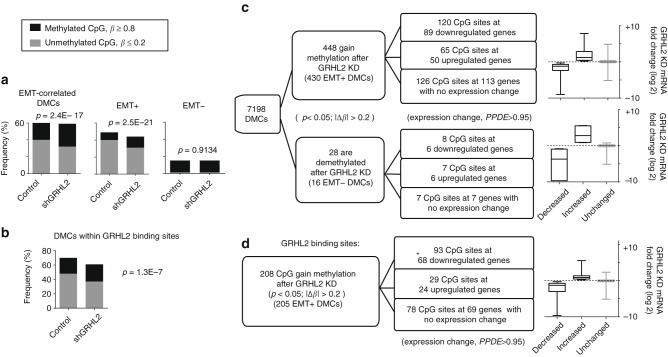
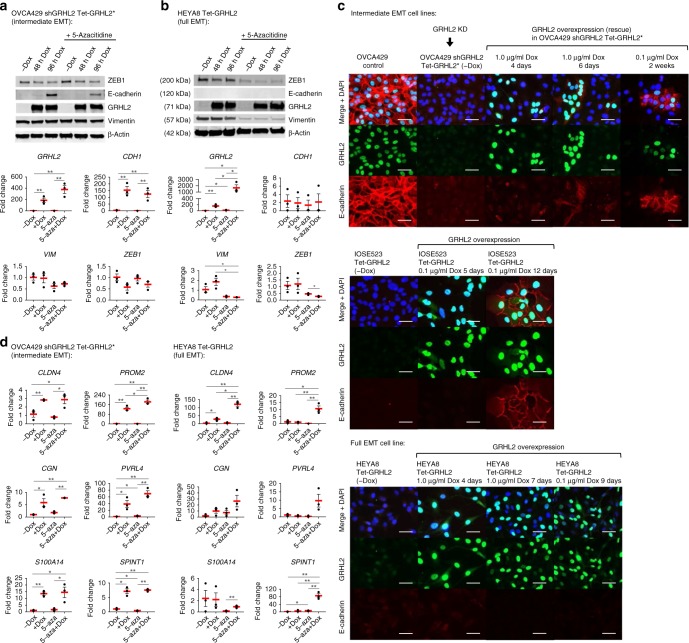
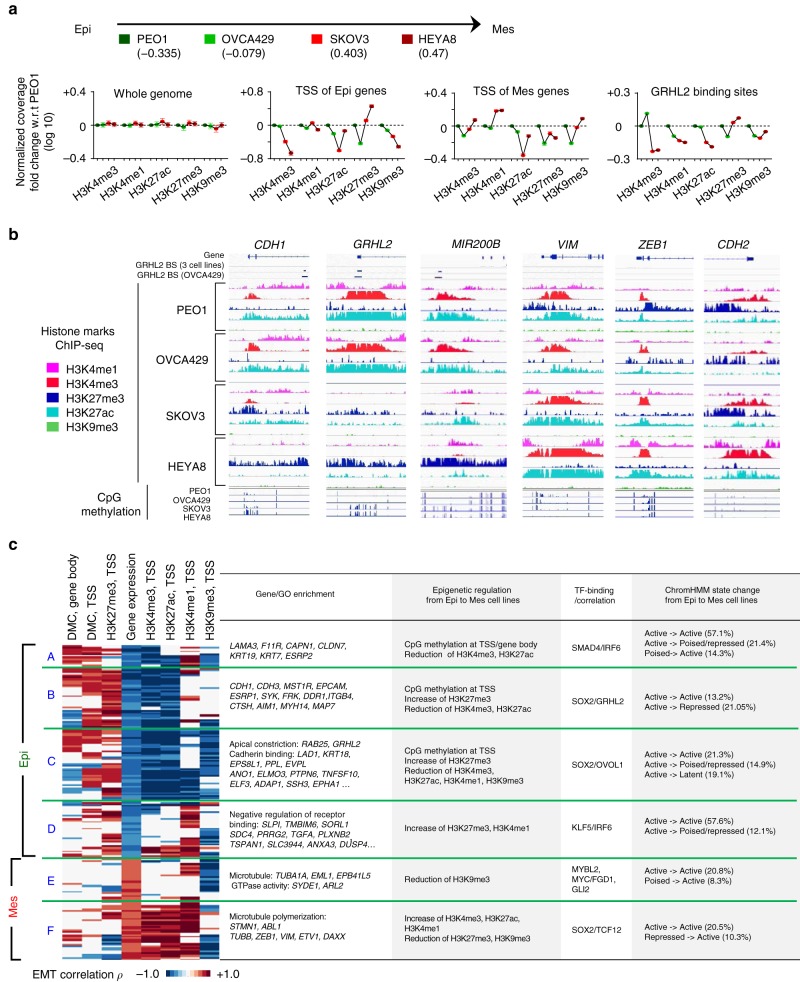
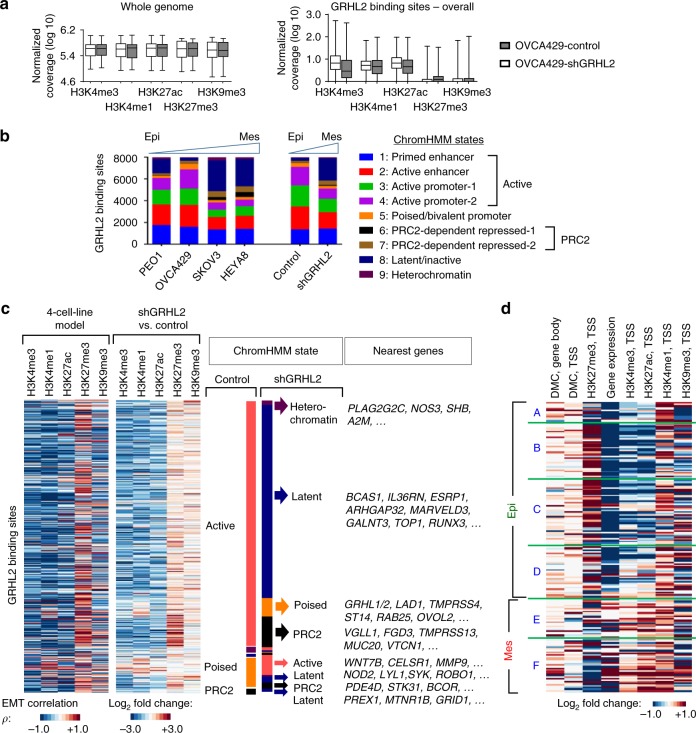
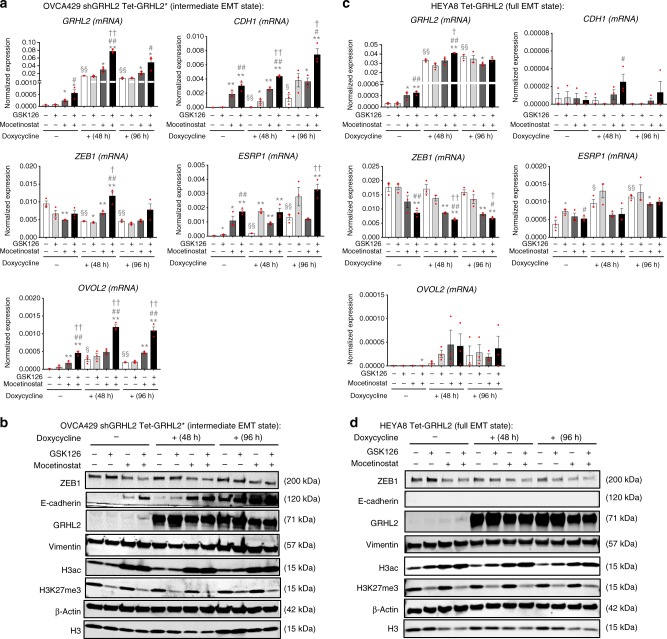
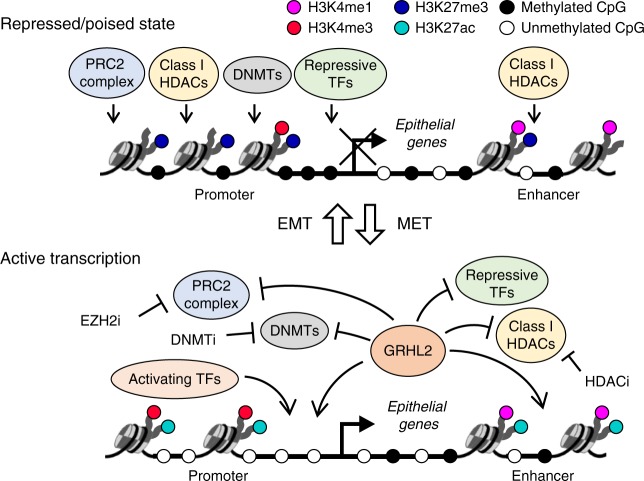
Cancer cells exhibit phenotypic plasticity during epithelial-mesenchymal transition (EMT) and mesenchymal-epithelial transition (MET) involving intermediate states. To study genome-wide epigenetic remodeling associated with EMT plasticity, we integrate the analyses of DNA methylation, ChIP-sequencing of five histone marks (H3K4me1, H3K4me3, H3K27Ac, H3K27me3 and H3K9me3) and transcriptome profiling performed on ovarian cancer cells with different epithelial/mesenchymal states and on a knockdown model of EMT suppressor Grainyhead-like 2 (GRHL2). We have identified differentially methylated CpG sites associated with EMT, found at promoters of epithelial genes and GRHL2 binding sites. GRHL2 knockdown results in CpG methylation gain and nucleosomal remodeling (reduction in permissive marks H3K4me3 and H3K27ac; elevated repressive mark H3K27me3), resembling the changes observed across progressive EMT states. Epigenetic-modifying agents such as 5-azacitidine, GSK126 and mocetinostat further reveal cell state-dependent plasticity upon GRHL2 overexpression. Overall, we demonstrate that epithelial genes are subject to epigenetic control during intermediate phases of EMT/MET involving GRHL2.

Keywords: Differentiation; Epigenetics; Ovarian cancer.


Conflict of interest statement

Competing interestsThe authors declare no competing interests.

Figures

Fig. 1
Fig. 1
Identifying differentially methylated CpG sites (DMCs) across ovarian cancer cell lines with progressive epithelial–mesenchymal transition (EMT) phenotypes. a Diagram illustrates the EMT/mesenchymal–epithelial transition (MET) models used: 30 ovarian cancer cell lines with progressive EMT scores and OVCA429 GRHL2-knockdown model for Methylation 450K array; four-cell-line model (PEO1, OVCA429, SKOV3, HEYA8) and OVCA429 GRHL2-knockdown model for histone chromatin immunoprecipitation (ChIP)-sequencing; OVCA429 shGRHL2 Tet-GRHL2* (rescue) and HEYA8 Tet-GRHL2 for epigenetic drug treatment assays. b Bar charts indicate the percentage of EMT+ DMCs, EMT− DMCs, and non EMT-correlated CpG sites identified and their respective distribution in genome-wide CpG islands. EMT+ refers to a positive correlation with EMT; EMT− refers to a negative correlation with EMT. c Bar charts showing EMT score (top); frequency of methylated and unmethylated EMT-correlated DMCs (middle); and frequency of methylated and unmethylated EMT-correlated DMCs |ρ| > 0.5 (bottom) in 30 tested cell lines (x-axis). d Heatmaps of EMT signature genes with DMCs in promoter regions (left) and those with DMCs in gene bodies (right) showing CpG methylation level (blue = low; yellow = high) and the corresponding gene expression (red = high; blue = low) in ovarian cancer cell lines with progressive EMT scores (bar chart). Only genes with strong differential expression in correlation with EMT (|ρ| > 0.5) were shown. e Known motif enrichment analysis and de novo motif discovery showing DNA-binding motifs of transcription factors that are enriched at the DMCs, such as that of GRHL2 in EMT+ DMCs (ρ > 0.5, left panel) and CTCFL in EMT− DMCs (ρ <−0.5, right panel). EOC, epithelial ovarian carcinoma
Fig. 2
Fig. 2
Gain in CpG methylation at epithelial–mesenchymal transition (EMT)-correlated differentially methylated CpG sites (DMCs) and GRHL2 binding sites following GRHL2 knockdown. a Bar graphs depict the frequency of methylated (β ≥ 0.8) and unmethylated (β ≤ 0.2) EMT-correlated DMCs (left), EMT+ DMCs (middle) and EMT− DMCs (right) in OVCA429 control vs. shGRHL2 cells. The p values of Fisher’s exact tests are shown for each group. b Bar graph indicates a slight increase (%) in methylated CpG (β ≥ 0.8) and a slight decrease (%) in unmethylated CpG (β ≤ 0.2) at DMCs within GRHL2 binding sites in GRHL2-knockdown cells, compared to control. The p value of Fisher’s exact test is shown. c Flow charts show the number of EMT-correlated DMCs that gain or lose methylation (p < 0.05; |∆β| > 0.2) after GRHL2 knockdown, with or without associated gene expression change. Box plots (right) depict the average expression log2 fold changes (messenger RNA (mRNA)) of the genes in each group after GRHL2 knockdown. d Flow chart shows the number of GRHL2 binding sites that gain or lose CpG methylation (p < 0.05; |∆β| > 0.2) after GRHL2 knockdown, with or without associated gene expression change. *This group is significantly enriched (93 vs. 29), based on Fisher’s exact test (p = 0.0427). Box-plot (right) depicts the average expression log2 fold changes (mRNA) of the genes in each group after GRHL2 knockdown. Error bars are ±s.e.m
Fig. 3
Fig. 3
Effects of GRHL2 overexpression in combination with DNA methyltransferase (DNMT) inhibitor (5-azacitidine (5-aza)) treatment. a Western blots of ZEB1, E-cadherin, GRHL2, vimentin, and β-actin in OVCA429 shGRHL2 Tet-GRHL2* cells with/without doxycycline (Dox)-induced GRHL2 overexpression for 48 and 96 h, along with/without 5-azacitidine treatment. Representative blots from three independent experiments are shown. Bar graphs (bottom) showing messenger RNA (mRNA) fold changes of GRHL2, CDH1, VIM, ZEB1 in OVCA429 shGRHL2 Tet-GRHL2* cells with/without 96 h doxycycline-induced GRHL2 overexpression, along with/without 5-aza treatment. Error bars = s.e.m. Unpaired t tests were used on independent triplicates, *0.01 < p < 0.05; **p < 0.01. b Same as in a but in the HEYA8 Tet-GRHL2 model. c Images of immunofluorescence staining showing GRHL2 (green) and E-cadherin (red) after GRHL2 knockdown or GRHL2 overexpression in the intermediate epithelial–mesenchymal transition (EMT) cell lines OVCA429 and IOSE523 and in the full EMT cell line HEYA8. Nuclei were stained blue (DAPI (4′,6-diamidino-2-phenylindole)). Scale = 50 μm. d Dot plots showing the mean mRNA fold changes (red lines) of CLDN4, PROM2, CGN, PVRL4, S100A14, SPINT1 in OVCA429 shGRHL2 Tet-GRHL2* (left) and HEYA8 Tet-GRHL2 (right) with/without 96 h doxycycline-induced GRHL2 overexpression, along with/without 5-aza treatment (data from independent triplicates). Error bars = s.e.m. Unpaired t tests were performed: *0.01 < p < 0.05; **p < 0.01. KD, knock down
Fig. 4
Fig. 4
Differential histone modifications of epithelial–mesenchymal transition (EMT) genes across ovarian cancer cell lines with progressive EMT phenotypes. a Chromatin immunoprecipitation-sequencing (ChIP-seq) results (normalized log10 coverage; y-axis) of H3K4me3, H3K4me1, H3K27ac, H3K27me3, and H3K9me3 at the whole-genome level, transcription start sites (TSS) of epithelial (Epi) signature genes, TSS of mesenchymal (Mes) signature genes, and GRHL2 binding sites in PEO1, OVCA429, SKOV3, and HEYA8 cell lines, shown with their respective EMT scores. b The epigenetic landscape of Epi signature genes CDH1, GRHL2, MIR200B and Mes signature genes VIM, ZEB1, CDH2 in PEO1, OVCA429, SKOV3, and HEYA8 cell lines. BS refers to binding site. c Heatmap depicts the EMT correlation (Pearson’s correlation ρ) of differentially methylated CpG sites (DMCs), histone H3 marks, and gene expression among 195 EMT signature genes that are clustered into six groups (A–F), in the four-cell-line model. Table (right) indicates gene names (with Gene Ontology analysis), combinations of epigenetic regulation, enrichment/correlation with TF binding, and ChromHMM state changes in each group of the genes
Fig. 5
Fig. 5
Histone modifications and chromatin states at GRHL2 binding sites and epithelial–mesenchymal transition (EMT) genes following GRHL2 knockdown. a Box plots showing chromatin immunoprecipitation-sequencing (ChIP-seq) results (normalized log10 coverage) of H3K4me3, H3K4me1, H3K27ac, H3K27me3, and H3K9me3 at the whole-genome level (left) and GRHL2 binding sites (right) in OVCA429 control and shGRHL2 cells. The band within the box represents the median and the whiskers indicate the minimum to the maximum. b Bar chart shows the number of GRHL2 binding sites with nine different ChromHMM states in the four-cell-line EMT model (PEO1, OVCA429, SKOV3, HEYA8) and GRHL2-knockdown EMT model (OVCA429 control vs. shGRHL2). c Heatmaps showing GRHL2 binding sites with differential histone H3 modifications in correlation with EMT represented by the four-cell-line model (left, Pearson’s correlation ρ), and in the GRHL2-knockdown model (right, log2 fold change). GRHL2 binding sites have lower levels of H3K4me3, H3K4me1, H3K27ac (blue) and higher levels of H3K27me3 (red) in EMT score-high and shGRHL2 cells, compared to EMT score-low and OVCA429 control cells, respectively. Diagram next to heatmaps indicates ChromHMM states and the nearest genes of the respective GRHL2 binding sites in OVCA429 control and shGRHL2 cells. d Heatmap depicts differential levels (log2 fold change) of methylation at differentially methylated CpG sites (DMCs), histone H3 marks, and gene expression among 195 EMT signature genes (shown in Fig. 4c) in OVCA429 shGRHL2 vs. control cells
Fig. 6
Fig. 6
Effects of GSK126 (enhancer of zeste homolog 2 (EZH2) inhibitor) and mocetinostat (histone deacetylase (HDAC) inhibitor) in combination with GRHL2 overexpression. a Normalized messenger RNA (mRNA) expression (2−ΔCt) of GRHL2, CDH1, ZEB1, ESRP1, and OVOL2 in OVCA429 shGRHL2 Tet-GRHL2* cells with/without doxycycline treatment (to induce GRHL2 expression) for 48 or 96 h, with/without GSK126 (EZH2 inhibitor) and/or mocetinostat (HDAC inhibitor). Data of independent triplicates are shown (red dots). Unpaired t tests were performed: * represents significance of histone drug-treated vs. no histone drug treatment; # represents significance of two drugs combined vs. GSK126 treatment only; represents significance of two drugs combined vs. mocetinostat treatment only; § represents significance of doxycycline-treated vs. no treatment control (one symbol: 0.01 < p < 0.05; two symbols: p < 0.01). Error bars = s.e.m. b Western blots of ZEB1, E-cadherin, GRHL2, vimentin, H3ac, H3K27me3, β-actin, and total H3 in OVCA429 shGRHL2 Tet-GRHL2* cells with/without doxycycline treatment (to induce GRHL2 expression) for 48 or 96 h, with/without treatment of GSK126 and/or mocetinostat. Representative blots from three independent experiments are shown. c Same as in a but in HEYA8 Tet-GRHL2 cells. d Same as in b but in HEYA8 Tet-GRHL2 cells
Fig. 7
Fig. 7
Interplay of GRHL2 and epigenetic modifiers in CpG methylation and nucleosomal remodeling of epithelial genes. A schematic model illustrating the epigenetic regulation of epithelial genes in the repressed/poised (top) or active (bottom) state during epithelial–mesenchymal transition/mesenchymal–epithelial transition (EMT/MET) involving intermediate phenotype changes. CpG methylation at promoters are associated with gene repression whereas CpG methylation in gene bodies may or may not be associated with gene transcription. A repressed/poised promoter has high H3K27me3 and low H3K4me3, whereas an active promoter has high H3K4me3 and high H3K27ac. A repressed/poised enhancer region is characterized by H3K4me1 with/without H3K27me3, whereas an active enhancer is characterized by H3K4me1 with high H3K27ac. GRHL2 may inhibit the activities of repressive TFs and/or epigenetic repressors, such as polycomb repressive complex 2 (PRC2) complex, histone deacetylases (HDACs) and DNA methyltransferases (DNMTs) at promoters and/or enhancers of epithelial genes. Reciprocally, epigenetic modifiers may modulate the function of GRHL2 in maintaining/activating the expression of epithelial genes

References

    1. Thiery JP, Sleeman JP. Complex networks orchestrate epithelial–mesenchymal transitions. Nat. Rev. Mol. Cell. Biol. 2006;7:131–142. doi: 10.1038/nrm1835. - DOI - PubMed
    1. Pastushenko I, et al. Identification of the tumour transition states occurring during EMT. Nature. 2018;556:463–468. doi: 10.1038/s41586-018-0040-3. - DOI - PubMed
    1. Nieto MA, Huang RYJ, Jackson RA, Thiery JP. EMT: 2016. Cell. 2016;166:21–45. doi: 10.1016/j.cell.2016.06.028. - DOI - PubMed
    1. Jordan NV, Johnson GL, Abell AN. Tracking the intermediate stages of epithelial–mesenchymal transition in epithelial stem cells and cancer. Cell Cycle. 2011;10:2865–2873. doi: 10.4161/cc.10.17.17188. - DOI - PMC - PubMed
    1. Ruscetti M, Quach B, Dadashian EL, Mulholland DJ, Wu H. Tracking and functional characterization of epithelial–mesenchymal transition and mesenchymal tumor cells during prostate cancer metastasis. Cancer Res. 2015;75:2749–2759. doi: 10.1158/0008-5472.CAN-14-3476. - DOI - PMC - PubMed

Publication types