. 2019 Jul 31:2:281.
doi: 10.1038/s42003-019-0508-1. eCollection 2019.

Targeting of lipid metabolism with a metabolic inhibitor cocktail eradicates peritoneal metastases in ovarian cancer cells

Affiliations

Targeting of lipid metabolism with a metabolic inhibitor cocktail eradicates peritoneal metastases in ovarian cancer cells

Rain R Chen et al. Commun Biol. .

Erratum in

Abstract

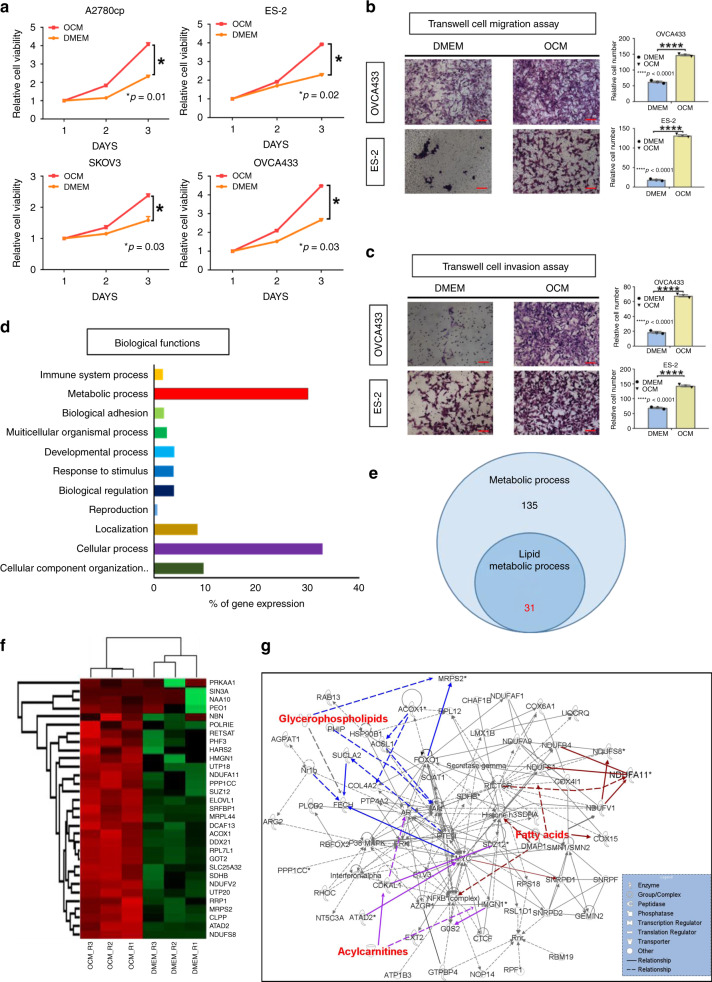
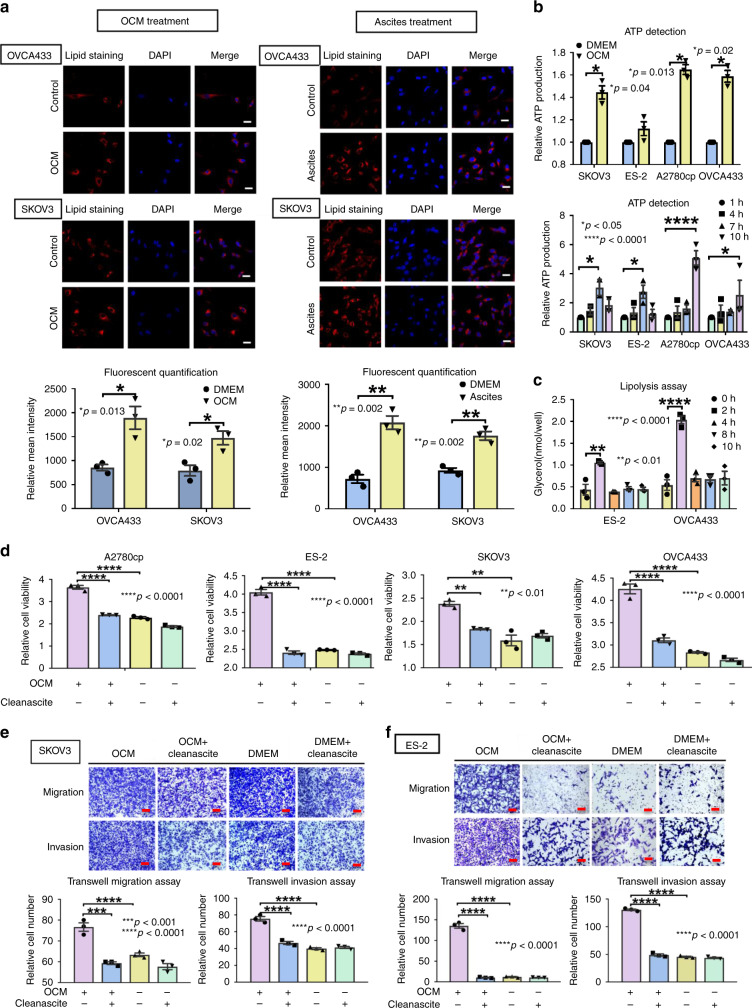
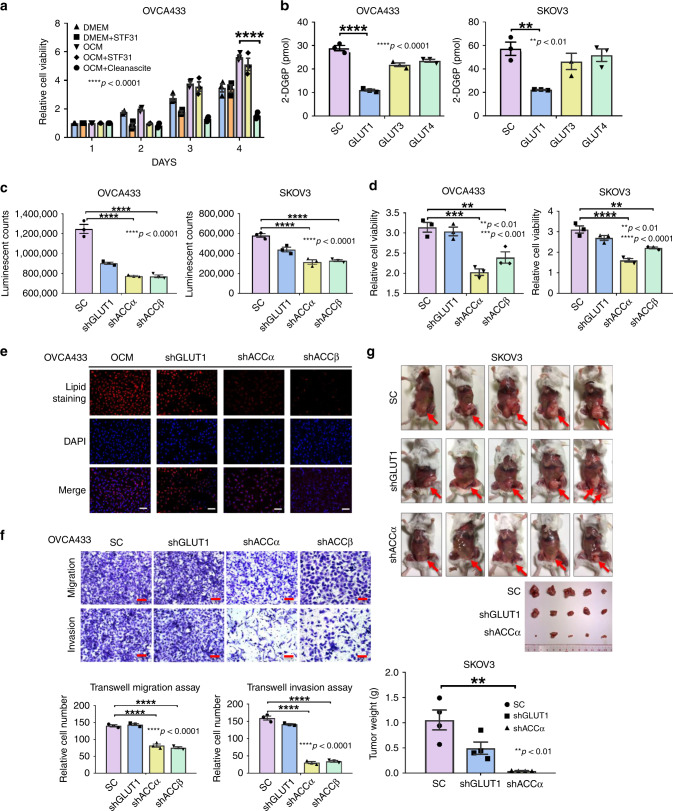
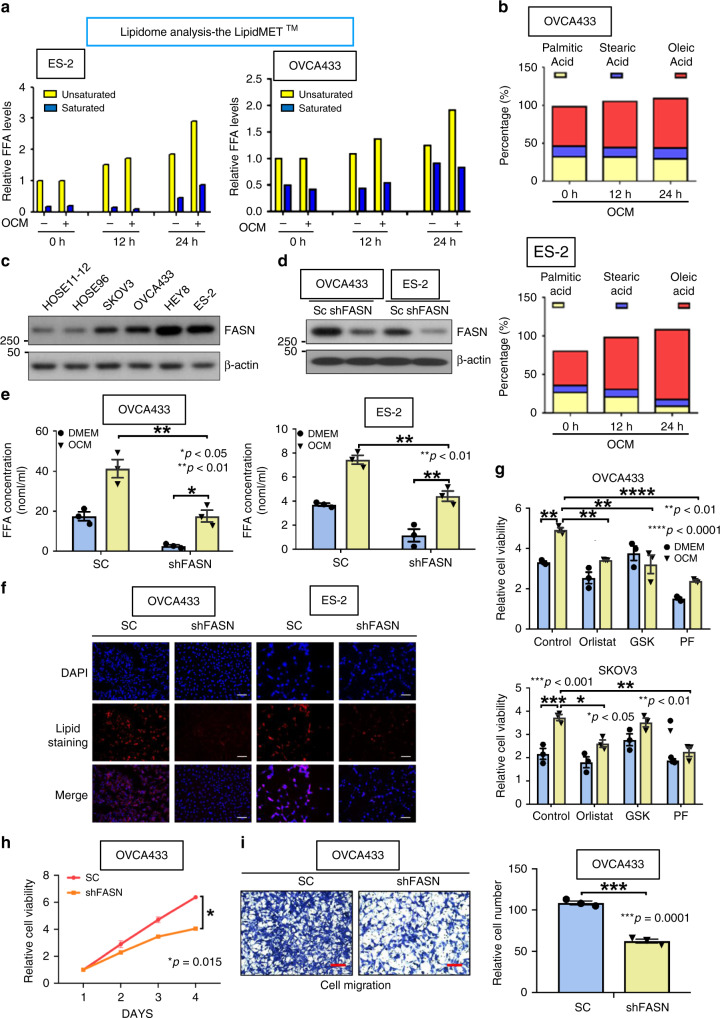
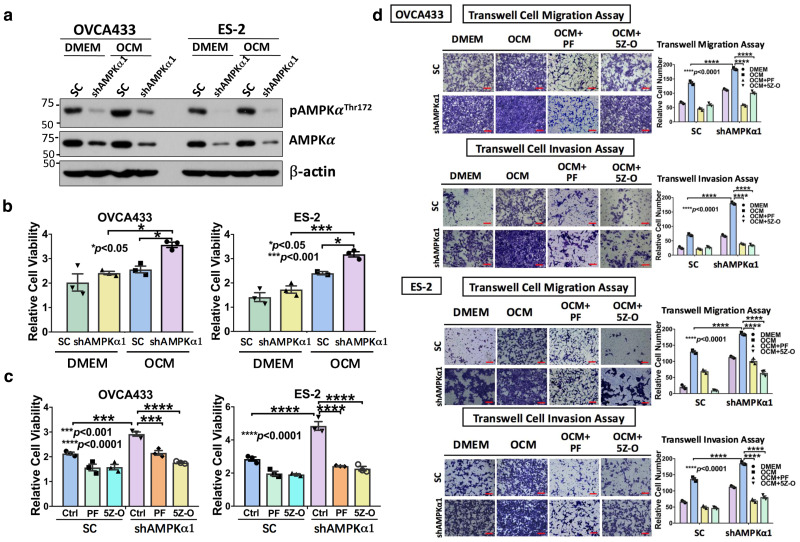
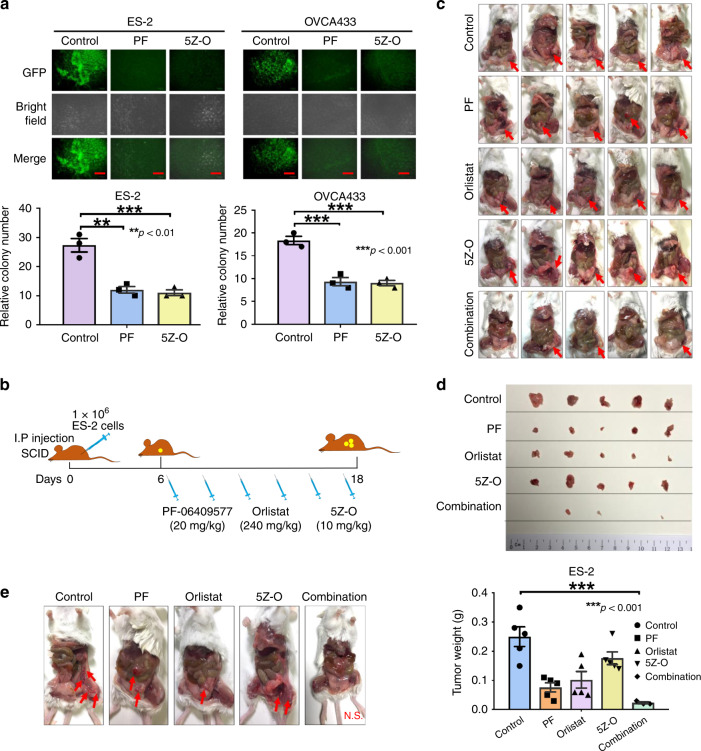
Ovarian cancer is an intra-abdominal tumor in which the presence of ascites facilitates metastatic dissemination, and associated with poor prognosis. However, the significance of metabolic alterations in ovarian cancer cells in the ascites microenvironment remains unclear. Here we show ovarian cancer cells exhibited increased aggressiveness in ascites microenvironment via reprogramming of lipid metabolism. High lipid metabolic activities are found in ovarian cancer cells when cultured in the ascites microenvironment, indicating a metabolic shift from aerobic glycolysis to β-oxidation and lipogenesis. The reduced AMP-activated protein kinase (AMPK) activity due to the feedback effect of high energy production led to the activation of its downstream signaling, which in turn, enhanced the cancer growth. The combined treatment of low toxic AMPK activators, the transforming growth factor beta-activated kinase 1 (TAK1) and fatty acid synthase (FASN) inhibitors synergistically impair oncogenic augmentation of ovarian cancer. Collectively, targeting lipid metabolism signaling axis impede ovarian cancer peritoneal metastases.

Keywords: Cancer metabolism.


Conflict of interest statement

Competing interestsThe authors declare no competing interests.

Figures

Fig. 1
Fig. 1
The lipid metabolic genes are frequently upregulated in ovarian cancer cells when cultured in OCM. a XTT cell proliferation assay demonstrates that treatment with OCM significantly increases cell growth in A2780cp, ES-2, SKOV3, and OVCA433 ovarian cancer cells. The relative cell viability was calculated by normalized to the mean value of day 1. b Transwell cell migration and c transwell cell invasion assays demonstrate that OCM treatment (12–24 h) promotes both cell migratory and invasive capacities in both OVCA433 and ES-2 cells. The stained cells were counted from four selected fields randomly. Representative images and quantitative results of cell migration and invasion were shown. Scale bar = 50 µm. d Ontology analysis on the altered genes detected by LC-MS/MS proteomic analysis indicates that most genes altered by OCM are associated with cellular and metabolic processes. The % of gene expression represents the % number of altered genes involved in each category of biological functions vs the total altered genes in ovarian cancer cells cultured in OCM as compared with the DMEM control. e A Venn diagram shows 31 out of 135 proteins related to metabolic processes are related to lipid metabolism. f Heatmap representation of the expression levels of the 31 proteins related to metabolism. g Ingenuity pathway analysis (IPA) depict interaction network of genes related to lipid metabolism in ovarian cancer cells. Results were presented as mean ± S.E.M. Data were analyzed by Student’s t-tests, and *p < 0.05 was considered as statistical significance
Fig. 2
Fig. 2
Free fatty acids from OCM provide an energy source for ovarian cancer cells. a Immunofluorescent and lipid staining analyses demonstrate that ovarian cancer cells SKOV3, OVCA433, A2780cp, and ES-2 exert lipogenesis by free fatty acid uptake from OCM (left panel) or ascites (right panel) and store free fatty acids as lipid droplets (red color by Nile Red staining) in their cytosol. Bar charts show the relative intensity of fluorescent signals (red) of OVCA433 (upper) and SKOV3 (lower) cells cultured in OCM or ascites (freshly obtained from ovarian cancer patients) for 24 h. DMEM (1%) was used as a negative control for both cell lines. Scale bar = 20 µm. b Spectrophotometric analysis and Luminescent ATP Detection Assay show a time-dependent increase in ATP production in SKOV3, ES-2, A2780cp, and OVCA433 cells. Each cell line exhibits the highest ATP production at different time points: SKOV3 and ES-2 for 7 h, while A2780cp and OVCA433 for 10 h. c Lipolysis Colorimetric Assay shows lipolysis activity from 0 to 10 h of ES-2 and OVCA433 cells upon culturing in OCM. d XTT cell proliferation assay shows that removal of fatty acids from OCM by Cleanascite (1:4 mixed with Cleanascite for 1 h before centrifugation) remarkably reduces the growth of ovarian cancer cells (A2780cp, ES-2, OVCA433, and SKOV3) compared with the negative control Cleanascite treatment in complete DMEM on day 3. Transwell cell migration/invasion assays demonstrate that the removal of free fatty acids by Cleanascite in OCM significantly reduces cell migration and invasion rates in (e) SKOV3 and (f) ES-2 cells, while the removal of fatty acids by Cleanascite in complete DMEM as negative controls does not change the cell migration or invasion rates of SKOV3 and ES-2 cells. The stained cells for cell migration and invasion were randomly counted from at least four selected fields. The representative images and bar charts were shown. Scale bar = 50 µm. Results were presented as mean ± S.E.M. Data were analyzed by Student’s t-tests or one-way/two-way ANOVA with Tukey’s post hoc test (*p < 0.05, **p < 0.01, ***p < 0.001, ****p < 0.0001)
Fig. 3
Fig. 3
Ovarian cancer cells cultured undergo metabolic reprogramming in OCM. a XTT cell proliferation assay demonstrates that 3 days of co-treatment with a glucose uptake inhibitor, STF31 (5 μM), does not affect the growth of ovarian cancer cells cultured in OCM, whereas co-treatment of Cleanascite significantly attenuates the cell proliferation rate as compared with the effect of control OCM. b The uptake of glucose in OVCA433 and SKOV3 with stable knockdown of GLUT1, GLUT3, and GLUT4 by glucose uptake assay using 2-DG6P. c Spectrophotometric analysis and Luminescent ATP Detection Assay shows that stable knockdown of either ACCα or ACCβ significantly reduces ATP production in SKOV3 and OVCA433 cells, while knockdown of GLUT1 shows slight reduction (~15–21%) of ATP production in both cell lines. d XTT cell proliferation assay reveals that the cell proliferation of OVCA433 and SKOV3 cells with stably knockdown of GLUT1, ACCα, and ACCβ on day 3. e Immunofluorescent and lipid staining analyses show that the lipid droplet formation in OCM compared with DMEM control in OVCA433 cells with stably knockdown of GLUT1, ACCα, and ACCβ. Scale bar = 50 µm. f Transwell cell migration/invasion assays show that cell migration and invasion rates in OVCA433 cells with stably knockdown of GLUT1, ACCα, and ACCβ. The stained cells were counted randomly from at least four selected fields and the representative images with bar charts were shown. Scale bar = 50 µm. g Effects of GLUT1 or ACCα knockdown on ovarian cancer dissemination in xenograft mouse tumor model. SKOV3 cells with either GLUT1 (shGLUT1) or ACCα (shACCα) knockdown were injected into the intraperitoneal cavity of 5–6-week-old SCID female mice (n = 5). Scrambled control (SC) shRNA is used as a negative control (n = 5). Tumor nodule formation and localization are shown (red arrow); imaged were captured on day 45 after cancer cell inoculation. The bar chart indicates that the average tumor weight of the shACCα and shGLUT1 experimental groups are significantly lower than the SC groups. Results were presented as mean ± S.E.M. Data were analyzed by Student’s t-tests or one-way/two-way ANOVA with Tukey’s post hoc test (*p < 0.05, **p < 0.01, ***p < 0.001, ****p < 0.0001)
Fig. 4
Fig. 4
Ovarian cancer cells undergo lipogenesis in OCM. a The bar chart shows the Lipidomic analysis of the amount of intercellular unsaturated and saturated fatty acids in two ovarian cancer cells which were cultured in OCM from 0 to 24 h. The DMEM is used as a negative control. The Lipidomic analysis was performed by Metabo-Profile, Shanghai, China. b The percentage bar chart shows the changes of the major unsaturated fatty acid, Oleic acid, and two saturated fatty acids, Stearic acid and Palmitic acids in OVCA433 and ES-2 cells cultured in OCM from 0 to 24 h. c Western blot analysis compares the expression level of a key lipogenic enzyme, FASN, in two HOSEs and four ovarian cancer cell lines, SKOV3, OVCA433, Hey8, and ES-2. d Western blot analysis shows the reduction of FASN knockdown by lentiviral shRNAi approach in OVCA433 and ES-2. e Free fatty acid assay demonstrates the depletion of FASN leads to the reduction of long chain fatty acid (>8 carbon) in OVCA433 and ES-2 cells when cultured in DMEM or OCM. f Lipid droplet formation assay reveals the formation of lipid droplets in FASN knockdown OVCA433 and ES-2 cells as compared with their scrambled controls (SC). Scale bar = 50 µm. g XTT cell proliferation assay shows that 3 days of co-treatment with the above FASN inhibitors, orlistat (30 µM) and GSK2194069 (100 nM) (GSK), or AMPK activator, PF-06409577 (50 μM) (PF), significantly reduces the OCM-induced cell growth rate in SKOV3 and OVCA433 cells. h XTT cell proliferation assay reveals that the cell proliferation of OVCA433 with or without FASN knockdown co-cultured in OCM for 4 days. i Transwell cell migration assay shows the cell migratory rate of OVCA433 with or without FASN knockdown co-cultured in OCM for 12 h. The stained cells were counted from three selected fields randomly. Representative images and quantitative results of cell migration were shown. Scale bar = 50 µm. Results were presented as mean ± S.E.M. Data were analyzed by Student’s t-tests or one-way/two-way ANOVA with Tukey’s post hoc test (*p < 0.05, **p < 0.01, ***p < 0.001, ****p < 0.0001)
Fig. 5
Fig. 5
Oncogenic pathways regulated by AMPK in ovarian cancer cells. a Long-term culture with OCM (24 h) leads to reduction in AMPK activity (pAMPKThr172), activation of mTOR activity (pmTORSer2448), and increased phosphorylation of p70S6K (pP70S6KThr389) in ES-2 and SKOV3 cells. b While culturing OVCA433 cells in OCM for 24 h leads to downregulation of pAMPKThr172, but elevation of the level of pTAKSer412. c Long-term culture with OCM (24 h) with ES-2 and OVCA433 causes an inverse relationship between the AMPK (reduced pAMPK Thr172) and TAK1 (increased pTAK1Ser412) activities. d The level of pAMPKThr172 is increased, while the level of pTAK1Ser412 is reduced upon treatment with AMPK activator, PF-06409577 (24 h), in a dose-dependent manner in OVCA433 and ES-2 ovarian cancer cells. e Co-treatment with TAK1 inhibitor, (5Z)-7-Oxozeaenol (2.5 μM), substantially inhibits the expression of pTAK1Ser412 in a dose-dependent manner (24 h), and this effect is accompanied by an increase in pAMPKThr172 levels in OVCA433 and SKOV3 cells. f Knockdown of endogenous TAK1 by shRNAi more than 70% does not alter either pAMPKThr172 or total AMPK in OVCA433 cells
Fig. 6
Fig. 6
Targeting AMPK or inhibiting TAK1 signaling activity impairs ovarian cancer aggressiveness. a AMPKα1 knockdown stable clones were established via shRNA lentiviral approach targeting the α1-isoform of AMPK in OVCA433 and ES-2 cells, and cells cultured in DMEM or OCM (2 h) could not induce AMPK activity (pAMPKThr172) in shAMPKα1 clones compared with their scrambled controls (SC) of both cell lines. b XTT cell proliferation assay shows that OCM can promote proliferation of ES-2 and OVCA433 cells, but after depletion of AMPKα1 in both cell lines, shAMPKα1 clones show significantly higher cell proliferation than that of scrambled controls (SC) cultured in DMEM or OCM for 3 days. c XTT cell proliferation assay shows that 3 days of co-treatment with AMPK activator PF-06409577 (50 μM) (PF) or TAK1 inhibitor (5Z)-7-Oxozeaenol (2.5 μM) (5Z-O) significantly inhibited cell proliferation in both parental and AMPKα knockdown clones compared with the scrambled controls (SC) of ES-2 and OVCA433 cells. d Transwell cell migration/invasion assays demonstrate that the cell migratory and invasive capacities of OVCA433 and ES-2 cells are enhanced by OCM. Knockdown of AMPKα1 further promotes the migration and invasion rates of cells cultured in OCM or DMEM. In contrast, co-treatment with AMPK activator PF-06409577 (50 μM) (PF) or TAK1 inhibitor 5Z-O (2.5 μM) somewhat abrogated the cell migratory and invasive capacities of AMPKα1 knockdown clones and scrambled controls (SC) of both cell lines. The stained cells were counted at least from four randomly selected fields. Representative images and quantitative results were shown by bar charts. Scale bar = 50 μm
Fig. 7
Fig. 7
AMPK/FASN/TAK1/NF-κB signaling axis is required for metastatic colonization. a eGFP-labeled ES-2 and OVCA433 ovarian cancer cells were established by infection with LV-CMV-RLuc-IRES-GFP lentiviral particles. After incubating GFP-labeled ovarian cancer cells with omental tissues from 6- to 8-week-old SCID female mice, the results show that ES-2 and OVCA433 cells exhibit a significant number of tumor colonies on murine omenta on day 30. However, co-treatment with AMPK activator PF-06409577 (50 μM) (PF) or TAK1 inhibitor 5Z-O (2.5 μM), remarkably reduces the number and size of tumor colonies by 45–55% on the murine omenta. Scale bar = 100 μm. b Schematic overview showing the experimental protocol of the anti-tumorigenic effect of the combined cocktail of the AMPK activator PF-06409577 (20 mg/kg), FASN inhibitor orlistat (240 mg/kg), and TAK1 inhibitor 5Z-O (10 mg/kg) on ovarian cancer cells in SCID mice. ES-2 cells (1 × 106/200 µl) were injected into the intraperitoneal cavity of 5–6-week-old SCID female mice. On day 6, the above three drug reagents were injected individually or in combination (for a total of six injections) from day 6 to day 18. c Images show tumor formation in all mice. d Images showing tumor nodules obtained from all mice. The bar chart shows the average tumor weight obtained from each group. e Representative images showing the number and locations of tumor nodules distributed in the intraperitoneal cavity of each mouse group. Results were presented as mean ± S.E.M. Data were analyzed by one-way ANOVA with Tukey’s post hoc test (*p < 0.05, **p < 0.01, ***p < 0.001, ****p < 0.0001)

References

    1. Roett, M. A. & Evans, P. Ovarian cancer: an overview. Am. Fam. Physician80, 609–616 (2009). - PubMed
    1. Bristow, R. E., Tomacruz, R. S., Armstrong, D. K., Trimble, E. L. & Montz, F. J. Survival effect of maximal cytoreductive surgery for advanced ovarian carcinoma during the platinum era: a meta-analysis. J. Clin. Oncol.20, 1248–1259 (2002). - PubMed
    1. Vergote, I. et al. Neoadjuvant chemotherapy or primary surgery in stage IIIC or IV ovarian cancer. New Engl. J. Med.363, 943–953 (2010). - PubMed
    1. Clark, R. et al. Milky spots promote ovarian cancer metastatic colonization of peritoneal adipose in experimental models. Am. J. Pathol.183, 576–591 (2013). - PMC - PubMed
    1. Khan, S. M. et al. In vitro metastatic colonization of human ovarian cancer cells to the omentum. Clin. Exp. Metastas.27, 185–196 (2010). - PubMed

Publication types

MeSH terms