

Extended multimodal whole-brain anatomical covariance analysis: detection of disrupted correlation networks related to amyloid deposition
- PMID: 31372540
- PMCID: PMC6656959
- DOI: 10.1016/j.heliyon.2019.e02074
Extended multimodal whole-brain anatomical covariance analysis: detection of disrupted correlation networks related to amyloid deposition
Abstract
Background: An anatomical covariance analysis (ACA) enables to elucidate inter-regional connections on a group basis, but little is known about the connections among white matter structures or among gray and white matter structures. Effect of including multiple magnetic resonance imaging (MRI) modalities into ACA framework in detecting white-to-white or gray-to-white connections is yet to be investigated.
New method: Proposed extended anatomical covariance analysis (eACA), analyzes correlations among gray and white matter structures (multi-structural) in various types of imaging modalities (T1-weighted images, T2 maps obtained from dual-echo sequences, and diffusion tensor images (DTI)). To demonstrate the capability to detect a disruption of the correlation network affected by pathology, we applied the eACA to two groups of cognitively-normal elderly individuals, one with (PiB+) and one without (PiB-) amyloid deposition in their brains.
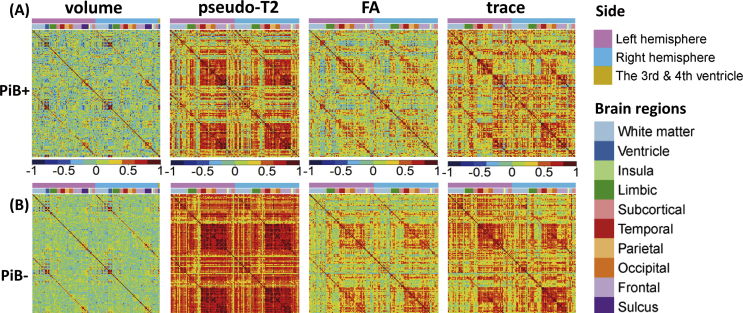
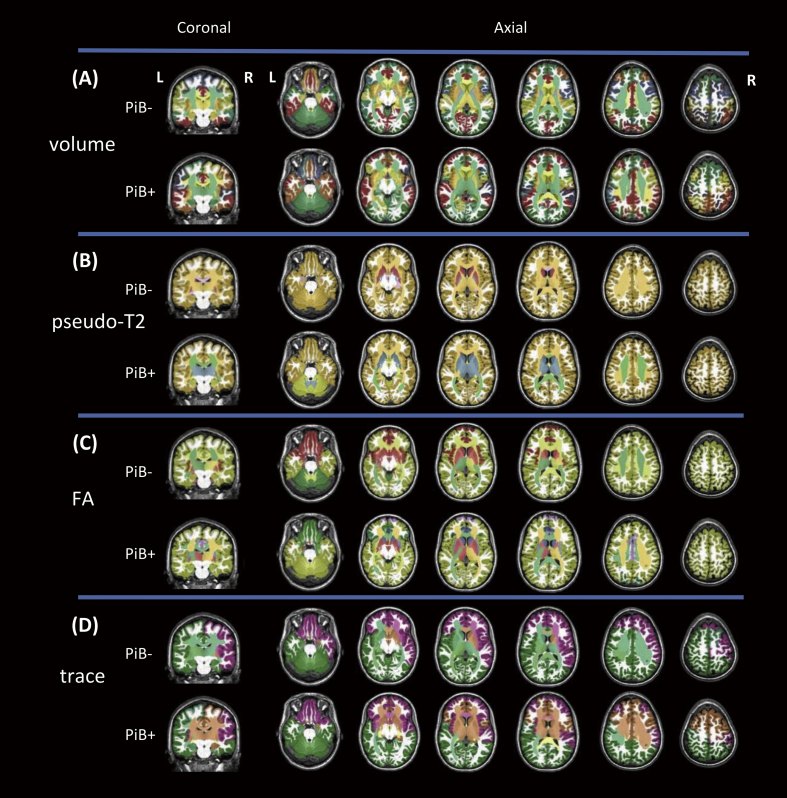
Results: The volume of each anatomical structure was symmetric and functionally related structures formed a cluster. The pseudo-T2 value was highly homogeneous across the entire cortex in the PiB- group, while a number of physiological correlations were altered in the PiB + group. The DTI demonstrated unique correlation network among structures within the same phylogenetic portions of the brain that were altered in the PiB + group.
Comparison with existing method: The proposed eACA expands the concept of existing ACA to the connections among the white matter structures. The extension to other image modalities expands the way in which connectivity may be detected.
Conclusion: The eACA has potential to evaluate alterations of the anatomical network related to pathological processes.
Keywords: Amyloid; Anatomical covariance; Correlation network; Diffusion tensor imaging; Magnetic resonance imaging; Neuroscience; Positron emission tomography; T2 relaxation.
Figures


References
-
- Aizenstein H.J., Nebes R.D., Saxton J.A., Price J.C., Mathis C.A., Tsopelas N.D., Ziolko S.K., James J.A., Snitz B.E., Houck P.R., Bi W., Cohen A.D., Lopresti B.J., DeKosky S.T., Halligan E.M., Klunk W.E. Frequent amyloid deposition without significant cognitive impairment among the elderly. Arch. Neurol. 2008;65:1509–1517. - PMC - PubMed
Grants and funding
LinkOut - more resources
Full Text Sources
