. 2018:2:PO.17.00198.
doi: 10.1200/PO.17.00198. Epub 2018 Apr 19.

Comparative RNA-Sequencing Analysis Benefits a Pediatric Patient With Relapsed Cancer

Affiliations

Comparative RNA-Sequencing Analysis Benefits a Pediatric Patient With Relapsed Cancer

Yulia Newton et al. JCO Precis Oncol. 2018.

Abstract

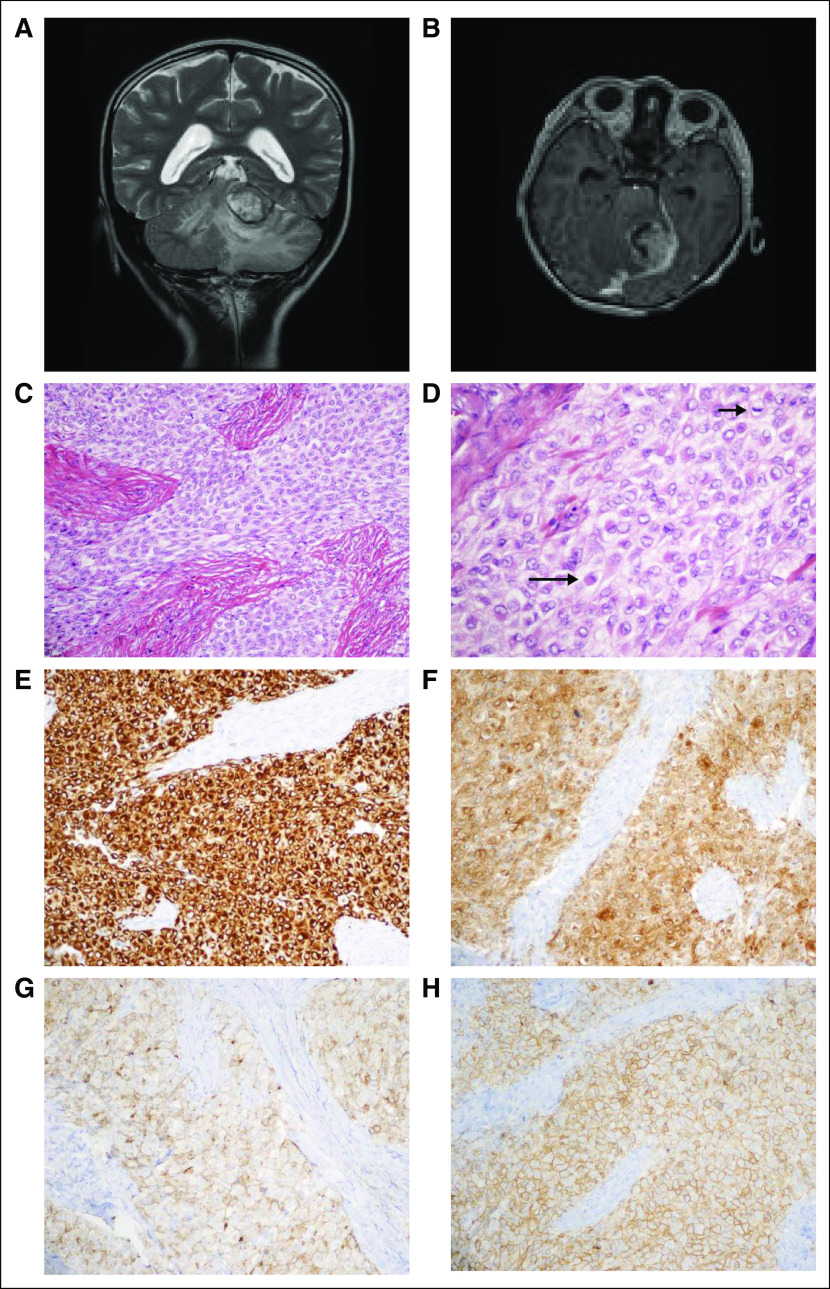
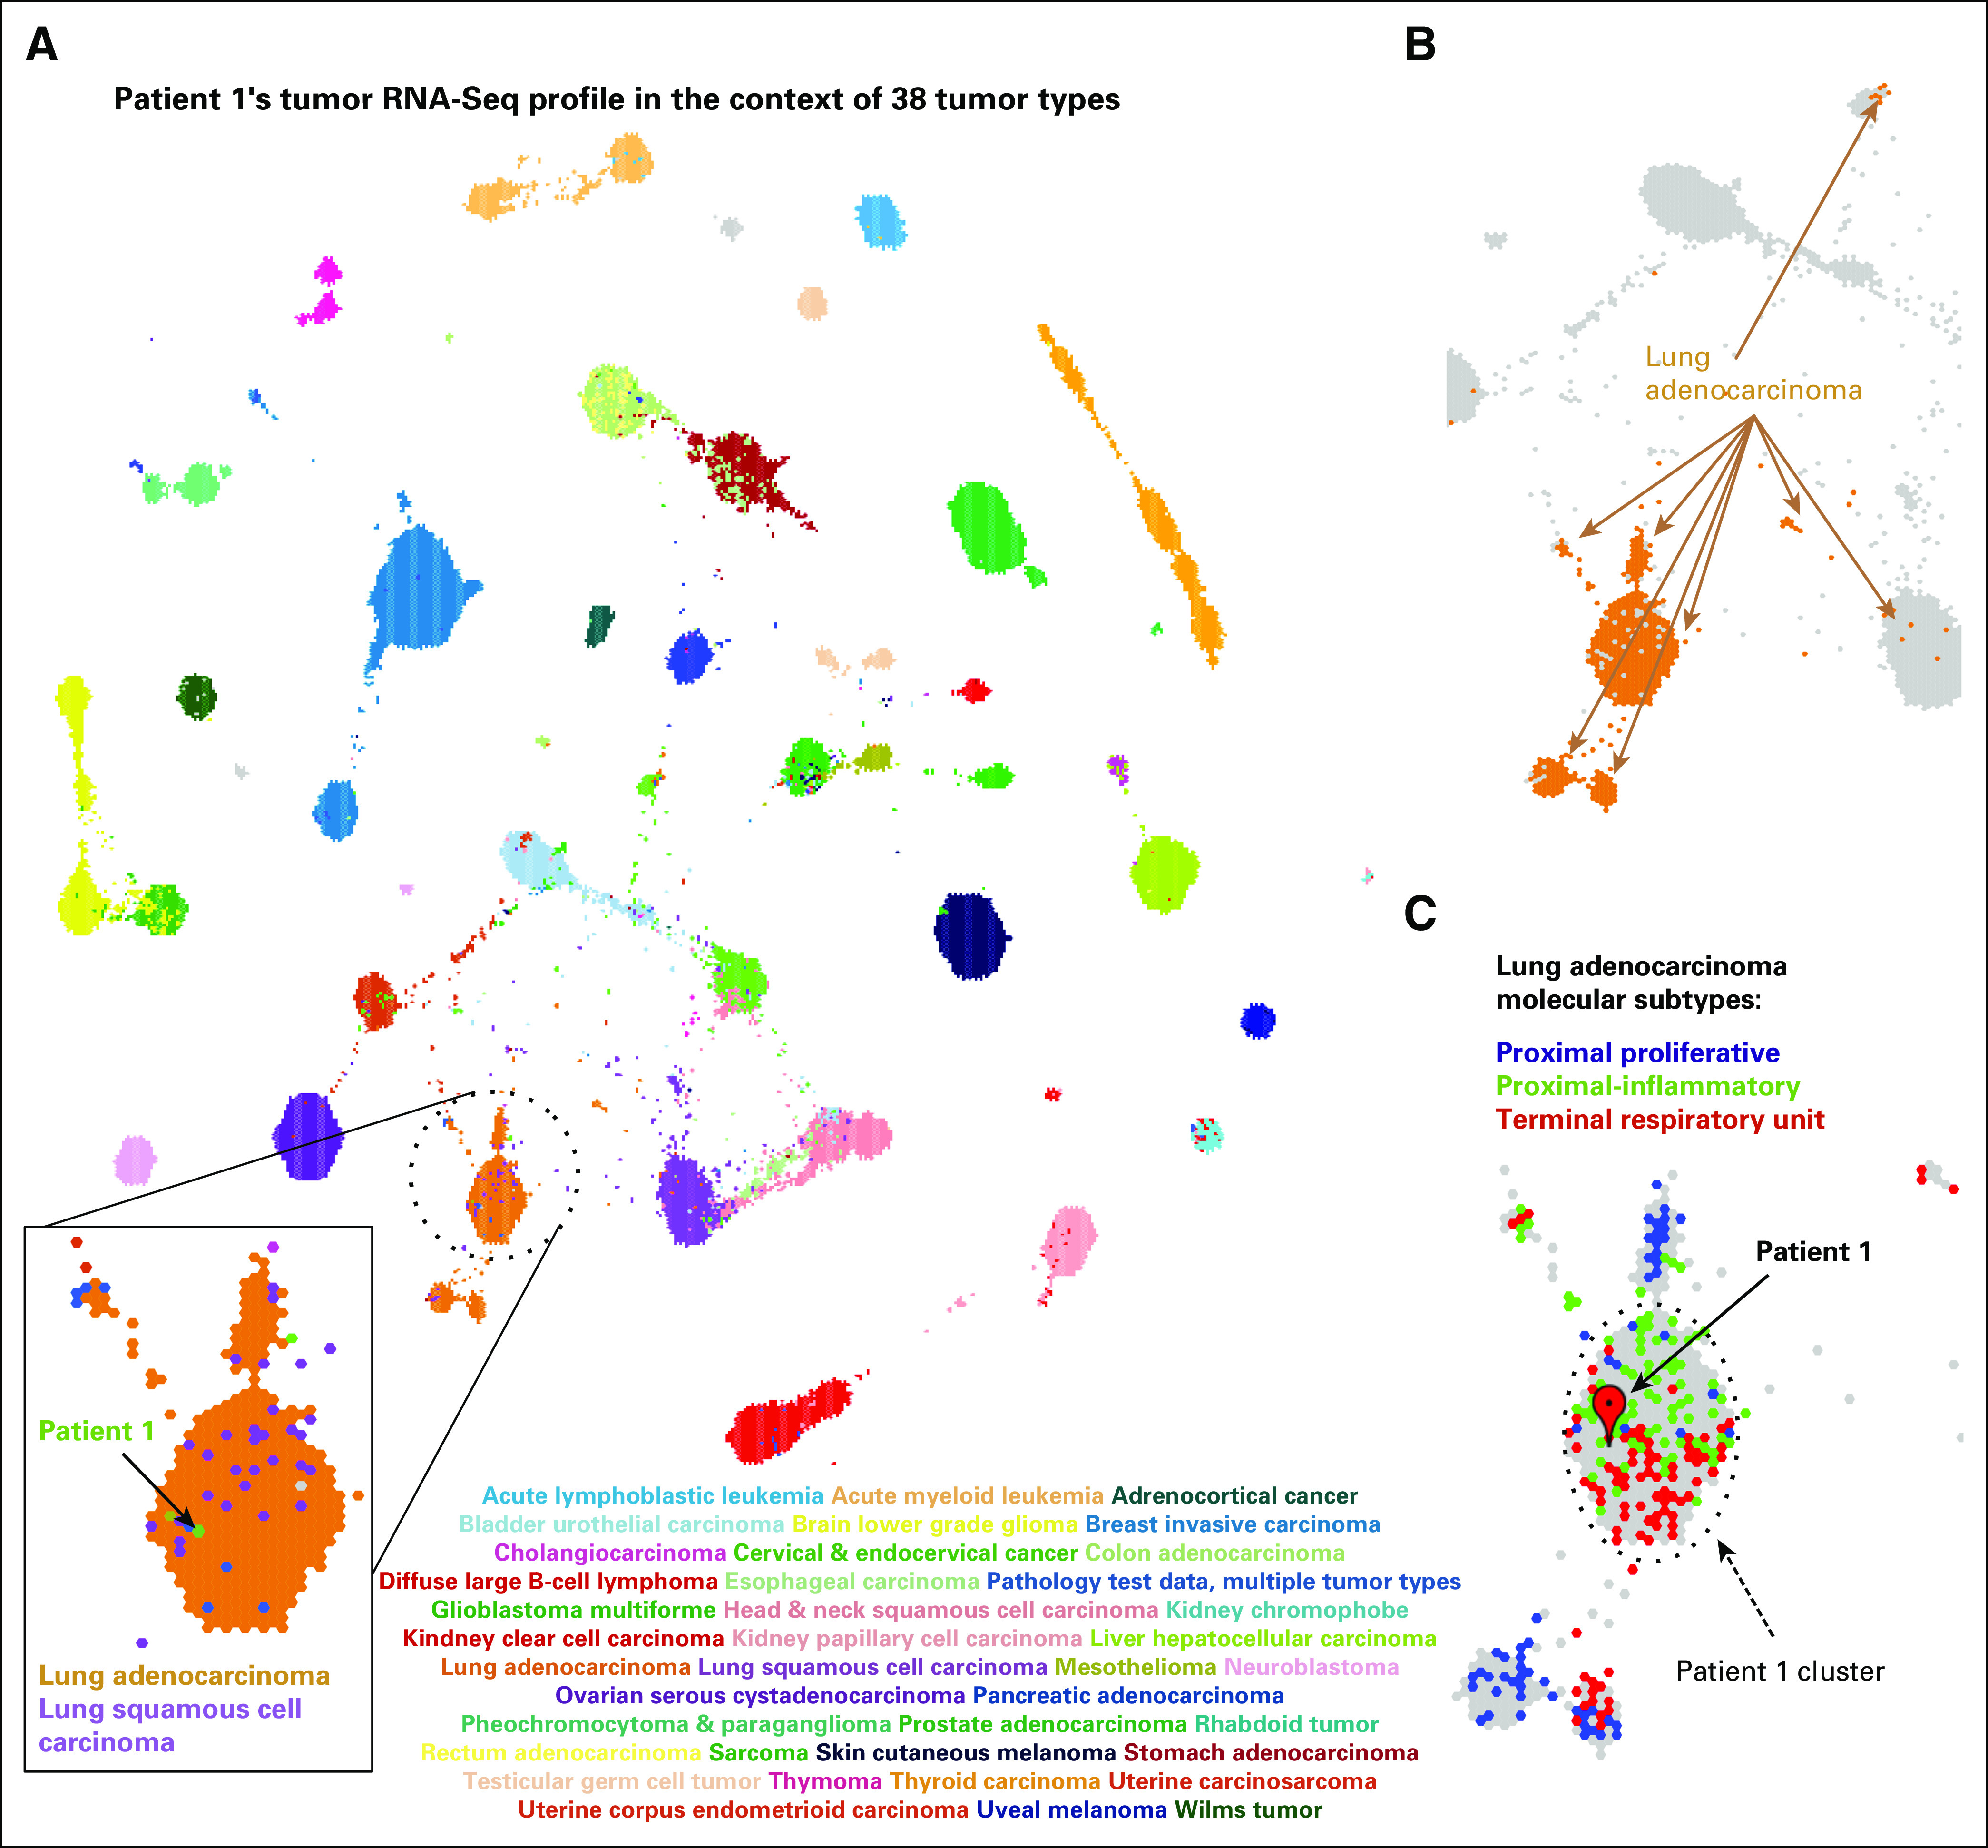
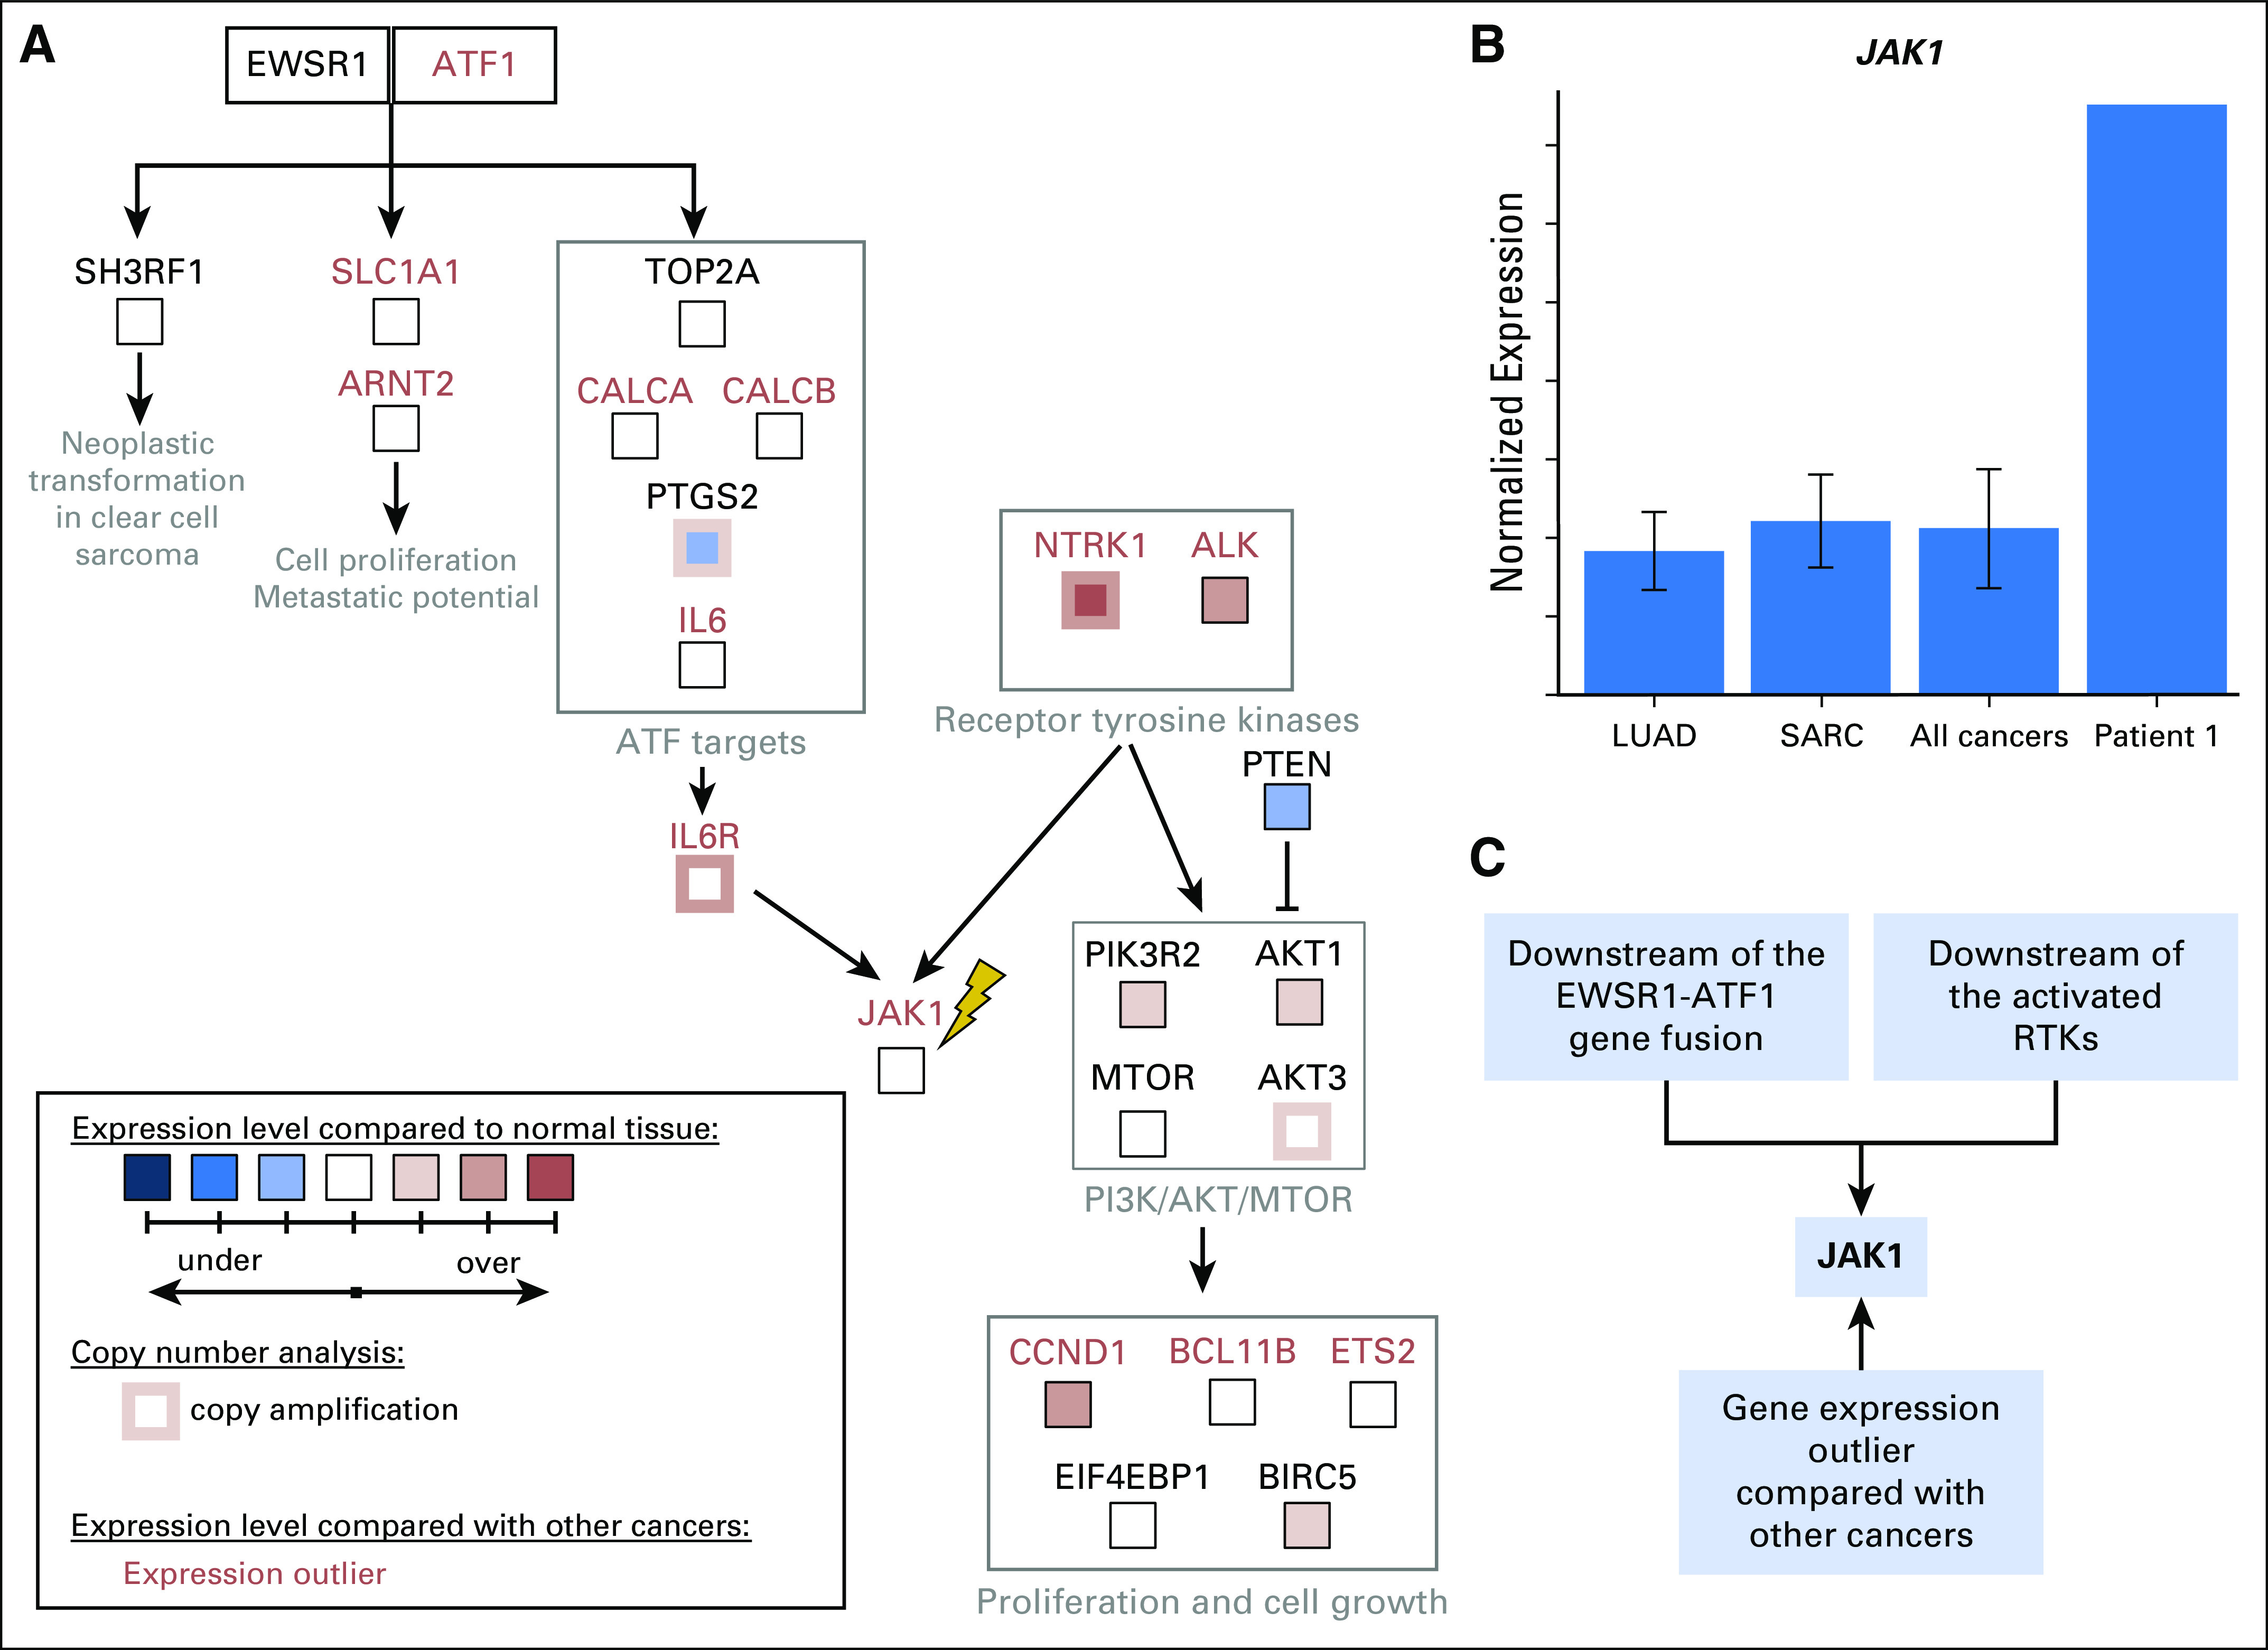
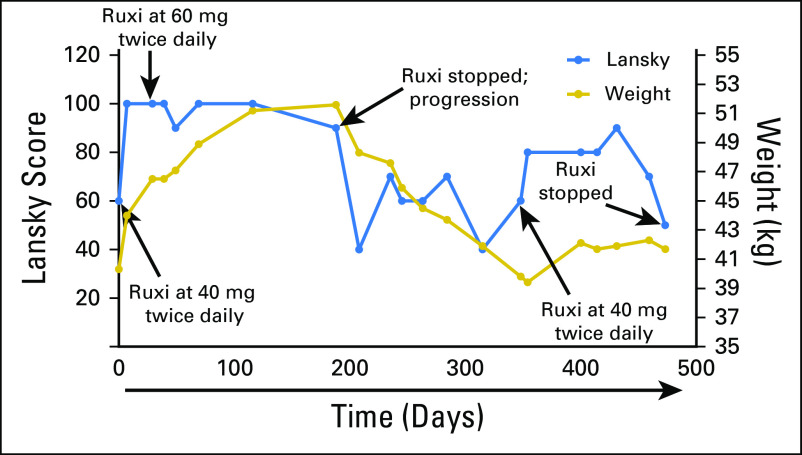
Clinical detection of sequence and structural variants in known cancer genes points to viable treatment options for a minority of children with cancer.1 To increase the number of children who benefit from genomic profiling, gene expression information must be considered alongside mutations.2,3 Although high expression has been used to nominate drug targets for pediatric cancers,4,5 its utility has not been evaluated in a systematic way.6 We describe a child with a rare sarcoma that was profiled with whole-genome and RNA sequencing (RNA-Seq) techniques. Although the tumor did not harbor DNA mutations targetable by available therapies, incorporation of gene expression information derived from RNA-Seq analysis led to a therapy that produced a significant clinical response. We use this case to describe a framework for inclusion of gene expression into the clinical genomic evaluation of pediatric tumors.


Conflict of interest statement

AUTHORS’ DISCLOSURES OF POTENTIAL CONFLICTS OF INTEREST The following represents disclosure information provided by authors of this manuscript. All relationships are considered compensated. Relationships are self-held unless noted. I = Immediate Family Member, Inst = My Institution. Relationships may not relate to the subject matter of this manuscript. For more information about ASCO’s conflict of interest policy, please refer to www.asco.org/rwc or ascopubs.org/po/author-center.

Figures

Fig 1.
Fig 1.
Case clinical information. (A) Preoperative magnetic resonance imaging (MRI). T2-weighted coronal sequence revealed a large, primarily hyperintense tumor that arises from the ventral aspect of the left tentorium, invaginating into the superior aspect of the cerebellum and causing diffuse edema therein. (B) Preoperative MRI. T1-weighted axial sequence with gadolinium revealed strong enhancement. (C) Routine tumor histology. Hematoxylin and eosin (H&E)–stained representative section revealed a combination of epithelioid and spindled tumor cells among thick fibrous bands (× 200 magnification). (D) Routine tumor histology. Higher magnification depicts epithelioid tumor cells (eg, long arrow) and a mitotic figure (short arrow); many of the tumor cells exhibit somewhat vacuolated cytoplasm (H&E; × 400 magnification). (E-H) Tumor immunohistochemistry. Strong diffuse cytoplasmic immunostaining is exhibited for (E) desmin and (F) neuron-specific enolase (NSE). Diffuse membranous immunostaining is appreciated for (G) epithelial membrane antigen (EMA), and (H) CD99 (all photomicrographs taken at × 200 magnification).
Fig 2.
Fig 2.
RNA-Seq–based gene expression profile for patient 1 visualized in the context of the reference cohort of 38 adult and pediatric tumor types. (A) A projection of the entire tumor cohort in two dimensions according to the TumorMap method. Individual tumors are represented by hexagons, and colored tumors by the tumor type, as indicated in the graphic. The tumor in patient 1 is shown in green within the lung tumors. (B) Lung adenocarcinoma (LUAD) tumors are found in four main regions of the TumorMap visualization. LUAD tumors are depicted in orange, whereas all other tumor types are in gray. (C) A zoomed-in view of the cluster for patient 1 and the surrounding area that contains LUAD tumors, now colored according to LUAD molecular subtypes (proximal proliferative, blue; proximal inflammatory, green; terminal repiratory unit, red). Unclassified samples are colored in gray.
Fig 3.
Fig 3.
Molecular rationale for using ruxolitinib to treat the sarcoma in patient 1. (A) Candidate pathway that drove tumorigenesis in patient 1 was reconstructed on the basis of outlier analysis, differential expression analysis compared with normal tissues, copy number information, and literature mining (Appendix Methods). Both EWSR1-ATF1 and receptor tyrosine kinases NTRK1 and ALK can contribute to the activation of IL6/JAK/STAT3 signaling. All gene expression outliers depicted in the figure (gene names written in red font) were significant in all three comparisons: patient 1 versus all cancers, patient 1 versus lung adenocarcinomas, and patient 1 versus sarcomas. JAK1, the molecular target of ruxolitinib, is indicated with a yellow lightning bolt. (B) The tumor in patient 1 expresses JAK1 at a strikingly higher level than those seen in all 10,668 tumors, which are represented by 38 tumor types studied by the TCGA and TARGET (denoted PANCAN), including lung adenocarcinomas (LUADs) and sarcomas (SARCs). (C) JAK1 is an attractive molecular target for patient 1’s tumor because it is downstream of the EWSR1-ATF1 fusion and the activate receptor tyrosine kinases (RTKs). It was also identified as over expressed by gene expression outlier analysis.
Fig 4.
Fig 4.
Clinical response of patient 1 to ruxolitinib (Ruxi). Ruxi was initiated at day 0 at 40 mg twice per day. The patient’s body weight was 40.3 kg, and the Lansky play-performance score was 60 at the time of treatment initiation. During treatment, the patient’s status improved significantly according to both body weight and Lansky play-performance score, which reached normal levels; thus, the Ruxi dose was increased to 60 mg twice per day at day 29. The patient continued to receive this dose until disease progression according to computed tomography occurred at day 188 (Ruxi stopped; progression). Ruxi was restarted at day 348, and a response again was noted according to both body weight and Lansky performance score.
Fig A1.
Fig A1.
Schematic representation of the EWSR1-ATF1 fusion. Two forms of the fusion were identified; the EWSR1-ATF1 form had higher expression than the reciprocal ATF1-EWSR1 form. BZIP, basic leucine zipper domain, which mediates sequence specific DNA binding properties and the leucine zipper that is required to hold together (dimerize) two DNA binding regions; pKID, phosphorylated kinase-inducible-domain; RRM, RNA recognition motif; ZF, Zn-finger in Ran binding protein and others.
Fig A2.
Fig A2.
Relative expression levels of EWSR1, ATF1, and JAK1, compared to different cohorts of adult (TCGA) and pediatric (TARGET) tumours. Patient 1 tumor gene expression levels are indicated by the red vertical line. The two cohorts used for the outlier analysis are highlighted in gold. Ped, pediatric tumor types; TARGET, Therapeutically Actionable Research to Generate Effective Treatments; TGCA, The Cancer Genome Atlas.
Fig A3.
Fig A3.
Gene Set Enrichment Analysis (GSEA) of the gene scores obtained through differential gene expression analysis comparing patient 1’s TumorMap cluster to the whole reference compendium (left) and to the remaining TCGA LUAD samples (right) identifies IL6/JAK/STAT3 pathway as one of the most significantly enriched pathways in genes differentially overexpressed in patient 1’s TumorMap cluster.
Fig A4.
Fig A4.
Full candidate pathway that represents molecular drivers of tumorigenesis in the sarcoma of patient 1. We reconstructed this pathway on the basis of the outlier analysis, differential gene expression analysis, copy number information and literature mining (Appendix Methods). A simplified version of this pathway is presented in Figure 3A. Both EWSR1-ATF1 and receptor tyrosine kinases PDGFRB, NTRK1, ALK, and FGFR1 can contribute to the activation of IL6/JAK/STAT3 signaling. All gene expression outliers depicted in this figure were significant in all three comparisons: patient 1 versus all cancers, patient 1 versus lung adenocarcinomas, and patient 1 versus sarcomas. JAK1, the molecular target of ruxolitinib, is indicated with a yellow lightning bolt. TCGA, The Cancer Genome Atlas.

References

    1. Mody R.J, Prensner JR, Everett J, et al. : Precision medicine in pediatric oncology: Lessons learned and next steps. Pediatr Blood Cancer, 2016 - PMC - PubMed
    1. Zhang J, Benavente CA, McEvoy J, et al. : A novel retinoblastoma therapy from genomic and epigenetic analyses. Nature 481:329-334, 2012 - PMC - PubMed
    1. Laskin J, Jones S, Aparicio S, et al. : Lessons learned from the application of whole-genome analysis to the treatment of patients with advanced cancers. Cold Spring Harb Mol Case Stud 1:a000570, 2015 - PMC - PubMed
    1. Alimova I, Ng J, Harris P, et al. : MPS1 kinase as a potential therapeutic target in medulloblastoma. Oncol Rep 36:2633-2640, 2016 - PMC - PubMed
    1. Le Rhun E, Chamberlain MC, Zairi F, et al. : Patterns of response to crizotinib in recurrent glioblastoma according to ALK and MET molecular profile in two patients. CNS Oncol 4:381-386, 2015 - PMC - PubMed