. 2019 Sep 19;47(16):8606-8619.
doi: 10.1093/nar/gkz664.

Extensive transcriptional responses are co-ordinated by microRNAs as revealed by Exon-Intron Split Analysis (EISA)

Affiliations

Extensive transcriptional responses are co-ordinated by microRNAs as revealed by Exon-Intron Split Analysis (EISA)

Katherine A Pillman et al. Nucleic Acids Res. .

Abstract

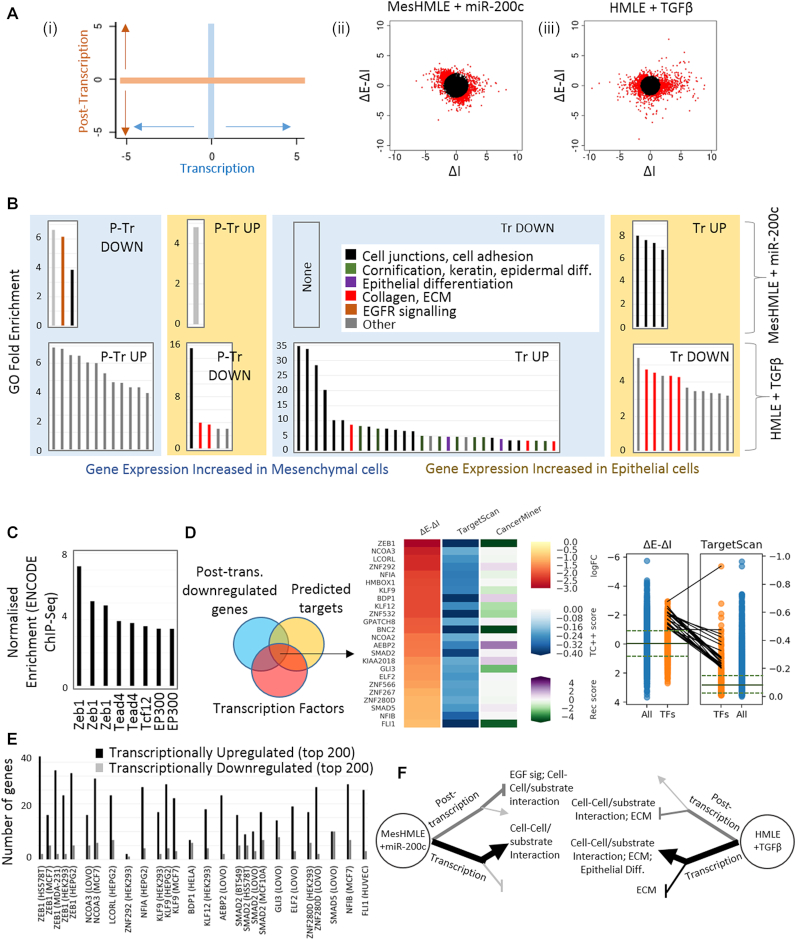
Epithelial-mesenchymal transition (EMT) has been a subject of intense scrutiny as it facilitates metastasis and alters drug sensitivity. Although EMT-regulatory roles for numerous miRNAs and transcription factors are known, their functions can be difficult to disentangle, in part due to the difficulty in identifying direct miRNA targets from complex datasets and in deciding how to incorporate 'indirect' miRNA effects that may, or may not, represent biologically relevant information. To better understand how miRNAs exert effects throughout the transcriptome during EMT, we employed Exon-Intron Split Analysis (EISA), a bioinformatic technique that separates transcriptional and post-transcriptional effects through the separate analysis of RNA-Seq reads mapping to exons and introns. We find that in response to the manipulation of miRNAs, a major effect on gene expression is transcriptional. We also find extensive co-ordination of transcriptional and post-transcriptional regulatory mechanisms during both EMT and mesenchymal to epithelial transition (MET) in response to TGF-β or miR-200c respectively. The prominent transcriptional influence of miRNAs was also observed in other datasets where miRNA levels were perturbed. This work cautions against a narrow approach that is limited to the analysis of direct targets, and demonstrates the utility of EISA to examine complex regulatory networks involving both transcriptional and post-transcriptional mechanisms.


Figures

Figure 1.
Figure 1.
EISA effectively delineates transcriptional and post-transcriptional gene regulation. (A) The top 5% up- and down-regulated genes were ranked according to the degree of transcriptional (ΔI) regulation after miR-200c-driven mesenchymal to epithelial transition. The relative enrichment of markers of active (H3K4me3, H3K9-14ac, H3K27ac – green) and inactive (H3K27me3 – red) chromatin from ChIP-Seq is shown for each gene in the plot. The red/green shading shows the mean of these measurements in a sliding window across 25 genes (plotting every 5th window). (B) As for (A), except that genes are ranked according to ΔE – ΔI, and only for genes with little evidence of transcriptional regulation (ΔI <0.5). (C) EISA was used to plot genes that are responsive to miR-200c on a ΔI:ΔE axis. Genes are coloured according to the strength of their direct miR-200c target (TargetScan) prediction; the deeper the red colour, the stronger the prediction. (D) Cumulative distribution of gene expression fold changes in response to miR-200c expression in MesHMLE cells as determined by (i) ΔExon, (ii) ΔExon-ΔIntron and (iii) ΔIntron (for genes with small ΔE – ΔI <0.5), genes are subcategorised according to whether they are predicted to contain miR-200c target site(s) of the specified length (6-8mers) and number (0 to >3 sites). Pairwise Kolmogorov–Smirnov (K–S) statistical tests (Supplementary Table S2) demonstrate that genes possessing longer or more target sites are progressively more repressed after miR-200c expression when assessed by ΔExon or ΔExon-ΔIntron, but not ΔIntron. EISA (ΔExon – ΔIntron) further enhances statistical significance compared to RNA-Seq (ΔExon).
Figure 2.
Figure 2.
miR-200c directly co-ordinately regulates an EGF signalling network. (A) Putative direct miR-200c target genes were defined as genes in the top 1000 of all negatively post-transcriptionally regulated genes (ΔE – ΔI) that are also in the top 1000 of all predicted miR-200c targets (by TargetScan or microT-CDS). The 10 highest fold enrichments over background for the top ranking gene ontologies are indicated. Black columns represent alternate entries for the EGFR signalling pathway within the GoPanther Gene Ontology database. (B) Overlap between the 1000, 500 and 200 most post-transcriptionally downregulated genes in response to miR-200c and all miR-200c targets that are predicted by both the targetscan and microT-CDS algorithms. (C) 3′UTR-luciferase reporter assays for representative putative miR-200c targets within the EGF signalling network indicate multi-component targeting. Black bars indicate transfection of a control miRNA sequence. Gray bars indicate miR-200c co-transfection. Error bars represent standard deviation, * denote significant (P< 0.05) downregulation of the reporter in response to miR-200c as calculated by t-test. (D) Network representation of miR-200c target genes (shaded blue) within the signalling network downstream of the EGFR. Major signalling pathways leading to AKT (blue outline) and ERK (red outline) activation are adapted from KEGG pathway #04012. Edges connecting nodes represent protein-protein interactions (PPI) from the Integrated Interactions Database (IID) that are supported by experimental evidence. Darker blue shading indicates targets that were more strongly suppressed in 3′UTR luciferase assays. (E) MesHMLE cells were stimulated with EGF and the activation of EGFR, AKT, MEK and ERK (or total protein) were assessed by western blotting in the presence or absence of miR-200c expression.
Figure 3.
Figure 3.
miR-200c and TGFβ co-ordinate a largely transcriptional response during EMT/MET (A). (i) ΔE – ΔI (post-transcription) was graphed against ΔI (transcription) to represent EISA-defined gene regulatory effects. Relative contributions of the two gene regulatory arms are shown after (ii) miR-200c expression in MesHMLE cells and (iii) TGFβ treatment of HMLEs. Red dots represent individual genes that were among the top 10% that were most regulated. The blacked out region represents the least changing 90% of genes. (B) Gene ontology (biological function) analyses were run on transcriptionally and post-transcriptionally up- and down-regulated genes in response to miR-200c and TGFβ. All ontologies with a fold enrichment over background >2 are shown. Colours represent functionally-related terms. To minimise ‘noisy’ enrichment of lowly-populated GO terms, as well as reducing the representation of very large and non-specific GO terms, all indicated GO terms possessed between 20 and 1500 genes and contained at least 5 GO-mapping genes within the gene list being interrogated. (C) Among transcriptionally upregulated genes, binding sites for mesenchymal-promoting transcription factors such as Zeb1 are enriched among ENCODE ChIP-Seq data (iRegulon) (33). Each bar represents an individual ChIP-Seq dataset. (D) TFs that are candidates to mediate downstream transcriptional changes are shown with their relative degree of post-transcriptional downregulation by miR-200c (ΔE – ΔI), the likelihood of their predicted targeting by miR-200c (TS) and the degree of their inversely correlated expression with miR-200c across breast cancer patients pooled from The Cancer Genome Atlas data (derived using CancerMiner (100)). Panel on right indicates the (ΔE - ΔI) and TS ranking of each of these TFs among all genes and all TFs. The solid line represents the median distribution relative to all genes. Dashed lines indicate upper and lower quartile distributions. (E) Number of genes among the top 200 most transcriptionally up- or down-regulated after miR-200 expression that are also identified within the top 1000 MACS-ranked peaks in human TF ChIP-Seq data (32). The cell line in which each experiment was performed is indicated. (F) Model for the co-ordinated regulatory processes underlying EMT/MET. Line depth and colour indicates relative extent of gene ontology enrichment.
Figure 4.
Figure 4.
Co-ordinated, coherent transcriptional responses are widespread in response to many miRNAs. (AB) The relative contributions of transcriptional and post-transcriptional mechanisms in response to the expression of ZEB1 or multiple individual miRNAs are shown by scatter plots (B) (ΔE – ΔI: ΔI) and quantitated in a bar histogram (A). The % gene expression change was calculated from among the top 10% of genes (red dots, B) that change in response to the miRNA in question. (C) Using the same GO-searching criteria described in Figure 3B, the 10 most enriched terms for each selected miRNA dataset are shown. Whether this is among transcriptionally up- or down-regulated genes are indicated.

References

    1. Osella M., Bosia C., Cora D., Caselle M.. The role of incoherent microRNA-mediated feedforward loops in noise buffering. PLoS Comput. Biol. 2011; 7:e1001101. - PMC - PubMed
    1. Riba A., Bosia C., El Baroudi M., Ollino L., Caselle M.. A combination of transcriptional and microRNA regulation improves the stability of the relative concentrations of target genes. PLoS Comput. Biol. 2014; 10:e1003490. - PMC - PubMed
    1. Siciliano V., Garzilli I., Fracassi C., Criscuolo S., Ventre S., di Bernardo D.. MiRNAs confer phenotypic robustness to gene networks by suppressing biological noise. Nat. Commun. 2013; 4:2364. - PMC - PubMed
    1. Zhang H., Chen Y., Chen Y.. Noise propagation in gene regulation networks involving interlinked positive and negative feedback loops. PLoS One. 2012; 7:e51840. - PMC - PubMed
    1. Mukherji S., Ebert M.S., Zheng G.X., Tsang J.S., Sharp P.A., van Oudenaarden A.. MicroRNAs can generate thresholds in target gene expression. Nat. Genet. 2011; 43:854–859. - PMC - PubMed

Publication types

MeSH terms