

Prediction of models for ordered solvent in macromolecular structures by a classifier based upon resolution-independent projections of local feature data
- PMID: 31373570
- PMCID: PMC6677017
- DOI: 10.1107/S2059798319008933
Prediction of models for ordered solvent in macromolecular structures by a classifier based upon resolution-independent projections of local feature data
Abstract
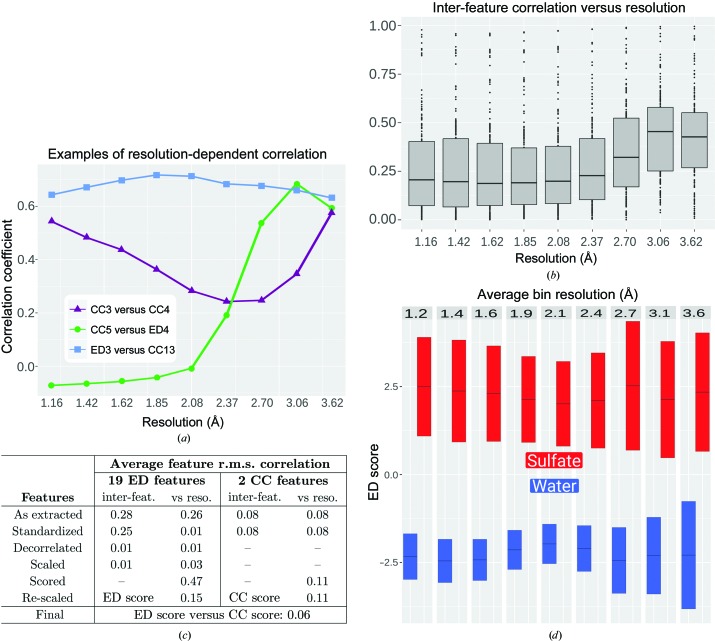
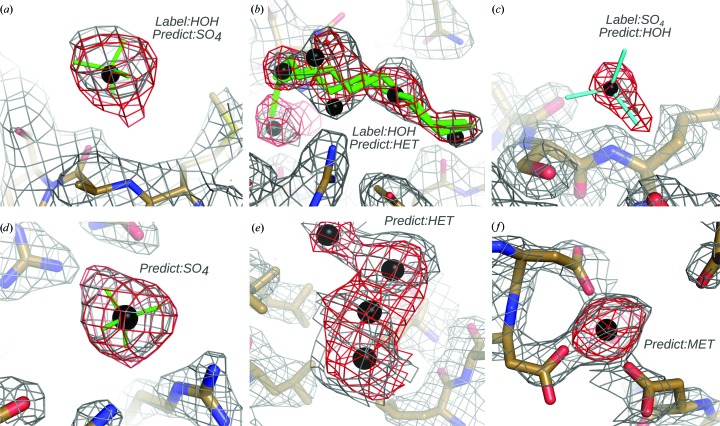
Current software tools for the automated building of models for macromolecular X-ray crystal structures are capable of assembling high-quality models for ordered macromolecule and small-molecule scattering components with minimal or no user supervision. Many of these tools also incorporate robust functionality for modelling the ordered water molecules that are found in nearly all macromolecular crystal structures. However, no current tools focus on differentiating these ubiquitous water molecules from other frequently occurring multi-atom solvent species, such as sulfate, or the automated building of models for such species. PeakProbe has been developed specifically to address the need for such a tool. PeakProbe predicts likely solvent models for a given point (termed a `peak') in a structure based on analysis (`probing') of its local electron density and chemical environment. PeakProbe maps a total of 19 resolution-dependent features associated with electron density and two associated with the local chemical environment to a two-dimensional score space that is independent of resolution. Peaks are classified based on the relative frequencies with which four different classes of solvent (including water) are observed within a given region of this score space as determined by large-scale sampling of solvent models in the Protein Data Bank. Designed to classify peaks generated from difference density maxima, PeakProbe also incorporates functionality for identifying peaks associated with model errors or clusters of peaks likely to correspond to multi-atom solvent, and for the validation of existing solvent models using solvent-omit electron-density maps. When tasked with classifying peaks into one of four distinct solvent classes, PeakProbe achieves greater than 99% accuracy for both peaks derived directly from the atomic coordinates of existing solvent models and those based on difference density maxima. While the program is still under development, a fully functional version is publicly available. PeakProbe makes extensive use of cctbx libraries, and requires a PHENIX licence and an up-to-date phenix.python environment for execution.
Keywords: PeakProbe; data mining; decorrelation; electron-density analysis; resolution; solvent modelling; supervised learning.
open access.
Figures


Similar articles
-
The solvent component of macromolecular crystals.Acta Crystallogr D Biol Crystallogr. 2015 May;71(Pt 5):1023-38. doi: 10.1107/S1399004715006045. Epub 2015 Apr 30. Acta Crystallogr D Biol Crystallogr. 2015. PMID: 25945568 Free PMC article. Review.
-
Polder maps: improving OMIT maps by excluding bulk solvent.Acta Crystallogr D Struct Biol. 2017 Feb 1;73(Pt 2):148-157. doi: 10.1107/S2059798316018210. Epub 2017 Feb 1. Acta Crystallogr D Struct Biol. 2017. PMID: 28177311 Free PMC article.
-
Difference density quality (DDQ): a method to assess the global and local correctness of macromolecular crystal structures.Acta Crystallogr D Biol Crystallogr. 1999 Jan;55(Pt 1):206-18. doi: 10.1107/S0907444998007161. Epub 1999 Jan 1. Acta Crystallogr D Biol Crystallogr. 1999. PMID: 10089411
-
Iterative model building, structure refinement and density modification with the PHENIX AutoBuild wizard.Acta Crystallogr D Biol Crystallogr. 2008 Jan;64(Pt 1):61-9. doi: 10.1107/S090744490705024X. Epub 2007 Dec 5. Acta Crystallogr D Biol Crystallogr. 2008. PMID: 18094468 Free PMC article.
-
Interactive model building in neutron macromolecular crystallography.Methods Enzymol. 2020;634:201-224. doi: 10.1016/bs.mie.2019.11.017. Epub 2019 Dec 20. Methods Enzymol. 2020. PMID: 32093833 Review.
References
-
- Adams, P. D., Afonine, P. V., Bunkóczi, G., Chen, V. B., Davis, I. W., Echols, N., Headd, J. J., Hung, L.-W., Kapral, G. J., Grosse-Kunstleve, R. W., McCoy, A. J., Moriarty, N. W., Oeffner, R., Read, R. J., Richardson, D. C., Richardson, J. S., Terwilliger, T. C. & Zwart, P. H. (2010). Acta Cryst. D66, 213–221. - PMC - PubMed
-
- Akker, F. van den & Hol, W. G. J. (1999). Acta Cryst. D55, 206–218. - PubMed
-
- Amadasi, A., Surface, J. A., Spyrakis, F., Cozzini, P., Mozzarelli, A. & Kellogg, G. E. (2008). J. Med. Chem. 51, 1063–1067. - PubMed
MeSH terms
Substances
LinkOut - more resources
Full Text Sources
