. 2020 Jan 15;36(2):364-372.
doi: 10.1093/bioinformatics/btz612.

Predicting the effects of SNPs on transcription factor binding affinity

Affiliations

Predicting the effects of SNPs on transcription factor binding affinity

Sierra S Nishizaki et al. Bioinformatics. .

Abstract

Motivation: Genome-wide association studies have revealed that 88% of disease-associated single-nucleotide polymorphisms (SNPs) reside in noncoding regions. However, noncoding SNPs remain understudied, partly because they are challenging to prioritize for experimental validation. To address this deficiency, we developed the SNP effect matrix pipeline (SEMpl).

Results: SEMpl estimates transcription factor-binding affinity by observing differences in chromatin immunoprecipitation followed by deep sequencing signal intensity for SNPs within functional transcription factor-binding sites (TFBSs) genome-wide. By cataloging the effects of every possible mutation within the TFBS motif, SEMpl can predict the consequences of SNPs to transcription factor binding. This knowledge can be used to identify potential disease-causing regulatory loci.

Availability and implementation: SEMpl is available from https://github.com/Boyle-Lab/SEM_CPP.

Supplementary information: Supplementary data are available at Bioinformatics online.


Figures

Fig. 1.
Fig. 1.
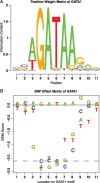
PWM versus SEM of transcription factor GATA1. (A) The PWM can be read as likely nucleotides along a transcriptions factor’s motif. (B) Similarly, the SEM can be read as nucleotides along a motif, but with additional information about the effect any given SNP may have on transcription factor-binding affinity. The solid gray line represents endogenous binding, the dashed gray line represents a scrambled background. We define anything above the solid gray line as predicted to increase binding on average, anything between the two lines as decreasing average binding and anything falling below the dashed gray line as ablating binding on average
Fig. 2.
Fig. 2.
SEM methods pipeline. (A) All kmers with a PWM score below the TFM-PVALUE are generated for a single transcription factor. (B) All possible SNPs are introduced in silico for each kmer. (C) All enumerated kmers are then aligned to the genome, and filtered for regions of open chromatin by DNase-seq. The average ChIP-seq scores are then calculated for each alignment (dashed line represents endogenous binding, dotted line represents scrambled background). (D) Final SEM scores are log2 transformed and normalized to the average binding score of the original kmers (solid gray line). A scrambled baseline, representing the binding score of randomly scrambled kmers of the same length is also added (dashed gray line). Once a SEM score is calculated, the output can be used to generate a new PWM. This iterative process can correct for disparities introduced by the use of different starting PWMs. The HepG2 cell line data were used for the ChIP-seq and DNase data for HNF4a
Fig. 3.
Fig. 3.
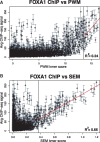
SEMs show a better correlation with whole kmer ChIP-seq signal (B, R2 = 0.66) than PWMs (A, R2 = 0.24). The line dividing the plot represents a standard cutoff for PWM visualization (P-value = 4−8). Coefficient of determinations (R2) were calculated to the right of the vertical lines, representing the TFM-PVALUE cutoff for PWMs and the average scrambled background cutoff for SEMs (0.36 for FOXA1). SEM values are displayed as 2n for visualization purposes. PWM values only shown >0, a full plot can be found in Supplementary Figure S3
Fig. 4.
Fig. 4.
Different ChIP-seq input produce similar SEMs. The top right half of the table shows a least square regression analysis which reveals that FOXA1 SEMs are highly correlated across four cell types and one pair of biological replicates with correlations between samples ranging from R2 =0.86 and R2 = 1. The bottom left half of the table shows overlapping DNase peaks between cell types. A549, lung carcinoma cell line; HepG2, hepatocellular carcinoma cell line; T47D, breast tumor cell line; MCF-7, breast adenocarcinoma cell line
Fig. 5.
Fig. 5.
SEMs reflect allele-specific CTCF-binding patterns. Linear regression reveals a higher correlation between SEM score change and binding affinity change in two alleles of heterozygous sites (R2 = 0.50) than PWM scores (R2 = 0.41). Allele-binding affinity change was measured by allelic ratio, which is the ratio between CTCF ChIP-seq read counts from maternal allele and total read counts from two alleles. Allele-specific binding sites (red/light gray points) generally have larger changes on SEM scores. (Color version of this figure is available at Bioinformatics online.)
Fig. 6.
Fig. 6.
SEMpl scores agree with in vitro transcription factor-binding results. (A) Electrophoretic mobility shift assay (EMSA) for CTCF correlated to SEMpl and PWM predictions. Correlations are calculated without the inclusion of the genomic and scrambled controls (black points). Additional colors correspond to the SNP change made to the variable region. (B) FoxA1 EMSA data from Levitsky et al. correlated to PWM, SEM, DeepBind and LS-GKM predictions (Levitsky et al., 2014)
Fig. 7.
Fig. 7.
Performance comparison of SEMpl to other noncoding SNP prediction methods. Predictions for 13 TFs were generated using PWM (A), SEM, DeepBind (B), and LS-GKM (C) and compared to the average ChIP-seq score for the analogous kmer sequence. Correlations for each transcription factor were then compared across methods. SEMpl produced better or comparable correlations for 9/13 transcription factors tested. PWMs performed better for EGR1 and MEFF2A, and DeepBind performed best for FOXA2. All methods performed poorly for HNF4. The colors/shades of gray of points are unique to each transcription factor. (Color version of this figure is available at Bioinformatics online.)

References

    1. Aghera N. et al. (2011) Equilibrium unfolding studies of monellin: the double-chain variant appears to be more stable than the single-chain variant. Biochemistry, 50, 2434–2444. - PubMed
    1. Alipanahi B. et al. (2015) Predicting the sequence specificities of DNA- and RNA-binding proteins by deep learning. Nat. Biotechnol., 33, 831–838. - PubMed
    1. Andersen M.C. et al. (2008) In silico detection of sequence variations modifying transcriptional regulation. PLoS Comput. Biol., 4, e5.. - PMC - PubMed
    1. Bailey S.D. et al. (2015) ZNF143 provides sequence specificity to secure chromatin interactions at gene promoters. Nat. Commun, 6, 6186–6194. - PMC - PubMed
    1. Barenboim M., Manke T. (2013) ChroMoS: an integrated web tool for SNP classification, prioritization and functional interpretation. Bioinformatics, 29, 2197–2198. - PMC - PubMed

Publication types

Substances