

Reappraising the utility of Google Flu Trends
- PMID: 31374088
- PMCID: PMC6693776
- DOI: 10.1371/journal.pcbi.1007258
Reappraising the utility of Google Flu Trends
Abstract
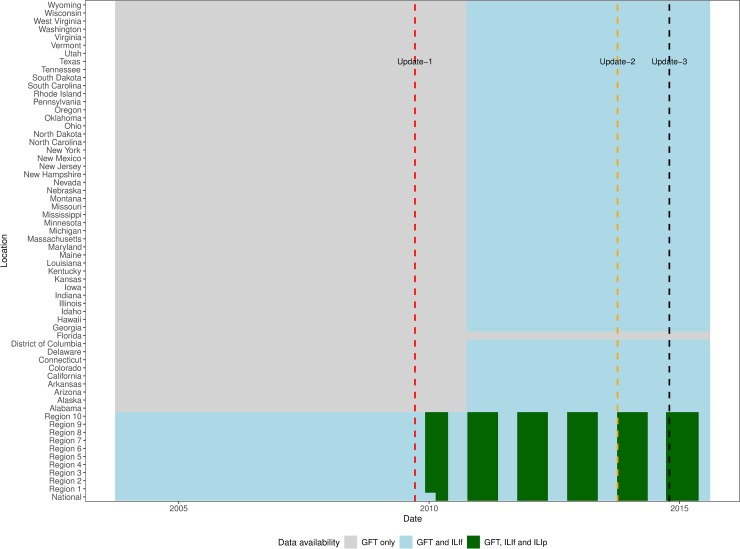
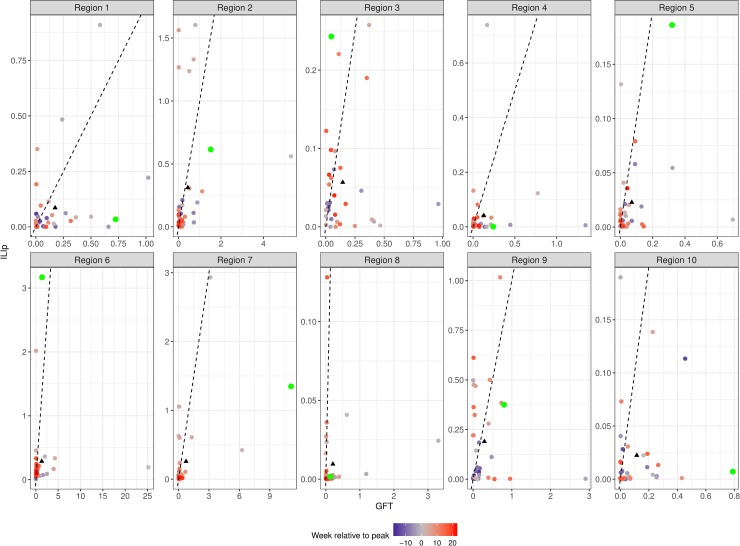
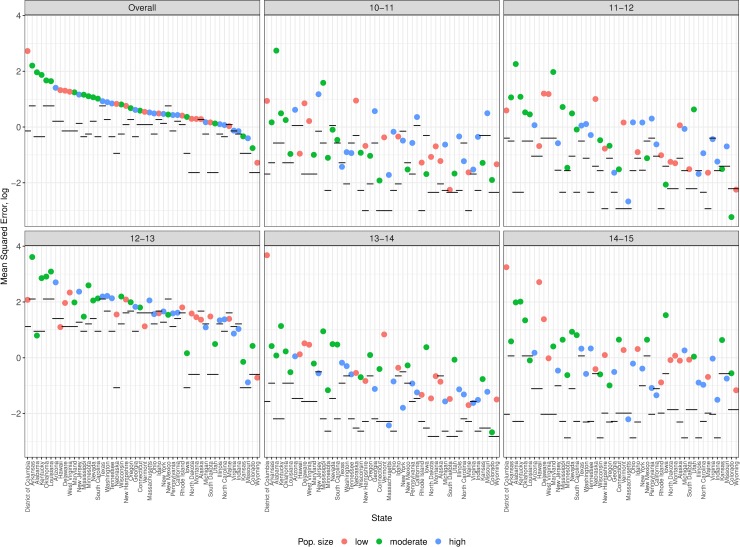
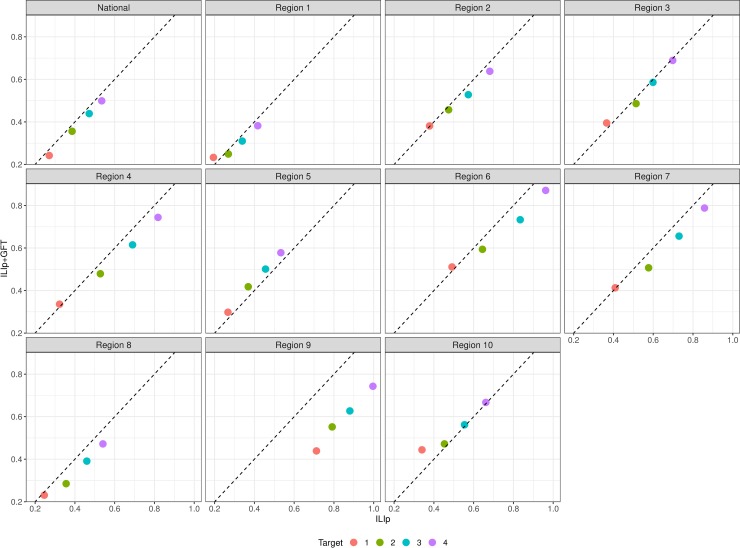
Estimation of influenza-like illness (ILI) using search trends activity was intended to supplement traditional surveillance systems, and was a motivation behind the development of Google Flu Trends (GFT). However, several studies have previously reported large errors in GFT estimates of ILI in the US. Following recent release of time-stamped surveillance data, which better reflects real-time operational scenarios, we reanalyzed GFT errors. Using three data sources-GFT: an archive of weekly ILI estimates from Google Flu Trends; ILIf: fully-observed ILI rates from ILINet; and, ILIp: ILI rates available in real-time based on partial reporting-five influenza seasons were analyzed and mean square errors (MSE) of GFT and ILIp as estimates of ILIf were computed. To correct GFT errors, a random forest regression model was built with ILI and GFT rates from the previous three weeks as predictors. An overall reduction in error of 44% was observed and the errors of the corrected GFT are lower than those of ILIp. An 80% reduction in error during 2012/13, when GFT had large errors, shows that extreme failures of GFT could have been avoided. Using autoregressive integrated moving average (ARIMA) models, one- to four-week ahead forecasts were generated with two separate data streams: ILIp alone, and with both ILIp and corrected GFT. At all forecast targets and seasons, and for all but two regions, inclusion of GFT lowered MSE. Results from two alternative error measures, mean absolute error and mean absolute proportional error, were largely consistent with results from MSE. Taken together these findings provide an error profile of GFT in the US, establish strong evidence for the adoption of search trends based 'nowcasts' in influenza forecast systems, and encourage reevaluation of the utility of this data source in diverse domains.
Conflict of interest statement
JS and Columbia University declare partial ownership in SK Analytics. SK was a consultant to SK Analytics.
Figures
Similar articles
-
Subregional Nowcasts of Seasonal Influenza Using Search Trends.J Med Internet Res. 2017 Nov 6;19(11):e370. doi: 10.2196/jmir.7486. J Med Internet Res. 2017. PMID: 29109069 Free PMC article.
-
Improving Google Flu Trends estimates for the United States through transformation.PLoS One. 2014 Dec 31;9(12):e109209. doi: 10.1371/journal.pone.0109209. eCollection 2014. PLoS One. 2014. PMID: 25551391 Free PMC article.
-
Using Google Flu Trends data in forecasting influenza-like-illness related ED visits in Omaha, Nebraska.Am J Emerg Med. 2014 Sep;32(9):1016-23. doi: 10.1016/j.ajem.2014.05.052. Epub 2014 Jun 12. Am J Emerg Med. 2014. PMID: 25037278
-
A review of influenza detection and prediction through social networking sites.Theor Biol Med Model. 2018 Feb 1;15(1):2. doi: 10.1186/s12976-017-0074-5. Theor Biol Med Model. 2018. PMID: 29386017 Free PMC article. Review.
-
Forecasting and Surveillance of COVID-19 Spread Using Google Trends: Literature Review.Int J Environ Res Public Health. 2022 Sep 29;19(19):12394. doi: 10.3390/ijerph191912394. Int J Environ Res Public Health. 2022. PMID: 36231693 Free PMC article. Review.
Cited by
-
How the ecology and evolution of the COVID-19 pandemic changed learning.Ecol Evol. 2020 Oct 29;10(22):12412-12417. doi: 10.1002/ece3.6937. eCollection 2020 Nov. Ecol Evol. 2020. PMID: 33250980 Free PMC article.
-
Online Public Attention During the Early Days of the COVID-19 Pandemic: Infoveillance Study Based on Baidu Index.JMIR Public Health Surveill. 2020 Oct 22;6(4):e23098. doi: 10.2196/23098. JMIR Public Health Surveill. 2020. PMID: 32960177 Free PMC article.
-
The impact of the pandemic declaration on public awareness and behavior: Focusing on COVID-19 google searches.Technol Forecast Soc Change. 2021 May;166:120592. doi: 10.1016/j.techfore.2021.120592. Epub 2021 Jan 13. Technol Forecast Soc Change. 2021. PMID: 33776154 Free PMC article.
-
Population Interest in Information on Obesity, Nutrition, and Occupational Health and Its Relationship with the Prevalence of Obesity: An Infodemiological Study.Nutrients. 2023 Aug 29;15(17):3773. doi: 10.3390/nu15173773. Nutrients. 2023. PMID: 37686805 Free PMC article.
-
Global Preparedness Against COVID-19: We Must Leverage the Power of Digital Health.JMIR Public Health Surveill. 2020 Apr 16;6(2):e18980. doi: 10.2196/18980. JMIR Public Health Surveill. 2020. PMID: 32297868 Free PMC article.
References
-
- Dredze M, Cheng R, Paul MJ, Broniatowski D, editors. HealthTweets. org: a platform for public health surveillance using Twitter. AAAI Workshop on the World Wide Web and Public Health Intelligence; 2014.
-
- Farrow D. Modeling the Past, Present, and Future of Influenza [Doctoral dissertation]: Carnegie Mellon University; 2016.
Publication types
MeSH terms
LinkOut - more resources
Full Text Sources
Medical
