. 2019 Aug 2;14(8):e0220742.
doi: 10.1371/journal.pone.0220742. eCollection 2019.

Exploring induced pluripotency in human fibroblasts via construction, validation, and application of a gene regulatory network

Affiliations

Exploring induced pluripotency in human fibroblasts via construction, validation, and application of a gene regulatory network

Mehdi B Hamaneh et al. PLoS One. .

Abstract

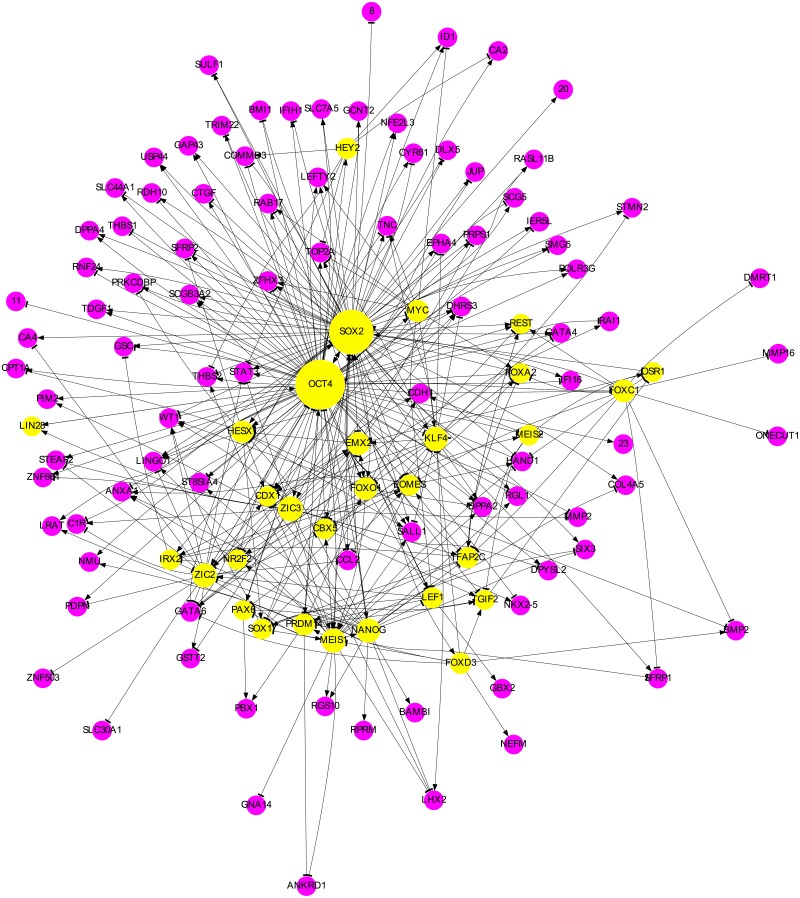
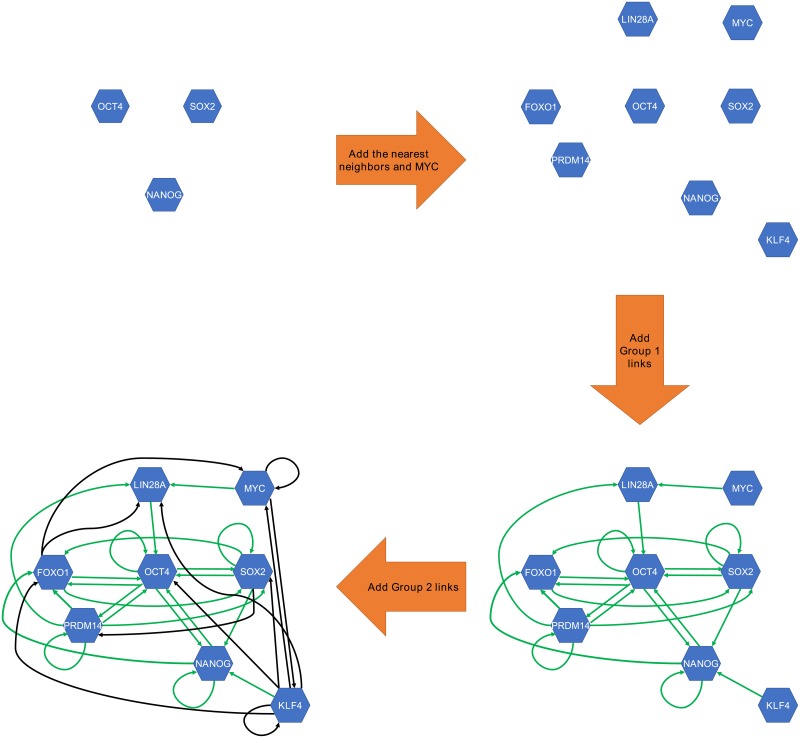
Reprogramming of somatic cells to induced pluripotent stem cells, by overexpressing certain factors referred to as the reprogramming factors, can revolutionize regenerative medicine. To provide a coherent description of induced pluripotency from the gene regulation perspective, we use 35 microarray datasets to construct a reprogramming gene regulatory network. Comprising 276 nodes and 4471 links, the resulting network is, to the best of our knowledge, the largest gene regulatory network constructed for human fibroblast reprogramming and it is the only one built using a large number of experimental datasets. To build the network, a model that relates the expression profiles of the initial (fibroblast) and final (induced pluripotent stem cell) states is proposed and the model parameters (link strengths) are fitted using the experimental data. Twenty nine additional experimental datasets are collectively used to test the model/network, and good agreement between experimental and predicted gene expression profiles is found. We show that the model in conjunction with the constructed network can make useful predictions. For example, we demonstrate that our approach can incorporate the effect of reprogramming factor stoichiometry and that its predictions are consistent with the experimentally observed trends in reprogramming efficiency when the stoichiometric ratios vary. Using our model/network, we also suggest new (not used in training of the model) candidate sets of reprogramming factors, many of which have already been experimentally verified. These results suggest our model/network can potentially be used in devising new recipes for induced pluripotency with higher efficiencies. Additionally, we classify the links of the network into three classes of different importance, prioritizing them for experimental verification. We show that many of the links in the top ranked class are experimentally known to be important in reprogramming. Finally, comparing with other methods, we show that using our model is advantageous.


Conflict of interest statement

The authors have declared that no competing interests exist.

Figures

Fig 1
Fig 1. Effect of stoichiometry.
For different stoichiometric ratios (O:S:K:M) ρ(x), defined in Eq 10, are plotted. Here x is the relative decrease or increase in the level of one of the RFs while those of the rest of the RFs remain unchanged. A positive (negative) ρ is suggestive of a higher/lower IP efficiency.
Fig 2
Fig 2. Effect of stoichiometry if the subnetworks are used.
For different stoichiometric ratios (O:S:K:M) ρ, defined in Eq 10, are plotted as a function of x for (A) SUBN1, (B) SUBN2, (C) C1C3, and (D) C2C3. Here x is the relative decrease or increase in the level of one of the RFs while those of the rest of the RFs remain unchanged. Ck denotes the set of links in Class k (see text for definition). SUBN1 and SUBN2 are the two subnetworks comprising links in C1 and C1C2, respectively. A positive (negative) ρ is suggestive of a higher/lower IP efficiency.
Fig 3
Fig 3. Link distribution in different classes.
The distribution of the number of outgoing links per node is shown for (A) WN, (B) C3, (C) C2, and (D) C1, where Ck denotes the set of links in Class k (see the text for the definition of the link classes). The figure indicates that the distributions of links in C2 (panel C) and C1 (panel D) are much more non-uniform in comparison with that of links in C3. In C1 and C2 OCT4 and SOX2 have the largest number of outgoing links. The gap between these two TFs and others is especially large in C1 (panel D), indicating the importance of OCT4 and SOX2 in C1.
Fig 4
Fig 4. The SUBN1 network.
The regulating nodes are shown as yellow circles whose radii increase linearly with the number of outgoing links. In magenta are the nodes that, in this subnetwork, do not regulate other nodes. Each magenta node that has only a numeric label k represents a collection of k nodes regulated in the same way. A “tee” arrowhead denotes downregulation, while a “normal” one indicates upregulation. If two nodes mutually regulate each other, only one link is shown with an arrowhead at each end.
Fig 5
Fig 5. Comparing the two methods.
The average correlation r, and goodness of fit G are plotted as functions of number of links using both our method (in blue) and Zhana’s (in red). Note that SUBN2 and ZN1075 have almost the same number of links (1078 and 1075 respectively) and give almost identical results, and so the blue symbols are on top of the red ones.
Fig 6
Fig 6. Construction of the starting network.
Using a small representative subset of nodes, the figure explains how the starting network was constructed. We started from OCT4, SOX2, and NANOG and built the network around these TFs by adding their experimentally verified direct targets and regulators and MYC (see the text for details). We then connected the nodes of the network by adding regulatory links in two steps. First, the experimentally verified links (Group 1; colored in green) were added. These included the links between OCT4/SOX2/NANOG and their targets/regulators as well as other experimentally verified links that we found. We then added a large number of inferred links (Group 2; colored in black) based on a database developed by Marbach et al. [42].

Similar articles

Cited by

References

    1. Takahashi K, Yamanaka S. Induction of pluripotent stem cells from mouse embryonic and adult fibroblast cultures by defined factors. Cell. 2006;126(4):663–676. 10.1016/j.cell.2006.07.024 - DOI - PubMed
    1. Takahashi K, Tanabe K, Ohnuki M, Narita M, Ichisaka T, Tomoda K, et al. Induction of pluripotent stem cells from adult human fibroblasts by defined factors. Cell. 2007;131(5):861–872. 10.1016/j.cell.2007.11.019 - DOI - PubMed
    1. Yu J, Vodyanik MA, Smuga-Otto K, Antosiewicz-Bourget J, Frane JL, Tian S, et al. Induced pluripotent stem cell lines derived from human somatic cells. Science. 2007;318(5858):1917–1920. 10.1126/science.1151526 - DOI - PubMed
    1. Boyer LA, Lee TI, Cole MF, Johnstone SE, Levine SS, Zucker JP, et al. Core transcriptional regulatory circuitry in human embryonic stem cells. Cell. 2005;122(6):947–956. 10.1016/j.cell.2005.08.020 - DOI - PMC - PubMed
    1. Takahashi K, Yamanaka S. A decade of transcription factor-mediated reprogramming to pluripotency. Nat Rev Mol Cell Biol. 2016;17(3):183–193. 10.1038/nrm.2016.8 - DOI - PubMed

Publication types

MeSH terms