. 2019 Aug 1;25(2):273-289.e5.
doi: 10.1016/j.stem.2019.07.007.

Modeling Monogenic Diabetes using Human ESCs Reveals Developmental and Metabolic Deficiencies Caused by Mutations in HNF1A

Affiliations

Modeling Monogenic Diabetes using Human ESCs Reveals Developmental and Metabolic Deficiencies Caused by Mutations in HNF1A

Fabian L Cardenas-Diaz et al. Cell Stem Cell. .

Abstract

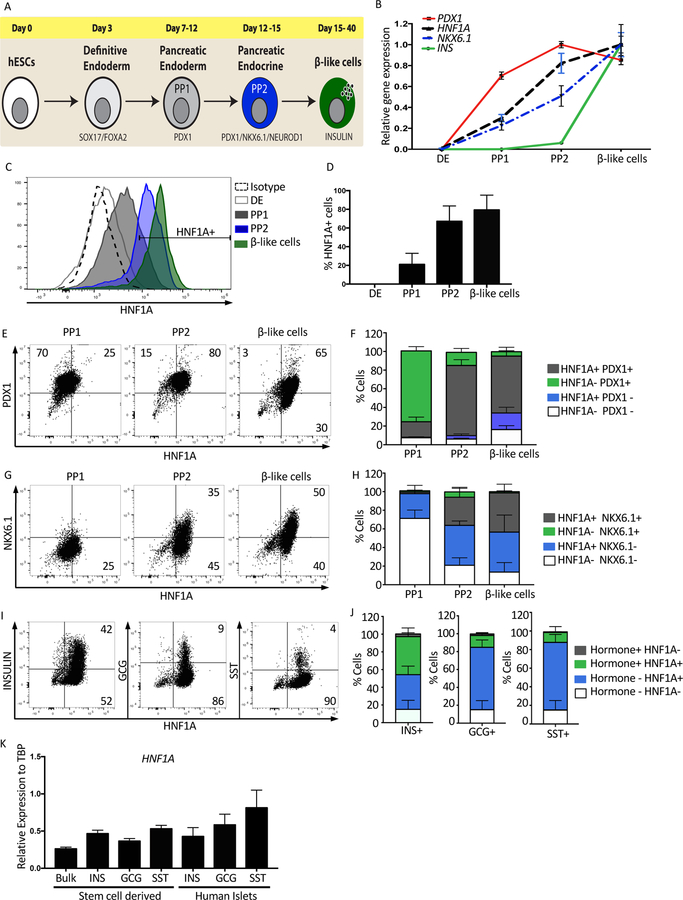
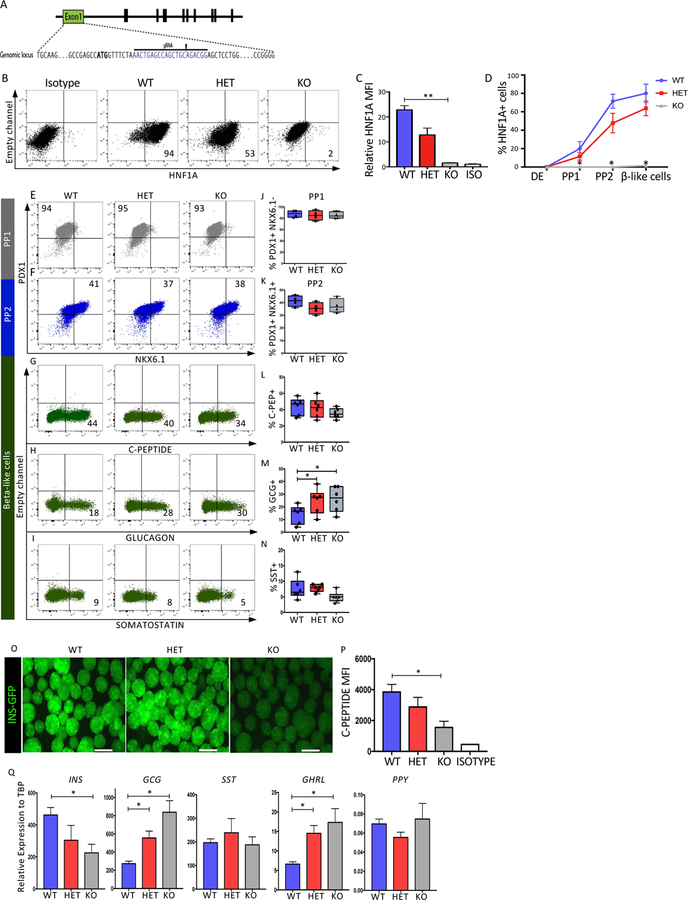
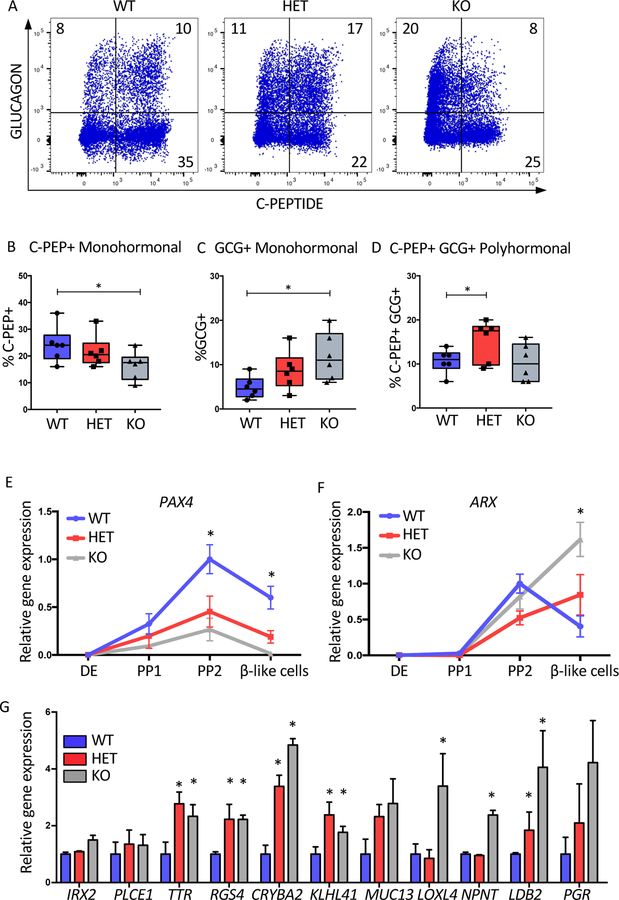
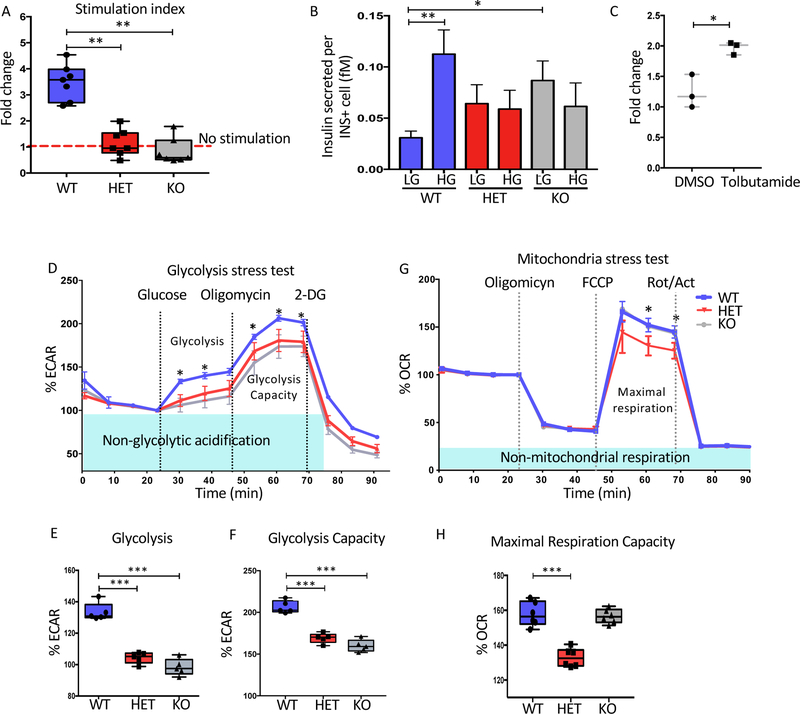
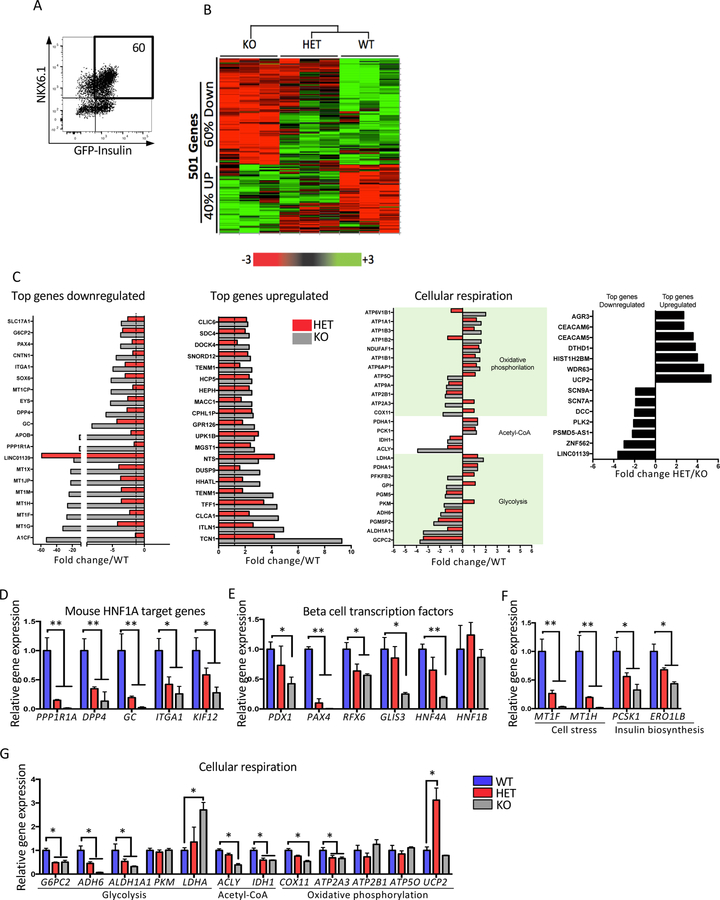
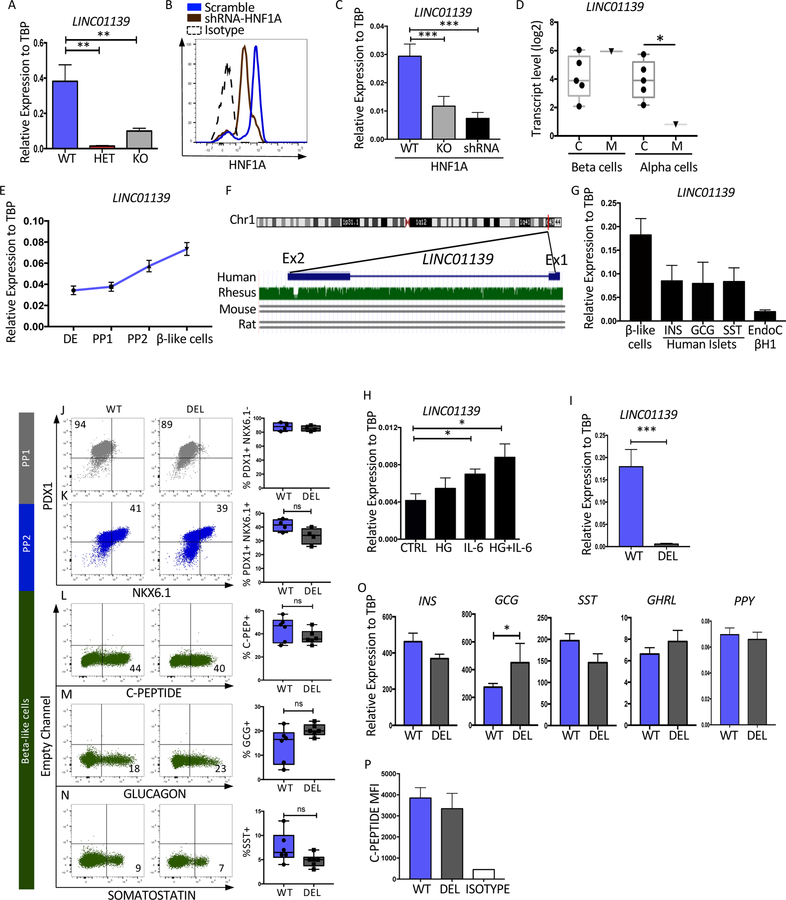
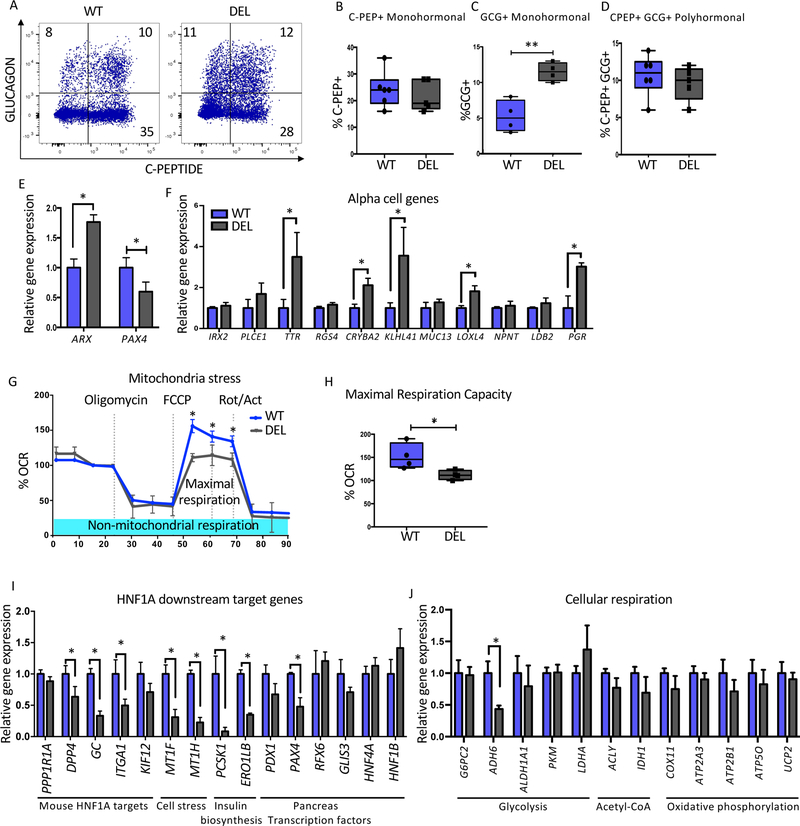
Human monogenic diabetes, caused by mutations in genes involved in beta cell development and function, has been a challenge to study because multiple mouse models have not fully recapitulated the human disease. Here, we use genome edited human embryonic stem cells to understand the most common form of monogenic diabetes, MODY3, caused by mutations in the transcription factor HNF1A. We found that HNF1A is necessary to repress an alpha cell gene expression signature, maintain endocrine cell function, and regulate cellular metabolism. In addition, we identified the human-specific long non-coding RNA, LINKA, as an HNF1A target necessary for normal mitochondrial respiration. These findings provide a possible explanation for the species difference in disease phenotypes observed with HNF1A mutations and offer mechanistic insights into how the HNF1A gene may also influence type 2 diabetes.

Keywords: HNF1A; MODY3; beta cells; cell respiration; diabetes; embryonic stem cells; glycolysis; long non-coding RNA; pancreas.


Conflict of interest statement

Declaration of interest

The authors declare no conflict of interest.

Figures

Figure 1:
Figure 1:. HNF1A expression during the generation of beta-like cells in vitro.
Mel1 ESCs were differentiated into pancreatic endocrine cells and analyzed as described below. (A) Schematic representation of the protocol used to derive beta-like cells from ESCs. (B) Relative mRNA expression quantified by qRT-PCR. Time-course quantification to determine the expression kinetics of HNF1A compared to PDX1, NKX6.1 and INS during pancreas differentiation (n=3 per sample). (C) Intracellular flow cytometry of HNF1A protein during pancreas differentiation. Definitive endoderm (DE), pancreas progenitor 1 (PP1), pancreas progenitor 2 (PP2) and beta-like cells (n=4 per cell line). (D) Quantification of HNF1A expressing cell population (percentage) during pancreas differentiation in C (n=4 per cell line). (E) Flow cytometry plots of HNF1A versus PDX1 at PP1, PP2 and beta-like cell stages (n=4 per cell line). (F) Cell quantification for PDX1 and HNF1A cell populations in E (n=4 per cell line). (G) Flow cytometry plots of HNF1A versus NKX6.1 at PP1, PP2 and beta-like cell stages (n=4 per cell line). (H) Cell quantification for NKX6.1 and HNF1A cell populations in G (n=4 per cell line). (I) Flow cytometry plots of end stage differentiation cultures, examining expression of pancreatic hormones Insulin (INS), Glucagon (GCG) and Somatostatin (SST) with HNF1A (n=4 per cell line). (J) Cell quantification for pancreatic hormones INS, GCG and SST with HNF1A in I (n=4 per cell line). (K) Relative HNF1A mRNA expression in bulk and hormone sorted cells from in vitro differentiation of stem cells compared to human islets sorted for pancreatic hormones INS, SST or GCG (n=3 per sample). See also Figure S1.
Figure 2:
Figure 2:. Deficiency of HNF1A influences pancreatic hormone expression.
Mel1 ESCs were genome edited and examined as described below. (A) CRISPR-CAS9 based strategy to generate HNF1A heterozygous (HET) and Knock-out (KO) ESCs. ATG is bold and gRNA highlighted. (B–C) Representative intracellular flow cytometric analysis of HNF1A performed at beta-like cell stage using the HNF1A allelic series (n=3 per cell line). (B) Representative dot plots of HNF1A expression. (C) Quantification of HNF1A by mean fluorescence intensity (MFI) from B. (D) Quantification of the HNF1A cell population (percentage) during pancreatic differentiation (n=3 per cell line). (E–N) Flow cytometry quantification of specific proteins during pancreatic differentiation using HNF1A WT, HET, and KO lines. (E,J) Quantification of PDX1+ cells at PP1 (n=4 per genotype). (F,K) Quantification of PDX1+ NKX6.1+ cells at PP2 (n=4 per genotype). (G,L) Quantification of C-peptide+ cells at end stage differentiation (n=6 per genotype). (H,M) Quantification of glucagon+ cells at end stage differentiation (n=6 per genotype). (I,N) Quantification of somatostatin+ cells at end stage differentiation (n=6 per genotype). (O) Fluorescence microscopy at end stage of differentiation showing INS-GFP fluorescence in the HNF1A allelic series (bar size 300µM)(n=3 per sample). (P) Quantification of C-Peptide MFI at end stage differentiation of beta-like cells from G (n=3 per sample). (Q) qRT-PCR quantification for pancreatic hormones INS, GCG, SST and GHRL at the end of pancreatic differentiation in bulk cells (n=3 per sample). For all statistical analyses: * P<0.05, **P<0.01. See also Figure S2.
Figure 3:
Figure 3:. Ablation of HNF1A drives pancreatic endocrine differentiation toward cells with a more alpha cell gene expression signature.
Mel1 HNF1A WT, HET and KO ESCs were differentiated into pancreatic endocrine cells and analyzed as described below. (A) Flow cytometry of C-Peptide versus GLUCAGON at the end stage differentiation cultures (n=6 per sample). (B–D) Quantification of pancreatic hormone expressing cells from A (n=6 per sample). (B) C-Peptide+ (C-PEP+) monohormonal cells. (C) GLUCAGON+ (GCG+) monohormonal cells. (D) C-Peptide+ GLUCAGON+ (C-PEP+GCG+) cell population. (E–F) mRNA time-course analysis during pancreatic differentiation at DE, PP1, PP2 and beta-like cell stages (n=3 per sample). (E) PAX4 mRNA expression. (F) ARX mRNA expression. (G) Relative gene expression of alpha cell specific genes at end stage of differentiation in HNF1A allelic series (n=3 per sample). For all statistical analyses: * P<0.05. See also Figure S3.
Figure 4:
Figure 4:. HNF1A is needed for optimal insulin secretion and cellular respiration in stem cell derived beta-like cells.
Mel1 HNF1A WT, HET and KO ESCs were differentiated into pancreatic endocrine cells and analyzed as described below. (A–C) Glucose stimulation insulin secretion (GSIS) in HNF1A allelic series at end stage of differentiation (n=4 per sample). (A) Stimulation index of insulin secreted showing fold change 20mM over 2mM glucose. (B) Quantification of insulin secreted per insulin positive cell in femtomoles (fM), low glucose (LG) 2mM and high glucose (HG) 20mM. (C) Stimulation index of insulin secreted in HNF1A KO cell line comparing LG to HG or HG plus 20uM Tolbutamide (n=3 per sample). (D–F) Glycolysis stress test for HNF1A allelic series (n=3 per sample). (D) Glycolytic profile of HNF1A allelic series showing as a extracellular acidification rate (ECAR) normalized at basal levels. (E) Glycolysis quantification. (F) Glycolysis capacity quantification. (G–H) Mitochondria stress test (n=3 per sample). (G) Mitochondrial respiration profile of HNF1A allelic series obtained using oligomycin, FCCP and Rotenone/actinomycin (Rot/Act). (H) Quantification of maximal respiration capacity. For all statistical analyses: * P<0.05, **P<0.01, ***P<0.001. See also Figure S4.
Figure 5:
Figure 5:. Disruption of HNF1A leads to an abnormal expression of genes related with beta cell function, development and diabetes.
Mel1 HNF1A WT, HET and KO ESCs were differentiated into pancreatic endocrine cells and analyzed as described below. (A–B) HNF1A allelic series genome profiling using purified INS-GFP+ NKX6.1+ cells at end stage of differentiation (n=3 per sample). (A) Flow cytometry plot for sorting double positive INS-GFP+ NKX6.1+ cells. (B) 501 differential expressed genes presented in a heat map plot obtained using a microarray analysis from samples sorted in A. (C) Differential expressed genes shown in the following categories: top downregulated genes, top upregulated genes, cellular respiration and genes differentially expressed in HET compared to KO. (D–G) qRT-PCR gene expression validation of a subset of gene targets in B (n=3 per sample). (D) Mouse HNF1A target genes. (E) Pancreas transcription factors. (F) cell stress and insulin biosynthesis. (G) Cellular respiration. For all statistical analyses: * P<0.05, **P<0.01. See also Figure S5.
Figure 6:
Figure 6:. The human specific lncRNA, LINC01139 (LINKA), is a downstream target of HNF1A.
(A) qRT-PCR mRNA quantification of LINC01139 in HNF1A allelic series (Mel1), purified INS-GFP+ end stage beta-like cells (n=3 per sample). (B–C) The EndoC-bH1 cell line was treated with or without HNF1A shRNA or CRISPR-CAS9 targeting HNF1A (KO) as described in Figure S5E (n=3 per sample). (B) Flow cytometry analysis of HNF1A in control or shRNA treated cells. (C) LINC01139 relative mRNA levels in WT, shRNA or KO cells. (D) LINC01139 transcript levels in sorted beta cells and alpha cells from healthy pancreas donor controls referred to as C compared to cells from a single MODY3 mutant donor referred to as M (Haliyur et al 2019) (Control n=5, MODY3 n=1). (E) Time-course LINC01139 mRNA quantification during pancreatic differentiation (n=3 per sample). (F) LINC01139 gene homology, modified from UCSC genome browser comparing Human vs Rhesus, mouse and rat. (G) LINC01139 mRNA quantification comparing purified stem cell derived beta-like cells with human islets sorted for INS, GCG, or SST and EndoC-bH1 cells (n=3 per sample). (H) LINC01139 mRNA quantification in EndoC-bH1 cell line treated with different beta cell stressors: high glucose (HG)(100mM), Interleukin 6 (IL-6)(50ng/ul) or both (n=4 per sample). (I) qRT-PCR quantification for LINC01139 mRNA in wild-type Mel1 line (WT) and deleted (DEL) LINC01139 cell line differentiated into end stage differentiation cultures. (J–N) Pancreatic differentiation of LINC WT and LINC01139 DEL cell line with quantification of specific proteins by flow cytometry. (J) Quantification of PDX1+ cells at PP1 (n=4 per sample). (K) Quantification of PDX1+ NKX6.1+ cells at PP2 (n=4 per sample). (L) Quantification of C-peptide+ cells at end of the differentiation (n=6 per sample). (M) Quantification of glucagon+ cells at end of the differentiation (n=6 per sample). (N) Quantification of somatostatin+ cells at end of the differentiation (n=6 per sample). (O) qRT-PCR mRNA quantification of pancreatic hormones INS, GCG, SST and GHRL at the end of the pancreatic differentiation (n=3 per sample). (P) Quantification of C-Peptide Mean Fluorescence Intensity (MFI) at the end of the differentiation protocol (n=3 per sample). For all statistical analysies: * P<0.05, **P<0.01, ***P<0.001. See also Figure S6.
Figure 7:
Figure 7:. Lack of LINKA mimics a subset of the phenotypes found in HNF1A mutant cells.
Mel1 LINC01139 WT and deletion (DEL) ESCs were differentiated into pancreatic endocrine cells and analyzed as described below. (A) Flow cytometry analysis of C-Peptide versus GLUCAGON at the end stage of pancreas differentiation (n=6 per WT and n=5 per LINC DEL cell line). (B–D) Quantification of pancreatic hormone expressing cells. (B) Percent C-Peptide+ (C-PEP+) monohormonal cells. (C) Percent GLUCAGON+ (GCG+) monohormonal cells. (D) Percent C-Peptide+ GLUCAGON+ (C-PEP+GCG+) cells. (E) PAX4 and ARX mRNA expression at end of pancreatic differentiation in bulk cells (n=3 per sample). (F) Relative gene expression of alpha cell specific genes at the end stage of differentiation in LINC01139 DEL and WT cell lines (n=3 per sample). (G–H) Mitochondria stress test using oligomycin, FCCP and Rotenone/actinomycin (Rot/Act) in LINC01139 DEL and WT cell lines (n=3 per sample). (G) Mitochondrial respiration profile. (H) Quantification of maximal respiration capacity comparing WT and LINC01139 DEL cell lines (n=3 per genotype). (I–J) mRNA quantification of HNF1A downstream target genes between WT and LINC01139 DEL cells using purified INS-GFP+ NKX6.1+ at end stage differentiation samples (n=3 per sample). For all statistical analysis: * P<0.05. See also Figure S7.

References

    1. Ainscow EK, Zhao C and Rutter G. a (2000). Acute overexpression of lactate dehydrogenase-A perturbs beta-cell mitochondrial metabolism and insulin secretion. Diabetes, 49(7), pp. 1149–1155. - PubMed
    1. Akpinar P, Kuwajima S, Krützfeldt J and Stoff el M (2005). Tmem27: a cleaved and shed plasma membrane protein that stimulates pancreatic beta cell proliferation. Cell metab, 2(6), pp. 385–97. - PubMed
    1. Beckner ME, Fellows-Mayle W, Zhang Z, Agostino NR, Kant JA, Day BW and Pollack IF (2010). Identification of ATP citrate lyase as a positive regulator of glycolytic function in glioblastomas. Int J. Cancer, 126(10), pp. 2282–2295. - PMC - PubMed
    1. Bonner C, Bacon S and Concannon C (2010). INS-1 Cells Undergoing Caspase-Dependent Apoptosis Enhance the Regenerative Capacity of Neighboring Cells. Diabetes, 59, pp. 2799–2808.. - PMC - PubMed
    1. Brial F, Lussier CR, Belleville K, Sarret P and Boudreau F (2015). Ghrelin inhibition restores glucose homeostasis in hepatocyte nuclear factor-1a (MODY3)-deficient mice’, Diabetes, 64(9). - PubMed

Publication types

Supplementary concepts