. 2019 Aug:39:101504.
doi: 10.1016/j.scr.2019.101504. Epub 2019 Jul 16.

Antisense oligonucleotide therapy rescues aggresome formation in a novel spinocerebellar ataxia type 3 human embryonic stem cell line

Affiliations

Antisense oligonucleotide therapy rescues aggresome formation in a novel spinocerebellar ataxia type 3 human embryonic stem cell line

Lauren R Moore et al. Stem Cell Res. 2019 Aug.

Abstract

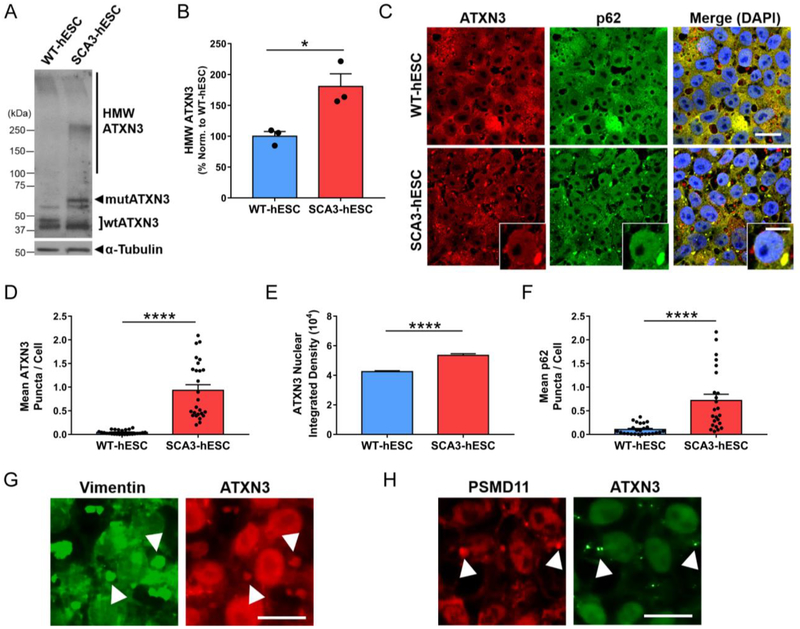
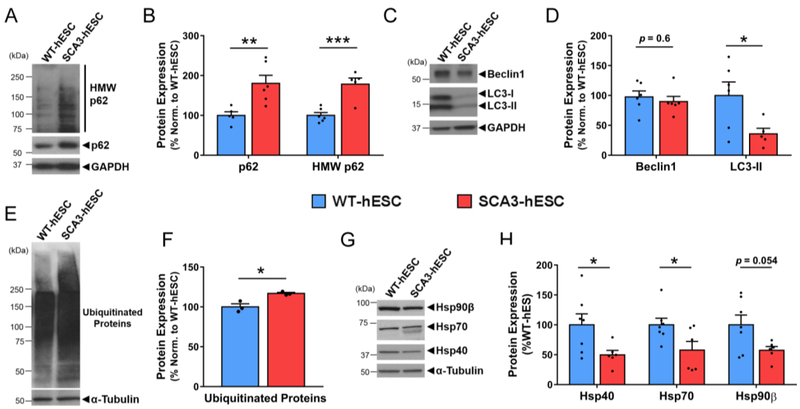
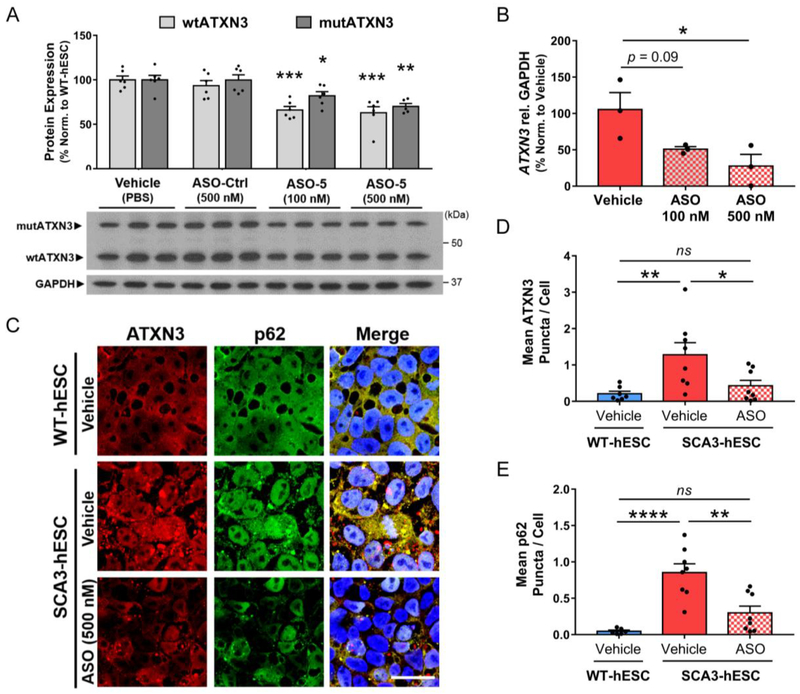
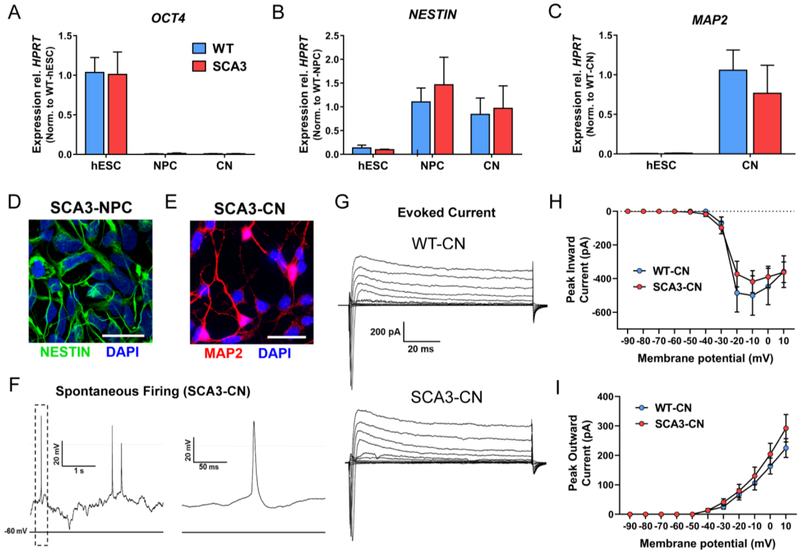
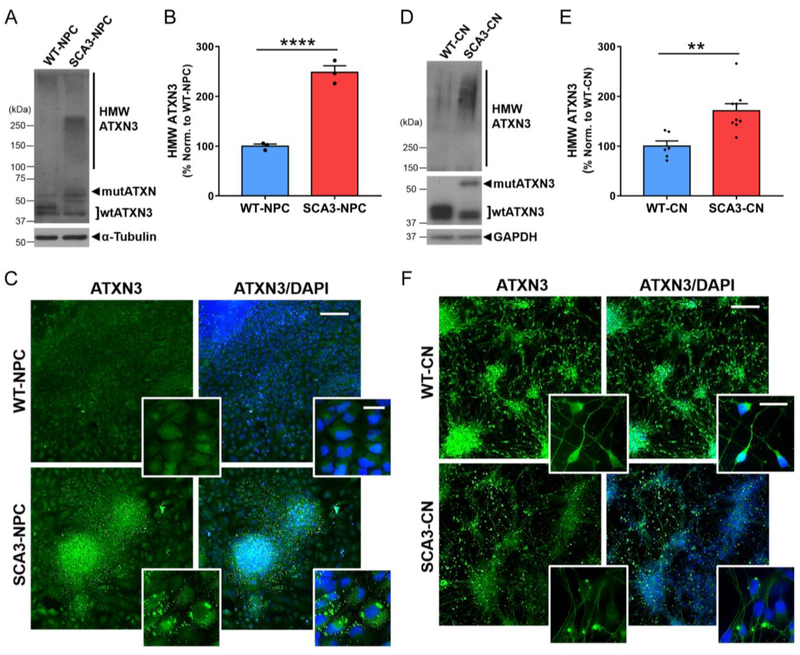
Spinocerebellar ataxia type 3 (SCA3) is a fatal, late-onset neurodegenerative disorder characterized by selective neuropathology in the brainstem, cerebellum, spinal cord, and substantia nigra. Here we report the first NIH-approved human embryonic stem cell (hESC) line derived from an embryo harboring the SCA3 mutation. Referred to as SCA3-hESC, this line is heterozygous for the mutant polyglutamine-encoding CAG repeat expansion in the ATXN3 gene. We observed relevant molecular hallmarks of the human disease at all differentiation stages from stem cells to cortical neurons, including robust ATXN3 aggregation and altered expression of key components of the protein quality control machinery. In addition, SCA3-hESCs exhibit nuclear accumulation of mutant ATXN3 and form p62-positive aggresomes. Finally, antisense oligonucleotide-mediated reduction of ATXN3 markedly suppressed aggresome formation. The SCA3-hESC line offers a unique and highly relevant human disease model that holds strong potential to advance understanding of SCA3 disease mechanisms and facilitate the evaluation of candidate therapies for SCA3.

Keywords: Aggresome; Antisense oligonucleotide; Ataxin-3; Machado-Joseph disease; Neurodegeneration; Polyglutamine disease.


Conflict of interest statement

Declaration of Interests Statement

The authors have no conflicts of interest to declare.

Figures

Figure 1.
Figure 1.. SCA3-hESC line UM134–1 is pluripotent, possesses a normal karyotype, and expresses pathogenic polyglutamine-expanded mutant ATXN3.
(A) Immunocytochemical analysis with DAPI co-stain of SCA3-hESC revealed expression of pluripotency markers OCT3/4, SOX2, and NANOG. Scale bar = 200 μm. (B) Undifferentiated WT-hESC (blue) and SCA3-hESC (red) expressed pluripotency markers LIN28, OCT4, SOX2 and NANOG as assessed by qRT-PCR analysis. Data are represented as mean of three replicates ± SEM. (C) SCA3-hESC were differentiated into embryoid bodies for 21 days in culture. Differentiated SCA3-embryoid bodies expressed lineage markers of endodermal [α-fetoprotein (AFP)], mesodermal [Brachyury], and ectodermal tissue [neuron-specific class III beta-tubulin (TUJ-1)]. Electrophoresis demonstrated anticipated amplicon size for each lineage marker PCR primer set. (D) G-banded karyotype analysis of passage 6 undifferentiated SCA3-hESC showed a normal 46,XY karyotype. (E) Representative anti-polyQ expansion and (F) anti-ATXN3 Western blot of undifferentiated WT- and SCA3-hESC revealed heterozygous expression of polyQ-expanded ATXN3 protein in SCA3-hESC within the pathogenic range for SCA3. (G) Anticipated ATXN3 polyQ repeat lengths in WT- and SCA3-hESC lines as determined by gene fragmentation analysis. Mutant polyQ-expanded repeat length is highlighted in red. (mutATXN3 = mutant ATXN3; wtATXN3 = wild type ATXN3).
Figure 2.
Figure 2.. SCA3-hESC form high molecular weight ATXN3 aggregates that localize to p62-positive aggresomes, and exhibit enhanced nuclear sequestration of ATXN3.
(A) Representative anti-ATXN3 Western blot and (B) quantification of high molecular weight (HMW) ATXN3 species in undifferentiated WT-hESC (blue) and SCA3-hESC (red). Data (mean of three replicates ± SEM) are reported normalized to WT-hESC set to 100%. (C) Immunocytochemistry of undifferentiated WT- and SCA3-hESC showing single channel anti-ATXN3 (red) and anti-p62 (green) immunofluorescence merged with DAPI co-stain (blue). Scale bar = 25 μm. Inset scale bar = 10 μm. (D) Mean ATXN3 puncta per cell, (E) ATXN3 nuclear integrated density, and (F) p62 puncta per cell in WT- and SCA3-hESC. (G) Anti-vimentin (green) and anti-ATXN3 (red) immunofluorescence in undifferentiated SCA3-hESC. Scale bar = 20 μm. (H) Anti-PSMD11 (red) and anti-ATXN3 (green) immunofluorescence in undifferentiated SCA3-hESC. White arrowheads indicate co-localization of vimentin+ or PSMD11+ and ATXN3+ puncta. Scale bar = 20 μm. Data (mean ± SEM) are reported (n = 3−5 confocal images per 3–4 independent replicates). Data points in (D) and (F) represent individual confocal images, while mean nuclear integrated density in (E) was calculated by averaging across imaged nuclei. Unpaired two-tailed t test (*p<0.05, **p<0.01, ***p<0.001, ****p<0.0001). (mutATXN3 = mutant ATXN3; wtATXN3 = wild type ATXN3; PSMD11 = proteasome 26S subunit, non-ATPase 11).
Figure 3.
Figure 3.. SCA3-hESC exhibit altered expression of key regulators of protein homeostasis.
(A) Representative anti-p62 Western blot and (B) quantification of monomeric and high molecular weight (HMW) p62 in undifferentiated WT-hESC (blue) and SCA3-hESC (red) (n = 6). (C) Representative anti-Beclin1 and anti-LC3B Western blot and (D) quantification in undifferentiated WT- and SCA3-hESC (n = 6). (E) Representative anti-ubiquitin western blot and (F) quantification of ubiquitinated proteins in WT- and SCA3-hESC (n = 3). (G) Anti-Hsp40, anti-Hsp70, and anti-Hsp90β Western blots and (H) quantification in WT- and SCA3-hESC (n = 6). Data (mean of 3–6 independent replicates ± SEM) are reported relative to WT-hESC set to 100%. Unpaired two-tailed t test (*p<0.05, **p<0.01, ***p<0.001). (GAPDH = glyceraldehyde-3-phosphate dehydrogenase).
Figure 4.
Figure 4.. Anti-ATXN3 antisense oligonucleotide-mediated reduction of ATXN3 rescues ATXN3 aggregation and aggresome formation in SCA3-hESC.
(A) Representative anti-ATXN3 Western blot and quantification of mutant ATXN3 (mutATXN3, dark gray) and wild type ATXN3 (wtATXN3, light gray) in SCA3-hESC protein lysates four days after transfection with PBS vehicle, 500 nM of scrambled antisense oligonucleotide control (ASO-Ctrl), and 100 nM or 500 nM of an anti-ATXN3 antisense oligonucleotide (ASO) (n = 6 replicates). (B) qRT-PCR analysis of total ATXN3 transcript levels in SCA3-hESC three days after transfection vehicle, 100 nM or 500 nM of ASO (n = 3 replicates). (C) Anti-ATXN3 (red) and anti-p62 (green) immunofluorescence and DAPI co-stain (blue) merged images in vehicle-treated WT-hESC, vehicle-treated SCA3-hESC, and SCA3-hESC transfected with 500 nM ASO. Cells were fixed four days following transfection of vehicle or ASO. Scale bar = 25 μm. (D) Quantification of mean ATXN3 puncta per cell and (E) mean p62 puncta per cell in WT-hESC (blue) and SCA3-hESC (red) transfected with vehicle, and SCA3-hESC transfected with 500 nM anti-ATXN3 ASO (red/white checkered) (n = 2−3 images quantified from 3 experimental replicates). Data (mean ± SEM) are reported. One-way ANOVA performed with the post-hoc Tukey test. (*p<0.05, **p<0.01, ***p<0.001, ****p<0.0001). (GAPDH = glyceraldehyde-3-phosphate dehydrogenase; ns = not significant).
Figure 5.
Figure 5.. SCA3-hES can be differentiated into NESTIN+ neural progenitor cells and Day 30 MAP2+ forebrain cortical neurons that exhibit spontaneous firing activity.
(A) qRT-PCR analysis for pluripotency marker OCT4, (B) neural stem cell marker NESTIN, and (C) mature neural lineage marker MAP2 in undifferentiated WT- (blue) and SCA3-hESC (red) and differentiated neural progenitor cells (NPC) and cortical neurons (CN). Data (mean ± SEM) are reported normalized to WT-hESC, WT-NPC, or WT-CN as indicated in graph (n = 3 replicates). (D) NPCs derived from SCA3-hESC immunostained for neural stem cell marker NESTIN (green) and DAPI (blue). Scale bar = 50 μm. (E) Neurons derived from SCA3-hESC immunostained with mature neuronal marker MAP2 (red) and DAPI (blue). Scale bar = 25 μm. (F) Representative whole-cell current-clamp electrophysiological recording and enlarged inset of SCA3-CN showing spontaneous action potentials. (G) Representative whole-cell voltage-clamp recordings of WT- and SCA3-CN indicating evoked inward and outward currents in response to depolarizing voltage steps. (H) Quantification of peak inward currents in response to depolarizing voltage steps in WT- (n = 7 cells) and SCA3-CN (n = 9 cells). (I) Quantification of peak outward currents in response to depolarizing voltage steps in WT- (n=7 cells) and SCA3-CN (n = 9 cells). Data (mean ± SEM) are reported. Two-way ANOVA performed with Holm Sidak correction for multiple comparisons.
Figure 6.
Figure 6.. SCA3-hESC derived neural progenitor cells and Day 30 cortical neurons express polyglutamine-expanded mutant ATXN3 and accumulate high molecular weight ATXN3 aggregates.
(A) Representative anti-ATXN3 Western blot and (B) quantification of high molecular weight (HMW) ATXN3 levels in neural progenitor cells (NPC) derived from WT-hESC (WT-NPC, blue) and SCA3-hESC (SCA3-NPC, red). Data (mean ± SEM) are reported relative to mean WT-NPC set to 100% (n=3 replicates). (C) WT- and SCA3-NPC immunostained for ATXN3 (green) and DAPI (blue). (D) Representative anti-ATXN3 Western blot and (E) quantification of HMW ATXN3 levels in cortical neurons (CN) derived from WT-hESC (WT-CN, blue) and SCA3-hESC (SCA3-CN, red). Data (mean ± SEM) are reported relative to mean WT-CN set to 100% (n=3 replicates). (F) WT-CN and SCA3-CN shown with anti-ATXN3 (green) and DAPI (blue) immunostaining. Scale bar = 200 μm. Inset scale bar = 25 μm. Unpaired two-tailed t test (**p<0.01, ****p<0.0001).
Figure 7.
Figure 7.. SCA3-hES derived Day 30 cortical neurons exhibit altered expression of key regulators of protein homeostasis.
(A) Representative anti-p62 Western blot of soluble (S) and insoluble (I) protein fractions from WT-CN (blue) and SCA3-CN (red). (B) Ratio of insoluble/soluble p62 protein in WT-CN and SCA3-CN. (C) Representative anti-Beclin1 and anti-LC3B Western blots and (D) quantification in RIPA-lysed WT-CN and SCA3-CN. (E) Representative anti-ubiquitin Western blot of soluble and insoluble protein fractions from WT-CN and SCA3-CN. (F) Quantification of soluble ubiquitinated and insoluble ubiquitinated proteins, and insoluble small ubiquitin chains [(Ub)2–4] in WT-CN and SCA3-CN. (G) Representative anti-Hsp40, -Hsp70, and -Hsp90β Western blot and (H) quantification in RIPA-lysed WT-CN and SCA3-CN. Data (mean of 3 replicates ± SEM) are reported relative to mean WT-CN set to 100%. Unpaired two-tailed t test (*p<0.05). (Ubiquit. = ubiquitinated; GAPDH = glyceraldehyde-3-phosphate dehydrogenase).

References

    1. Costa Mdo C & Paulson HL Toward understanding Machado-Joseph disease. Progress in neurobiology 97, 239–257, doi: 10.1016/j.pneurobio.2011.11.006 (2012). - DOI - PMC - PubMed
    1. Paulson HL, Shakkottai VG, Clark HB & Orr HT Polyglutamine spinocerebellar ataxias - from genes to potential treatments. Nature reviews. Neuroscience 18, 613–626, doi: 10.1038/nrn.2017.92 (2017). - DOI - PMC - PubMed
    1. Kawaguchi Y et al. CAG expansions in a novel gene for Machado-Joseph disease at chromosome 14q32.1. Nature genetics 8, 221–228, doi: 10.1038/ng1194-221 (1994). - DOI - PubMed
    1. Rub U et al. Clinical features, neurogenetics and neuropathology of the polyglutamine spinocerebellar ataxias type 1, 2, 3, 6 and 7. Progress in neurobiology 104, 38–66, doi: 10.1016/j.pneurobio.2013.01.001 (2013). - DOI - PubMed
    1. Rosenberg RN Machado-Joseph disease: an autosomal dominant motor system degeneration. Movement disorders : official journal of the Movement Disorder Society 7, 193–203, doi: 10.1002/mds.870070302 (1992). - DOI - PubMed

Publication types