. 2019 Aug 1;8(8):808.
doi: 10.3390/cells8080808.

Sprouty3 and Sprouty4, Two Members of a Family Known to Inhibit FGF-Mediated Signaling, Exert Opposing Roles on Proliferation and Migration of Glioblastoma-Derived Cells

Affiliations

Sprouty3 and Sprouty4, Two Members of a Family Known to Inhibit FGF-Mediated Signaling, Exert Opposing Roles on Proliferation and Migration of Glioblastoma-Derived Cells

Burcu Emine Celik-Selvi et al. Cells. .

Abstract

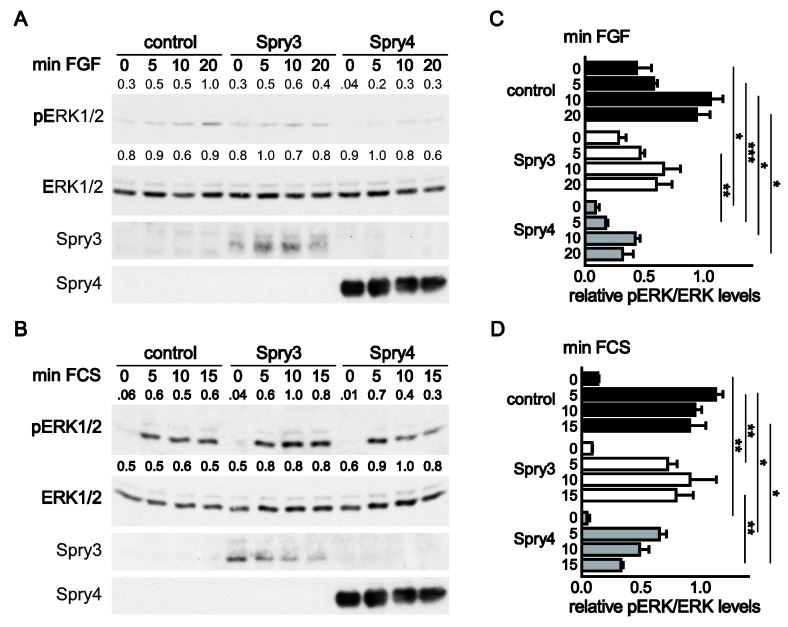
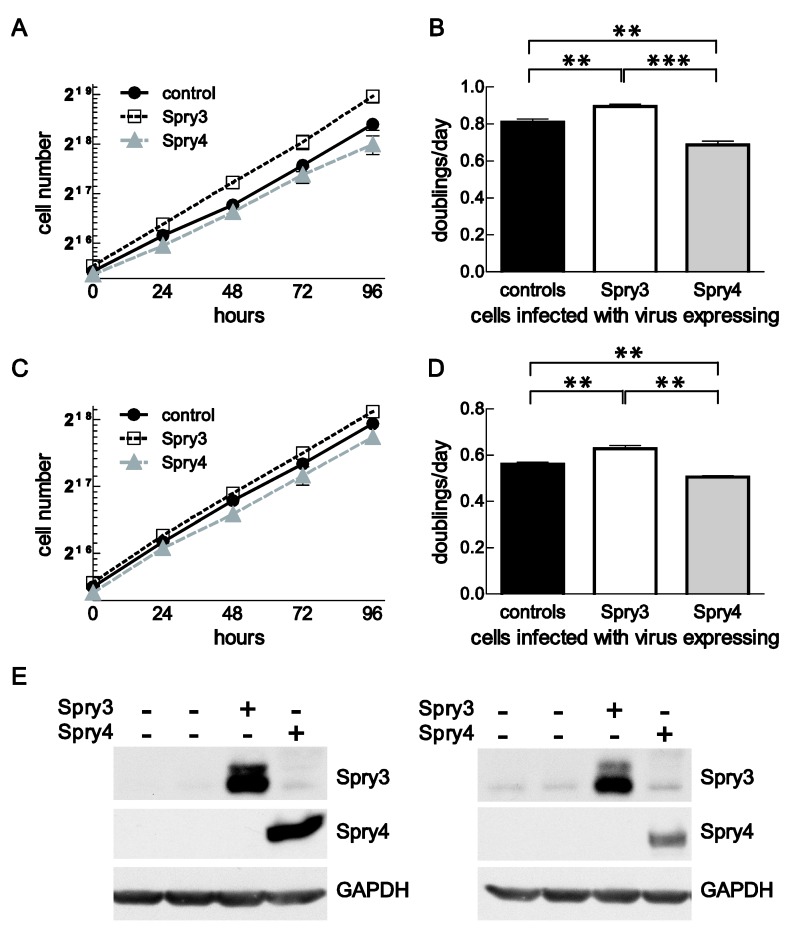
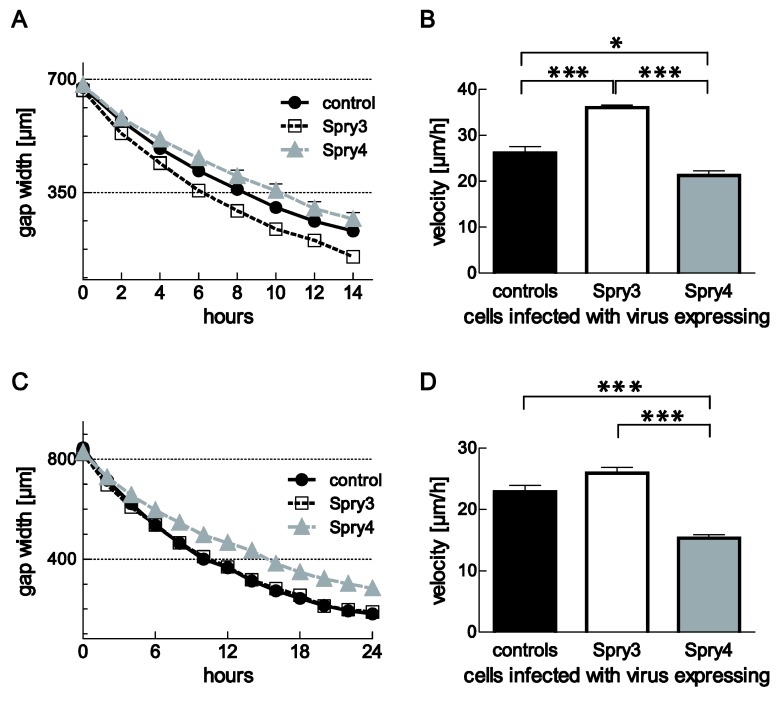
Dysregulation of receptor tyrosine kinase-induced pathways is a critical step driving the oncogenic potential of brain cancer. In this study, we investigated the role of two members of the Sprouty (Spry) family in brain cancer-derived cell lines. Using immunoblot analyses we found essential differences in the pattern of endogenous Spry3 and Spry4 expression. While Spry4 expression was mitogen-dependent and repressed in a number of cells from higher malignant brain cancers, Spry3 levels neither fluctuated in response to serum withdrawal nor were repressed in glioblastoma (GBM)-derived cell lines. In accordance to the well-known inhibitory role of Spry proteins in fibroblast growth factor (FGF)-mediated signaling, both Spry proteins were able to interfere with FGF-induced activation of the MAPK pathway although to a different extent. In response to serum solely, Spry4 exerts its role as a negative regulator of MAPK activation. Ectopic expression of Spry4 inhibited proliferation and migration of GBM-originated cells, positioning it as a tumor suppressor in brain cancer. In contrast, elevated Spry3 levels accelerated both proliferation and migration of these cell lines, while repression of Spry3 levels using shRNA caused a significant diminished growth and migration velocity rate of a GBM-derived cell line. This argues for a tumor-promoting function of Spry3 in GBMs. Based on these data we conclude that Spry3 and Spry4 fulfill different if not opposing roles within the cancerogenesis of brain malignancies.

Keywords: FGF-mediated signaling; Sprouty proteins; brain cancer; tumor promoter; tumor suppressor.


Conflict of interest statement

The authors declare no conflict of interest.

Figures

Figure 1
Figure 1
Expression of Spry3 protein in brain cancer-derived cell lines. (A) U373 cells were infected with decreasing amounts of adenoviruses expressing Spry3 protein and an immunoblot using Spry3 antibodies was performed. Equal loading was verified by Ponceau S staining of the immunoblot. (B) Adenoviruses expressing Spry1, Spry2, Spry3 or Spry4 were introduced into U373 cells. A total of 48 h post-infection cells were harvested and proteins were isolated. An immunoblot sequentially probed with all of the indicated antibodies is depicted. (C) Logarithmically growing cell lines derived from oligodendroglioma (ODG), astrocytoma (AC), glioblastoma (GBM), gliosarcoma (GS) and neuroblastoma (NB) were cultured for 24 h without (-) and with (+) serum. Using Western blot, endogenous Spry3 and GAPDH proteins were determined. (D) Amounts of Spry3 proteins were measured as ratio to an external control (MG63) by Image Quant software and normalized to GAPDH. Quantification results of 2–3 Western blots depicted as mean ± SEM are shown in a column graph. Cell lines were sorted according to their histopathological origin. (E) A scatterplot presenting the Spry3 expression across the histopathological subgroups of brain cancer is shown. (F) Calculated Spry3 levels from cells grown in serum-deprived (open circle) and –supplemented (closed circle) mediums are compared.
Figure 2
Figure 2
Expression analysis of endogenous Spry4 protein in brain cancer cells. (A) Spry4 protein levels in 17 brain cancer-derived cell lines which were cultured devoid of (−) and with (+) serum. GAPDH served as loading control. (B) Quantification of Spry4 was performed using Image Quant 5.0. An external control was arbitrarily set as 1 and loading differences were adjusted to GAPDH expression. A column graph summarizes the results of 2–3 independent experiments. (C) Spry4 expression in serum-supplemented growth condition was compared. A scattered dot-plot grouping the cells according to the histological origin is depicted. (D) A comparison of Spry4 levels detected in starved (open circle) and stimulated (closed circle) cells is presented. (E) Correlation of Spry3 and Spry4 expression was calculated using GraphPad Prism.
Figure 3
Figure 3
Influence of Spry3 and Spry4 proteins on ERK activation by FGF2 and serum. Glioblastoma (GBM)-derived cells (U373) were serum-starved for 24 h and then infected with adenoviruses expressing either a control protein (luciferase), Spry3 or Spry4. Two days later, cells were incubated with FGF2 (A) or serum (B) for the indicated times. Representative immunoblots of an experiment using antibodies recognizing pERK1/2 and total ERK1/2 are shown. Expression of Spry3 and Spry4 were verified by the respective antibodies. Using ImageQuant 5.0, the pERK1/2 bands detected were quantified and normalized to the corresponding values obtained for the ERK expression. The highest values were arbitrarily set as 1. The results of the quantification for the presented blots are depicted. (C) A summary of calculated mean values ± SEM of the pERK/ERK values from three experiments using FGF2 to stimulate the cells is depicted. Significance between the three groups was calculated by using a one-way ANOVA test in GraphPad prism. (D) The bands of pERK and ERK in response to serum were densitometrically quantified using ImageQuant 5.0, and the highest values of each experiment were set as 1. The graph summarizes three experiments. Significance was determined by a one-way ANOVA test in using GraphPad prism software. * p < 0.05; ** p < 0.01; *** p < 0.001.
Figure 4
Figure 4
Influence of ectopic Spry3 and Spry4 expression on cell proliferation. Proliferation of cells overexpressing the indicated proteins was assessed by growth curve analysis. (A) The number of DBTRG-05MG cells were counted every 24 h for 5 days and are depicted as growth curves using a semi-logarithmical scale. A representative growth curve of three replicates is depicted. (B) Using GraphPad Prism, doubling times of at least three independent growth curve analyses performed with DBTRG-05MG cells were calculated and presented as mean doublings per day ± SEM. (C) A representative growth curve of U373 cell line is shown. (D) Using exponential growth equations, doubling times of U373MG cells were calculated and shown as doublings per day. Significance was assessed using an unpaired t-test in GraphPad Prism and mean ± SEM are shown. * p < 0.05; ** p < 0.01; *** p < 0.001 (E) Overexpression of Spry3 and Spry4 in the GBM cell lines DBTRG-05MG (left) and U373 (right) were verified by immunoblotting.
Figure 5
Figure 5
Influence of Spry3 and Spry4 expression on cell migration of GBM-derived cell lines. (A) Scratch assay was performed in DBTRG-05MG cells infected with adenoviruses expressing the indicated proteins. Representative curves of distance coverage were obtained by measuring decreasing gap widths of three replicative scratches at every two-hour time points using ImageJ. (B) Using linear regression, migration velocities were calculated. Means of at least three experimentations ± SEM are summarized as column bars. (C) Representative measurements of replicative gap closure in a close layer of U-373 MG cell expressing the indicated proteins are shown. (D) Velocities of at least three experiments were calculated using linear regression in GraphPad Prism and summarized in a graph depicting means ± SEM. An unpaired t-test was used to acquire significance. p < 0.05; ** p < 0.01; *** p < 0.001.
Figure 6
Figure 6
Verification of Spry3 impact on cell proliferation and migration by downregulation of the endogenous protein levels. DBTRG-05MG (A) and U373 (B) cells infected with adenoviruses expressing Spry3, shSpry3 or a control protein were analyzed concerning their Spry3 protein levels. (C) Three days after infection with the indicated viruses a growth curve analysis was performed in U373. (D) The doubling time of three experiments was calculated by performing an exponential growth equation and the mean doublings per day ± SEM are depicted. (E) U373 cell expressing the indicated proteins were cultured to form a close layer before a scratch assay was performed. Measurements of three replicative gaps were performed every two hours and a representative experiment is shown. (F) Velocities of three experiments were calculated using linear regression in GraphPad Prism and a summary is depicted. Using an unpaired t-test, significance was determined. ** p < 0.01; *** p < 0.001.

Similar articles

Cited by

References

    1. Furnari F.B., Fenton T., Bachoo R.M., Mukasa A., Stommel J.M., Stegh A., Hahn W.C., Ligon K.L., Louis D.N., Brennan C., et al. Malignant astrocytic glioma: Genetics, biology, and paths to treatment. Genes Dev. 2007;21:2683–2710. doi: 10.1101/gad.1596707. - DOI - PubMed
    1. Kruchko C., Ostrom Q.T., Boscia A., Truitt G., Gittleman H., Barnholtz-Sloan J.S. CBTRUS Statistical Report: Primary Brain and Other Central Nervous System Tumors Diagnosed in the United States in 2011–2015. Neuro-Oncol. 2018;20:iv1–iv86. doi: 10.1093/neuonc/noy131. - DOI - PMC - PubMed
    1. Schilling F.H., Spix C., Berthold F., Erttmann R., Fehse N., Hero B., Klein G., Sander J., Schwarz K., Treuner J., et al. Neuroblastoma screening at one year of age. N. Engl. J. Med. 2002;346:1047–1053. doi: 10.1056/NEJMoa012277. - DOI - PubMed
    1. Cancer Genome Atlas Research N. Comprehensive genomic characterization defines human glioblastoma genes and core pathways. Nature. 2008;455:1061–1068. doi: 10.1038/nature07385. - DOI - PMC - PubMed
    1. Hacohen N., Kramer S., Sutherland D., Hiromi Y., Krasnow M.A. Sprouty encodes a novel antagonist of FGF signaling that patterns apical branching of the Drosophila airways. Cell. 1998;92:253–263. doi: 10.1016/S0092-8674(00)80919-8. - DOI - PubMed

Publication types

MeSH terms

Substances