. 2019 Aug 1;8(8):261.
doi: 10.3390/antiox8080261.

Lion's Mane Mushroom, Hericium erinaceus (Bull.: Fr.) Pers. Suppresses H2O2-Induced Oxidative Damage and LPS-Induced Inflammation in HT22 Hippocampal Neurons and BV2 Microglia

Affiliations

Lion's Mane Mushroom, Hericium erinaceus (Bull.: Fr.) Pers. Suppresses H2O2-Induced Oxidative Damage and LPS-Induced Inflammation in HT22 Hippocampal Neurons and BV2 Microglia

Naufal Kushairi et al. Antioxidants (Basel). .

Abstract

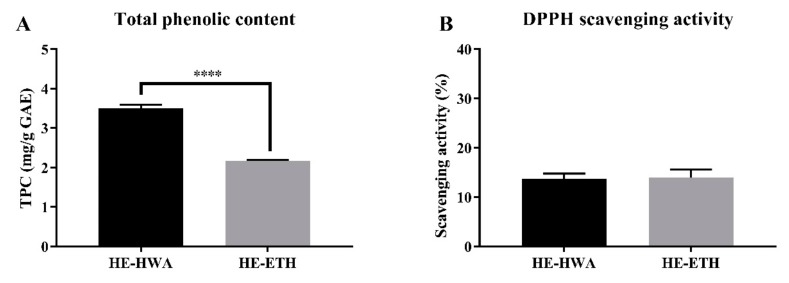
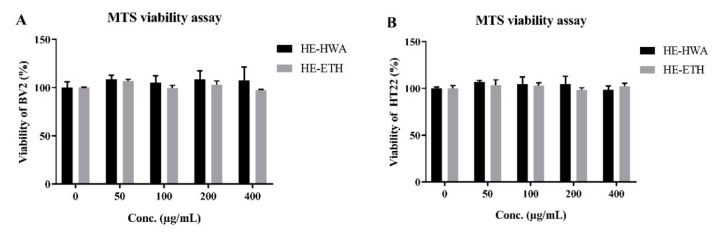
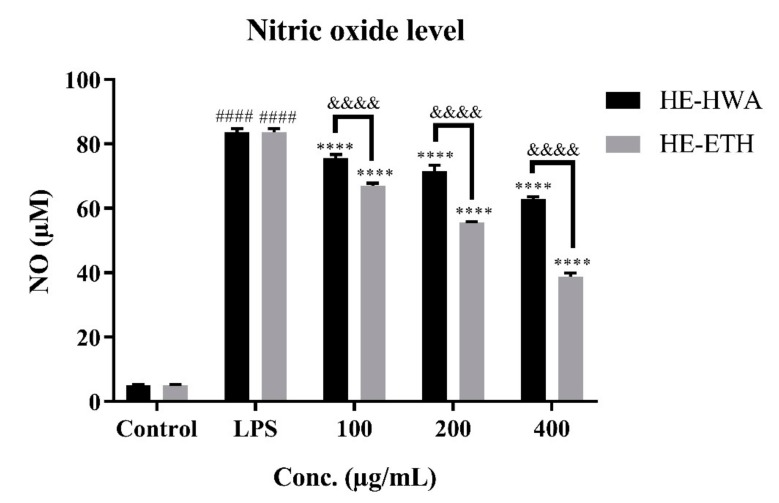
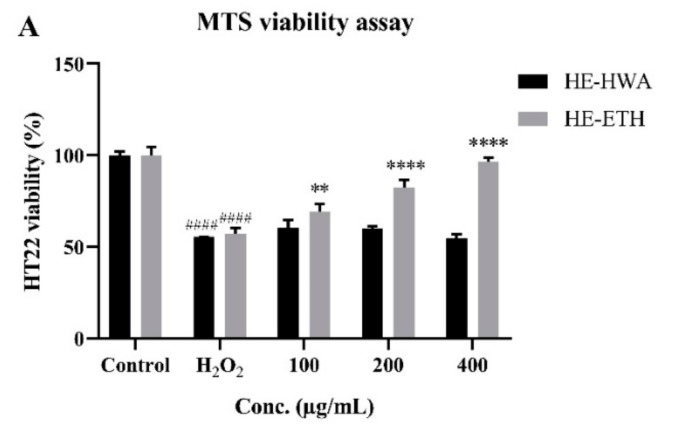
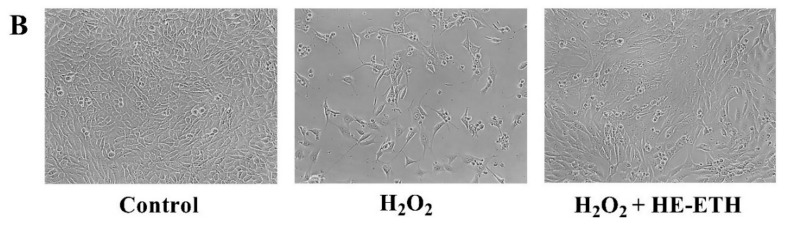
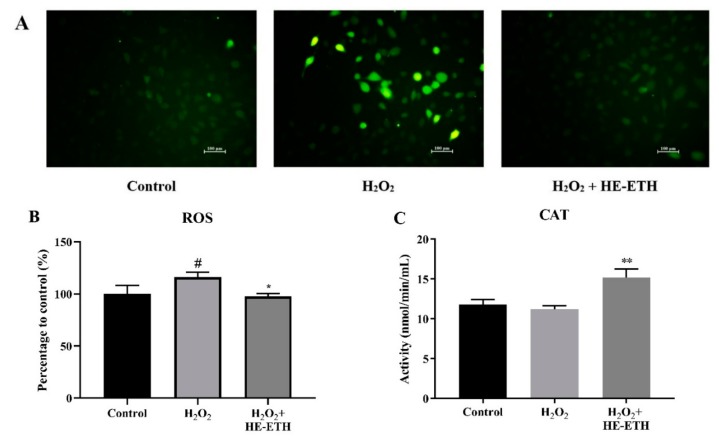
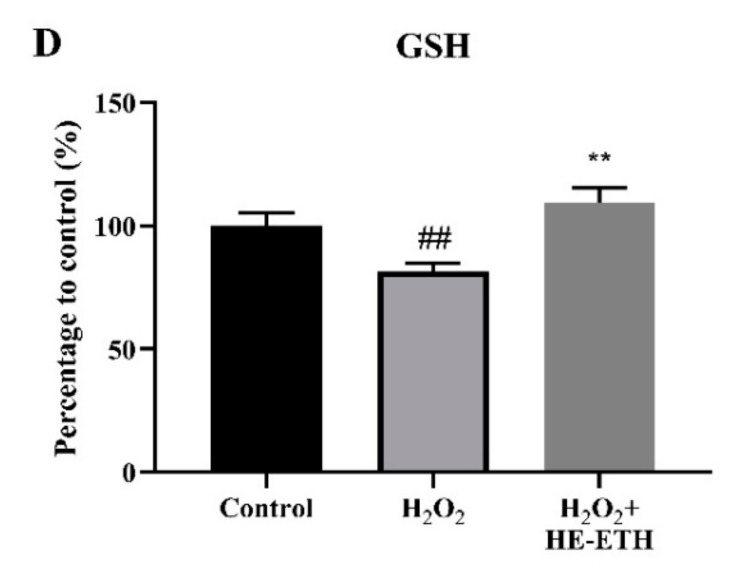
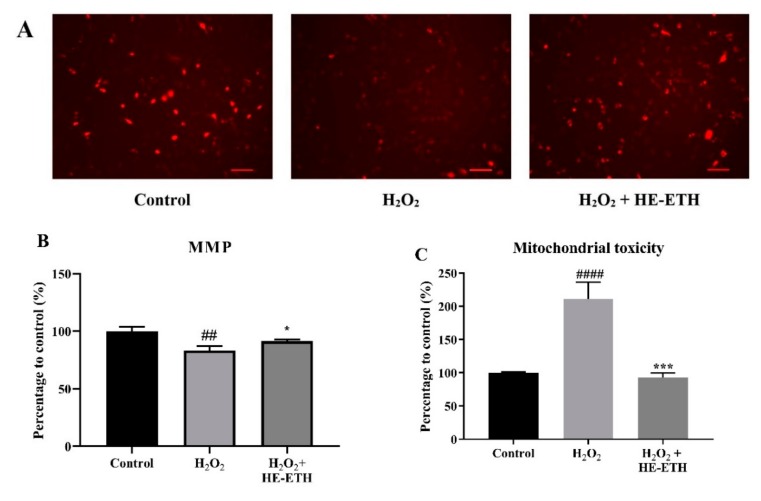
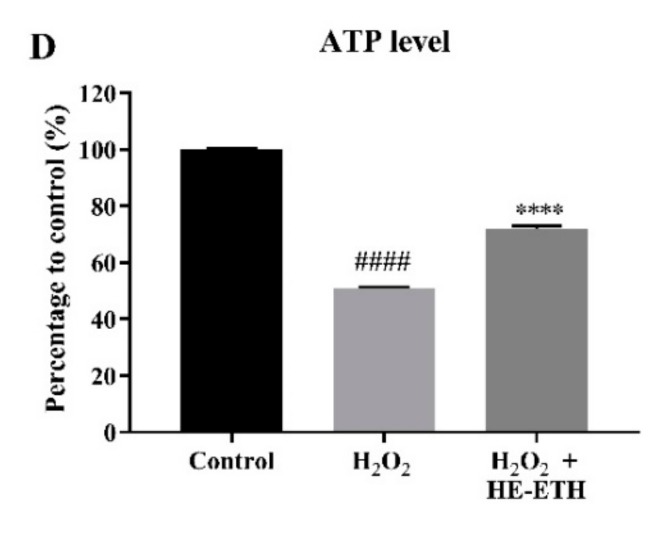
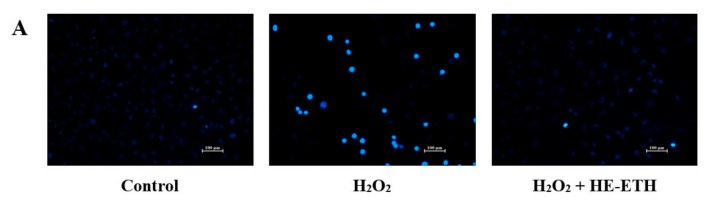
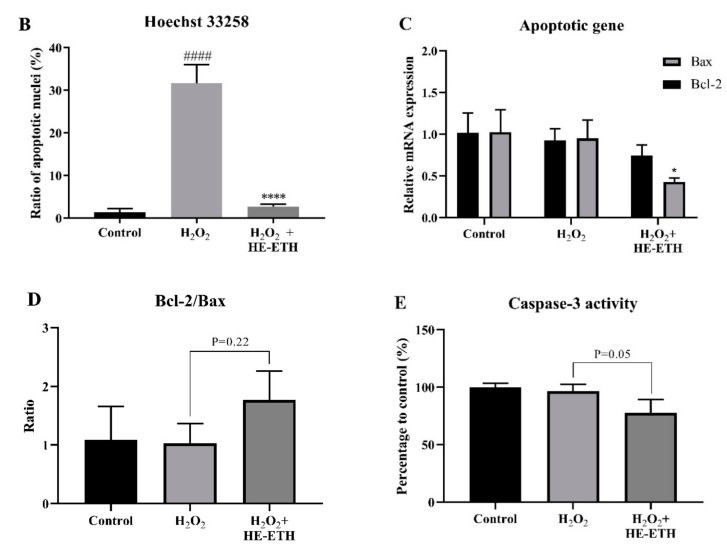
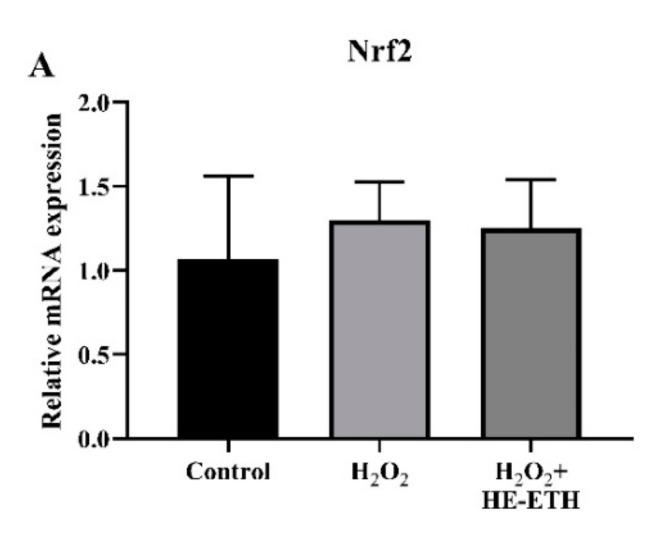
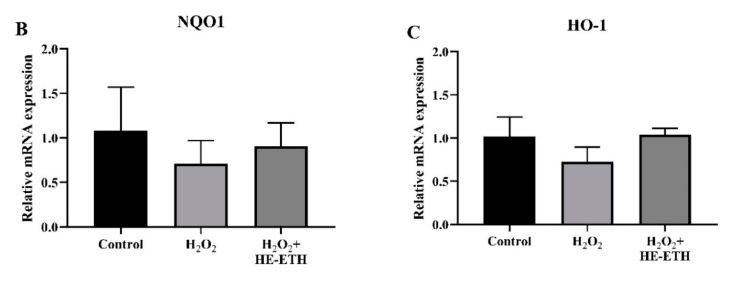
Oxidative stress and inflammation in neuron-glia system are key factors in the pathogenesis of neurodegenerative diseases. As synthetic drugs may cause side effects, natural products have gained recognition for the prevention or management of diseases. In this study, hot water (HE-HWA) and ethanolic (HE-ETH) extracts of the basidiocarps of Hericium erinaceus mushroom were investigated for their neuroprotective and anti-inflammatory activities against hydrogen peroxide (H2O2)-induced neurotoxicity in HT22 mouse hippocampal neurons and lipopolysaccharide (LPS)-induced BV2 microglial activation respectively. HE-ETH showed potent neuroprotective activity by significantly (p < 0.0001) increasing the viability of H2O2-treated neurons. This was accompanied by significant reduction in reactive oxygen species (ROS) (p < 0.05) and improvement of the antioxidant enzyme catalase (CAT) (p < 0.05) and glutathione (GSH) content (p < 0.01). Besides, HE-ETH significantly improved mitochondrial membrane potential (MMP) (p < 0.05) and ATP production (p < 0.0001) while reducing mitochondrial toxicity (p < 0.001), Bcl-2-associated X (Bax) gene expression (p < 0.05) and nuclear apoptosis (p < 0.0001). However, gene expression of Nuclear factor erythroid 2-related factor 2 (Nrf2), heme oxygenase 1 (HO-1) and NAD(P)H quinone dehydrogenase 1 (NQO1) were unaffected (p > 0.05). HE-ETH also significantly (p < 0.0001) reduced nitric oxide (NO) level in LPS-treated BV2 indicating an anti-inflammatory activity in the microglia. These findings demonstrated HE-ETH maybe a potential neuroprotective and anti-inflammatory agent in neuron-glia environment.

Keywords: Hericium erinaceus; anti-inflammation; antioxidants; mushroom; neuroprotection.


Conflict of interest statement

The authors declare no conflict of interest.

Figures

Figure 1
Figure 1
(A) Total phenolic content (TPC) and (B) 2,2-diphenyl-1-picrylhydrazyl (DPPH) radical scavenging activity of hot water (HE-HWA) and ethanolic (HE-ETH) extracts. Gallic acid equivalent (GAE) was used for relative quantification of the TPCs. In DPPH scavenging assay, the final concentration of HE-HWA and HE-ETH was 1 mg/mL. All values presented correspond to mean ± SD of three independent experiments (n = 3). Values of **** p < 0.0001 was considered as statistically significant.
Figure 2
Figure 2
Cytotoxicity of hot water (HE-HWA) and ethanolic (HE-ETH) extracts on (A) BV-2 microglia and (B) HT22 neurons. The results were expressed as percentage of viable cell versus control, with control considered as 100% cell viability. All values presented correspond to mean ± SD of three independent experiments (n = 3).
Figure 3
Figure 3
Inhibitory effects of hot water (HE-HWE) and ethanolic (HE-ETH) extracts on LPS-induced NO production in BV-2 microglial cells. All values presented correspond to mean ± SD of three independent experiments (n = 3). Values of #### p < 0.0001 compared with control and **** p < 0.0001 compared with lipopolysaccharide (LPS)-treated group, were considered as statistically significant. Values of &&&& p < 0.0001 between the treatment groups were considered as statistically significant.
Figure 4
Figure 4
(A) Protective effects of hot water (HE-HWA) and ethanolic (HE-ETH) extracts on H2O2-treated HT22 neurons measured by MTS viability assay and (B) morphology of the neurons (control, 250 μM H2O2 and 250 μM H2O2 + 400 μg/mL HE-ETH) under light microscope. The results were expressed as percentage of viable cell versus control, with control considered as 100% cell viability. All values presented correspond to mean ± SD of three independent experiments (n = 3). Values of #### p < 0.0001 compared with control, and ** p < 0.01; **** p < 0.0001 compared with H2O2-treated group were considered as statistically significant. Scale bar denotes 100 μm.
Figure 4
Figure 4
(A) Protective effects of hot water (HE-HWA) and ethanolic (HE-ETH) extracts on H2O2-treated HT22 neurons measured by MTS viability assay and (B) morphology of the neurons (control, 250 μM H2O2 and 250 μM H2O2 + 400 μg/mL HE-ETH) under light microscope. The results were expressed as percentage of viable cell versus control, with control considered as 100% cell viability. All values presented correspond to mean ± SD of three independent experiments (n = 3). Values of #### p < 0.0001 compared with control, and ** p < 0.01; **** p < 0.0001 compared with H2O2-treated group were considered as statistically significant. Scale bar denotes 100 μm.
Figure 5
Figure 5
Antioxidant activities of ethanolic extract (HE-ETH) on H2O2-treated HT22 neurons. HT22 was co-incubated with 250 μM H2O2 and 400 μg/mL HE-ETH before subjected to series of antioxidant assays. (A) Representative images of intracellular reactive oxygen species (ROS) stained by 2’,7’-dichlorodihydrofluorescin diacetate (DCFH-DA) with quantification of (B) ROS level, (C) catalase (CAT) activity and (D) glutathione (GSH) content. All values presented correspond to mean ± SD of triplicates (n = 3). Values of # p < 0.05; ## p < 0.01 compared with control, and * p < 0.05; ** p < 0.01 compared with H2O2-treated group were considered as statistically significant. Scale bar denotes 100 μm.
Figure 5
Figure 5
Antioxidant activities of ethanolic extract (HE-ETH) on H2O2-treated HT22 neurons. HT22 was co-incubated with 250 μM H2O2 and 400 μg/mL HE-ETH before subjected to series of antioxidant assays. (A) Representative images of intracellular reactive oxygen species (ROS) stained by 2’,7’-dichlorodihydrofluorescin diacetate (DCFH-DA) with quantification of (B) ROS level, (C) catalase (CAT) activity and (D) glutathione (GSH) content. All values presented correspond to mean ± SD of triplicates (n = 3). Values of # p < 0.05; ## p < 0.01 compared with control, and * p < 0.05; ** p < 0.01 compared with H2O2-treated group were considered as statistically significant. Scale bar denotes 100 μm.
Figure 6
Figure 6
Improvement of mitochondrial functioning by ethanolic extract (HE-ETH) on H2O2-treated HT22 neurons. HT22 was co-incubated with 250 μM H2O2 and 400 μg/mL HE-ETH before subjected to series of assays to assess mitochondrial functions. (A) Representative images of mitochondrial membrane potential (MMP) stained by tetramethylrhodamine ethyl ester (TMRE) with quantification of (B) MMP, (C) mitochondrial toxicity and (D) ATP level. All values presented correspond to mean ± SD of triplicates (n = 3). Values of ## p < 0.01; #### p < 0.0001 compared with control, and * p < 0.05; *** p < 0.001; **** p < 0.0001 compared with H2O2-treated group were considered as statistically significant. Scale bar denotes 100 μm.
Figure 6
Figure 6
Improvement of mitochondrial functioning by ethanolic extract (HE-ETH) on H2O2-treated HT22 neurons. HT22 was co-incubated with 250 μM H2O2 and 400 μg/mL HE-ETH before subjected to series of assays to assess mitochondrial functions. (A) Representative images of mitochondrial membrane potential (MMP) stained by tetramethylrhodamine ethyl ester (TMRE) with quantification of (B) MMP, (C) mitochondrial toxicity and (D) ATP level. All values presented correspond to mean ± SD of triplicates (n = 3). Values of ## p < 0.01; #### p < 0.0001 compared with control, and * p < 0.05; *** p < 0.001; **** p < 0.0001 compared with H2O2-treated group were considered as statistically significant. Scale bar denotes 100 μm.
Figure 7
Figure 7
Anti-apoptotic activities of ethanolic extract (HE-ETH) on H2O2-treated HT22 neurons. HT22 was co-incubated with 250 μM H2O2 and 400 μg/mL HE-ETH before subjected to apoptosis assays. (A) Representative images of apoptotic nuclei stained by Hoechst 33258 with (B) ratio of apoptotic nuclei, (C) quantification of Bcl-2 and Bax mRNA expression, (D) ratio of Bcl-2/Bax and (E) caspase 3 activity. All values presented correspond to mean ± SD of triplicates (n = 3). Values of #### p < 0.0001 compared with control, and * p < 0.05; **** p < 0.0001 compared with H2O2-treated group were considered as statistically significant. Scale bar denotes 100 μm.
Figure 7
Figure 7
Anti-apoptotic activities of ethanolic extract (HE-ETH) on H2O2-treated HT22 neurons. HT22 was co-incubated with 250 μM H2O2 and 400 μg/mL HE-ETH before subjected to apoptosis assays. (A) Representative images of apoptotic nuclei stained by Hoechst 33258 with (B) ratio of apoptotic nuclei, (C) quantification of Bcl-2 and Bax mRNA expression, (D) ratio of Bcl-2/Bax and (E) caspase 3 activity. All values presented correspond to mean ± SD of triplicates (n = 3). Values of #### p < 0.0001 compared with control, and * p < 0.05; **** p < 0.0001 compared with H2O2-treated group were considered as statistically significant. Scale bar denotes 100 μm.
Figure 8
Figure 8
Analysis of transcriptional expression measured by qPCR. HT22 was co-incubated with 250 μM H2O2 and 400 μg/mL ethanolic extract (HE-ETH) before subjected to qPCR for quantification of (A) nuclear factor erythroid 2-related factor 2 (Nrf2), (B) NAD(P)H quinone dehydrogenase 1 (NQO1) and (C) heme oxygenase-1 (HO-1) mRNA expression. All values presented correspond to mean ± SD of triplicates (n = 3).
Figure 8
Figure 8
Analysis of transcriptional expression measured by qPCR. HT22 was co-incubated with 250 μM H2O2 and 400 μg/mL ethanolic extract (HE-ETH) before subjected to qPCR for quantification of (A) nuclear factor erythroid 2-related factor 2 (Nrf2), (B) NAD(P)H quinone dehydrogenase 1 (NQO1) and (C) heme oxygenase-1 (HO-1) mRNA expression. All values presented correspond to mean ± SD of triplicates (n = 3).

Similar articles

Cited by

References

    1. Ames B.N., Shigenaga M.K., Hagen T.M. Oxidants, antioxidants, and the degenerative diseases of aging. Proc. Natl. Acad. Sci. USA. 1993;90:7915–7922. doi: 10.1073/pnas.90.17.7915. - DOI - PMC - PubMed
    1. Swerdlow R.H., Burns J.M., Khan S.M. The Alzheimer’s disease mitochondrial cascade hypothesis. J. Alzheimers Dis. 2010;20(Suppl. 2):S265–S279. doi: 10.3233/JAD-2010-100339. - DOI - PMC - PubMed
    1. Guest J., Grant R., Mori T.A., Croft K.D. Changes in oxidative damage, inflammation and [NAD(H)] with age in cerebrospinal fluid. PLoS ONE. 2014;9:e85335. doi: 10.1371/journal.pone.0085335. - DOI - PMC - PubMed
    1. Lim J.L., Wilhelmus M.M.M., de Vries H.E., Drukarch B., Hoozemans J.J.M., van Horssen J. Antioxidative defense mechanisms controlled by Nrf2: State-of-the-art and clinical perspectives in neurodegenerative diseases. Arch. Toxicol. 2014;88:1773–1786. doi: 10.1007/s00204-014-1338-z. - DOI - PubMed
    1. Hroudová J., Singh N., Fišar Z. Mitochondrial dysfunctions in neurodegenerative diseases: Relevance to Alzheimer’s disease. BioMed Res. Int. 2014;2014:175062. doi: 10.1155/2014/175062. - DOI - PMC - PubMed