. 2019 Aug 1;11(8):371.
doi: 10.3390/pharmaceutics11080371.

Hydrodynamics of Intravitreal Injections into Liquid Vitreous Substitutes

Affiliations

Hydrodynamics of Intravitreal Injections into Liquid Vitreous Substitutes

Christin Henein et al. Pharmaceutics. .

Abstract

Intravitreal injections have become the cornerstone of retinal care and one of the most commonly performed procedures across all medical specialties. The impact of hydrodynamic forces of intravitreal solutions when injected into vitreous or vitreous substitutes has not been well described. While computational models do exist, they tend to underestimate the starting surface area of an injected bolus of a drug. Here, we report the dispersion profile of a dye bolus (50 µL) injected into different vitreous substitutes of varying viscosities, surface tensions, and volumetric densities. A novel 3D printed in vitro model of the vitreous cavity of the eye was designed to visualize the dispersion profile of solutions when injected into the following vitreous substitutes-balanced salt solution (BSS), sodium hyaluronate (HA), and silicone oils (SO)-using a 30G needle with a Reynolds number (Re) for injection ranging from approximately 189 to 677. Larger bolus surface areas were associated with faster injection speeds, lower viscosity of vitreous substitutes, and smaller difference in interfacial surface tensions. Boluses exhibited buoyancy when injected into standard S1000. The hydrodynamic properties of liquid vitreous substitutes influence the initial injected bolus dispersion profile and should be taken into account when simulating drug dispersion following intravitreal injection at a preclinical stage of development, to better inform formulations and performance.

Keywords: density; distribution; hyaluronic acid; hydrodynamics; intravitreal injection; surface tension; viscosity; vitreous.


Conflict of interest statement

The authors declare no conflict of interest.

Figures
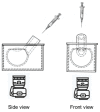
Figure 1
Figure 1
Schematic diagram of 3D printed model scaled to the geometry of an adult human eye. The vitreous cavity was completely filled with different vitreous substitutes. Dye (50 µL) was injected into the cavity via a 30G needle placed in the inlet of the model to standardize needle depth. Side (left) and front view (right) images acquired with a digital SLR camera (Canon EOS 7D). The camera was mounted with a 60 mm lens. Images were recorded at a speed of 25 Hz or every 40 ms.
Figure 2
Figure 2
Steps taken in digital image processing. Side view photograph of injected Coomassie blue solution into sodium hyaluronate (HA, 3.0 mg/mL) with a Re value of 145. Raw image (A) converted into red, green, and blue colors (B) after background subtraction (C) using MATLAB software.
Figure 3
Figure 3
Steps taken in digital image processing. Front view photograph of injected Coomassie blue solution into sodium hyaluronate (HA, 1.0 mg/mL) with a Re value of 156. Raw Image (A) converted into red, green, and blue colors (B) after background subtraction (C) using MATLAB software.
Figure 4
Figure 4
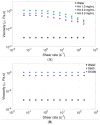
Viscosity of vitreous substitutes with an increasing shear rate (0–200 s−1) at 25 °C. (A) HA (1.0–3.0 mg/mL) exhibited a non-Newtonian and viscoelastic behavior and (B) SO (S500–S1000) exhibited a Newtonian fluid profile. The dynamic viscosity of water is reported on both graphs for comparison.
Figure 5
Figure 5
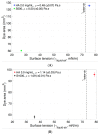
Interfacial surface tension of HA, SO (S500 and S1000), and (red dotted line) water with air at 25 °C.
Figure 6
Figure 6
Density ratio of HA (1.0–3.0 mg/mL), SO (S500 and S1000), and (red dotted line) water at 25 °C. S1000 had the highest density and S500 the lowest density from all the vitreous substitutes tested.
Figure 7
Figure 7
Theoretical changes in Re at different injection rates with varying needle gauges (25–33G). Re increased with smaller needle sizes for a fixed flow rate. The Re suggests that the flow pattern of IVT in clinically-relevant needle sizes tends to be laminar.
Figure 8
Figure 8
Contour plot of the dye concentration injected in different vitreous substitutes at low Re (189 ± 91), slow injection times (>1 s). (A,B) 1.0 mg/mL HA, (C,D) 2.0 mg/mL HA, (E,F) 3.0 mg/mL HA, (G,H) S500, (I,J) S1000, and (K,L) BSS. At slow injection rates, the injected bolus remained localized in all vitreous substitutes, thereby minimizing the stretching and spread of IVT.
Figure 9
Figure 9
Contour plot of the dye concentration injected in different vitreous substitutes at high Re (677 ± 175), fast injection times (<1 s). (A,B) 1.0 mg/mL HA, (C,D) 2.0 mg/mL HA, (E,F) 3.0 mg/mL HA, (G,H) S500, (I,J) S1000 and (K,L) BSS. The fast injection rate resulted in fluid engulfment, increasing the surface area and promoting mixing and diffusion.
Figure 10
Figure 10
Evolution of dye area against time in the case of fast injections (Re = 589) into the HA vitreous (1.0 mg/mL). The dye area was measured from images taken from a digital SLR camera at 25 Hz, or every 40 ms. The dye area reached a maximum area of 106 mm2 from the front view and 72 mm2 from the side view. This indicates the bolus is not perfectly spherical in shape and this assumption should be avoided when modeling IVT in liquid-phase vitreous.
Figure 11
Figure 11
(A) Schematic representation of dye area dispersion in vitreous substitute at different time points and (B) a typical velocity profile of dye injected into S1000 at a slow injection rate (Re: 189 ± 91). The velocity of the injected bolus was calculated from changes in bolus length (i.e., square root of the dye area) in time.
Figure 12
Figure 12
Average Rebolus within different vitreous substitutes at (black diamonds) fast and (red diamonds) slow injection rates.
Figure 13
Figure 13
Impact of (black diamonds) high and (red diamonds) low Re on the distribution of dye injected into HA (1.0–3.0 mg/mL) and SO (S500 and S1000). The surface area of the dye was considerably reduced with increasing HA concentrations at fast injection rates compared to slow injection rates. The bolus was more localized in all vitreous substitutes at slow injection speeds.
Figure 14
Figure 14
Correlation between bolus dye areas in HA vitreous substitutes. (A) Shear-zero viscosity and (B) velocity when dye was injected at high Re (677 ± 175).
Figure 15
Figure 15
The effect of surface tension on dye area at high Re into vitreous substitutes of equivalent viscosities. The higher surface tension difference between air/vitreous substitutes and air/water resulted in a lower injected dye dispersion area. (A) HA (2.0 mg/mL) and S500, (B) HA (3.0 mg/mL) and S1000 and (vertical black dotted line) the surface tension of water and air.
Figure 16
Figure 16
Contour plots of Coomassie blue dye injected into S500 and S1000. (A,B) Upward movement showing the buoyancy of injected bolus into S1000 (density: 1.09 g/mL) and (C,D) downward movement of the injected solution into S500 (density: 0.97 g/mL).
Figure 17
Figure 17
Side view contour plots of Coomassie blue dye injected into (A) 1.0, (B) 2.0 and (C) 3.0 mg/mL HA at high Re (677 ± 175) at needle depths of (upper panel) approximately 6 mm and (lower panel) 9 mm. Deeper needle placement may be preferable for delivering IVT.

Similar articles

Cited by

References

    1. Lau P.E., Jenkins K.S., Layton C.J. Current Evidence for the Prevention of Endophthalmitis in Anti-VEGF Intravitreal Injections. [(accessed on 24 July 2018)];J Ophthalmol. 2018 2018:1–8. doi: 10.1155/2018/8567912. Available online: https://www.hindawi.com/journals/joph/2018/8567912/ - DOI - PMC - PubMed
    1. Lamminsalo M., Taskinen E., Karvinen T., Subrizi A., Murtomäki L., Urtti A., Ranta V.P. Extended Pharmacokinetic Model of the Rabbit Eye for Intravitreal and Intracameral Injections of Macromolecules: Quantitative Analysis of Anterior and Posterior Elimination Pathways. [(accessed on 31 August 2018)];Pharm. Res. 2018 35:153. doi: 10.1007/s11095-018-2435-0. Available online: http://link.springer.com/10.1007/s11095-018-2435-0. - DOI - DOI - PubMed
    1. CATT Research Group. Martin D.F., Maguire M.G., Ying G., Grunwald J.E., Fine S.L., Jaffe G.J. Ranibizumab and bevacizumab for neovascular age-related macular degeneration. [(accessed on 19 May 2011)];N. Engl. J. Med. 2011 364:1897–1908. doi: 10.1016/j.ophtha.2012.03.053. Available online: http://scholar.google.com/scholar?hl=en&btnG=Search&q=intitle:new+englan.... - DOI - PMC - PubMed
    1. Tanzi M.G. Aflibercept: Bimonthly intravitreal injection for AMD. Pharm. Today. 2016;18:43. doi: 10.1016/j.ptdy.2016.11.019. - DOI
    1. Ghosh J.G., Nguyen A.A., Bigelow C.E., Poor S., Qiu Y., Rangaswamy N., Ornberg R., Jackson B., Mak H., Ezell T., et al. Long-acting protein drugs for the treatment of ocular diseases. Nat. Commun. 2017;8:14837. doi: 10.1038/ncomms14837. - DOI - PMC - PubMed