. 2019 Aug 1;8(8):1151.
doi: 10.3390/jcm8081151.

APEX1 Expression as a Potential Diagnostic Biomarker of Clear Cell Renal Cell Carcinoma and Hepatobiliary Carcinomas

Affiliations

APEX1 Expression as a Potential Diagnostic Biomarker of Clear Cell Renal Cell Carcinoma and Hepatobiliary Carcinomas

Ji-Myung Kim et al. J Clin Med. .

Abstract

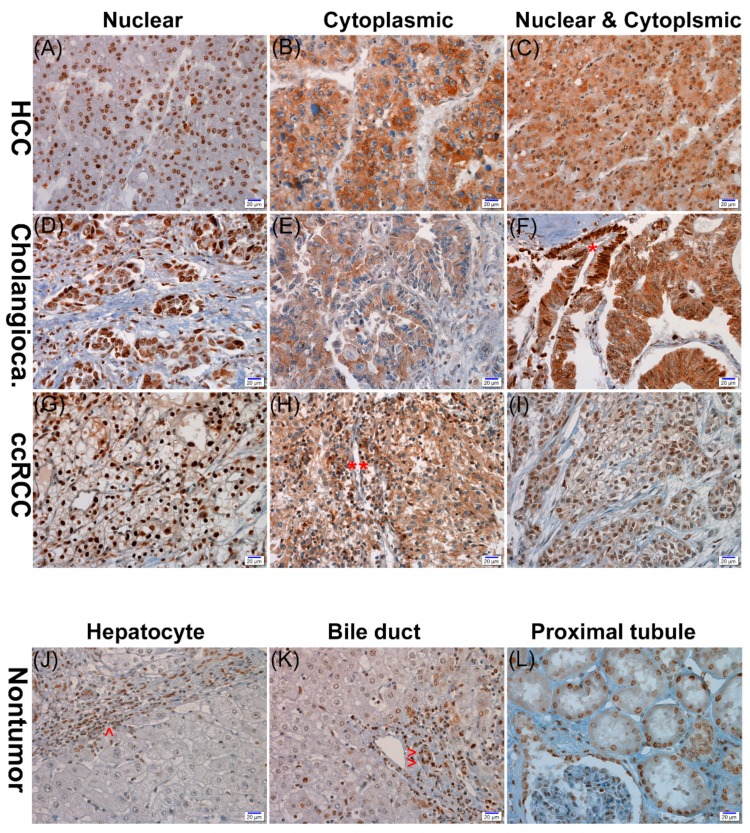
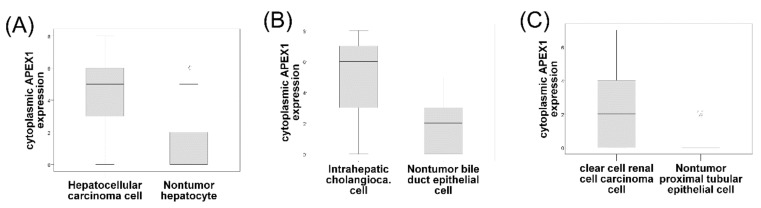
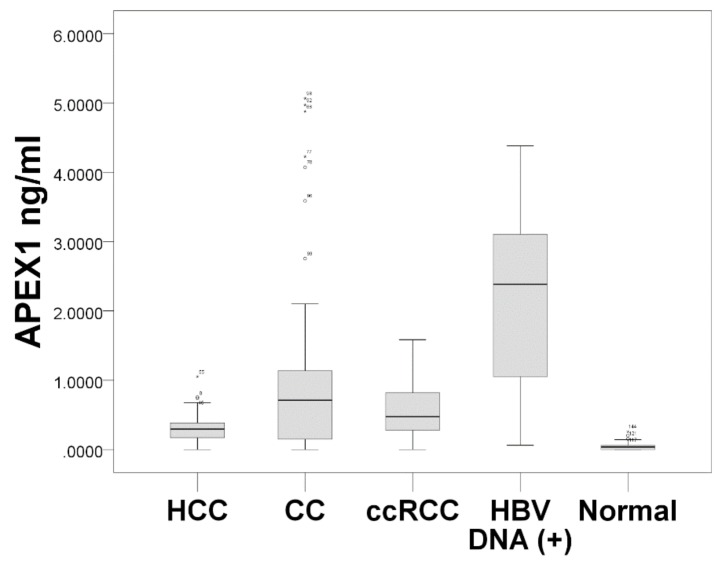
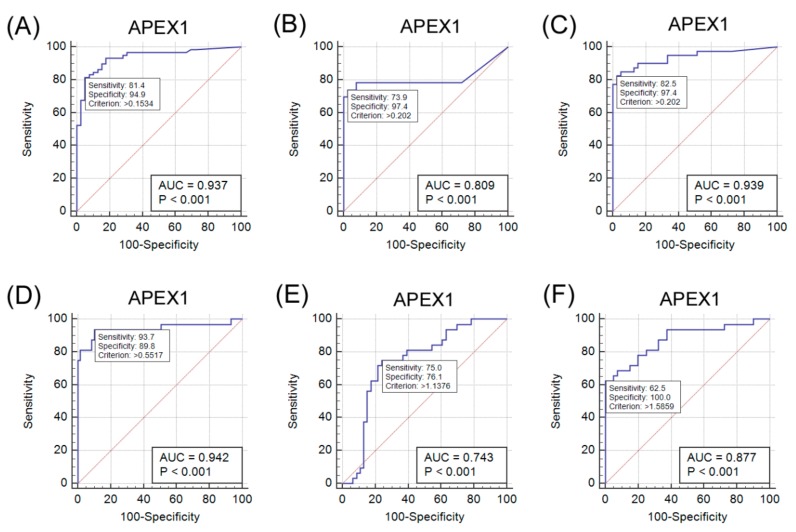
Apurinic/apyrimidinic endonuclease 1/redox effector factor 1 (APEX1) has been known to play key roles in DNA repair, the regulation of diverse transcriptional activity, and cellular responses to redox activity. This study aimed to examine serum APEX1 (s-APEX1) expression as a possible screening biomarker for clear cell renal cell carcinoma (ccRCC), hepatocellular carcinoma (HCC), and proximal and distal cholangiocarcinoma (CC). A total of 216 frozen serum samples were collected from 39 healthy control cases, 32 patients with ≥58 copies/mL of hepatitis B viral DNA (HBV DNA (+)), 40 ccRCC cases, 59 HCC cases, and 46 CC cases. The serum samples were examined for s-APEX1 concentration by enzyme-linked immunosorbent assay. The association of APEX1 expression with clinicopathological characteristics was also studied by immunohistochemical staining in 106 ccRCC, 131 HCC, and 32 intrahepatic CC cases. The median s-APEX1 concentrations of the HCC, CC, ccRCC, healthy control, and HBV DNA (+) groups were 0.294, 0.710, 0.474, 0.038, and 2.384 ng/mL, respectively (p < 0.001). Univariate and multivariate analyses revealed that increased cytoplasmic APEX1 expression led to a shorter disease-free survival period in HCC and CC cases. We suggest that the s-APEX1 level could be a potential diagnostic biomarker of ccRCC, HCC, and CC. Additionally, cytoplasmic APEX1 expression in cancer cells could be used to predict relapses in patients with HCC or CC.

Keywords: apurinic/apyrimidinic endonuclease 1/redox effector factor 1; cholangiocarcinoma; clear cell renal cell carcinoma; diagnosis; hepatocellular carcinoma.


Conflict of interest statement

The authors declare no conflicts of interest. The funders had no role in the design of the study; the collection, analyses, or interpretation of data; the writing of the manuscript, or in the decision to publish these results.

Figures

Figure 1
Figure 1
Representative photographs of APEX1 immunohistochemical staining in hepatocellular carcinoma (HCC) (AC), cholangiocarcinoma (Cholangioca) (DF), and clear cell renal cell carcinoma (ccRCC) (GI). The three cancers show nuclear, cytoplasmic, or nuclear and cytoplasmic expression of APEX1. The nontumor proliferative biliary epithelium (*) expresses nuclear staining, while the cholangiocarcinoma cells show both nuclear and cytoplasmic expression (F). Inflammatory cells (**) exhibit cytoplasmic staining (H). No APEX1 expression in nontumor hepatocytes in contrast to the high nuclear expression in inflammatory cells (^) (J). Positive nuclear expression in nontumor bile duct epithelial cells (^^) (K). Positive nuclear expression in proximal convoluted tubular epithelial cells (L) (scale bar = 20 μm).
Figure 2
Figure 2
Cytoplasmic expression of the APEX1 protein in 131 paired cases of hepatocellular carcinoma cells and the matched nontumor hepatocytes (A), 32 paired cases of intrahepatic cholangiocarcinoma cells and the matched nontumor bile duct epithelial cells (B), and 106 paired cases of clear cell renal cell carcinoma cells and the matched nontumor proximal convoluted tubular epithelial cells (C), using immunohistochemical staining for formalin-fixed, paraffin-embedded tissue (Wilcoxon signed-rank test: p < 0.001, each). The line in the middle of the boxes is the median. The box length indicates the interquartile range. The ends of the whiskers represent maximum and minimum values.
Figure 3
Figure 3
Comparison of the s-APEX1 levels among hepatocellular carcinoma (HCC), cholangiocarcinoma (CC), clear cell renal cell carcinoma (ccRCC), HBV DNA (+) (HBV DNA ≥ 58 copies/mL), and heathy control groups (Kruskal–Wallis test: p < 0.001). The dark line in the middle of the boxes is the median. The box length indicates the interquartile range. The ends of the whiskers represent maximum and minimum values.
Figure 4
Figure 4
Analysis of the diagnostic value of serum APEX1 for hepatocellular carcinoma (HCC), cholangiocarcinoma (CC), and clear cell renal cell carcinoma (ccRCC) by receiver operating characteristic (ROC) curves. (AC) ROC curves for the serum APEX1 levels to separate the HCC, CC, or ccRCC group from the healthy control. (DF) ROC curves for the serum APE1/Red-1 levels to separate HBV DNA (+) from the HCC, CC, or ccRCC group. (A) ROC curve: HCC (+) vs. healthy control group (−), 95% confidence interval: 0.869–0.976. (B) ROC curve: CC (+) vs. healthy control group (–), 95% confidence interval: 0.709–0.886. (C) ROC curve: ccRCC (+) vs. healthy control group (–), 95% confidence interval: 0.862–0.981. (D) ROC curve: HBV DNA (+) (+) vs. HCC (–), 95% confidence interval: 0.873–0.980. (E) ROC curve: HBV DNA (+) (+) vs. CC (–), 95% confidence interval: 0.631–0.835. (F) ROC curve: HBV DNA (+) (+) vs. ccRCC (–), 95% confidence interval: 0.778–0.942.

References

    1. Tell G., Damante G., Caldwell D., Kelley M.R. The intracellular localization of APE1/Ref-1: More than a passive phenomenon? Antioxid. Redox Signal. 2005;7:367–384. doi: 10.1089/ars.2005.7.367. - DOI - PubMed
    1. O’Hara A.M., Bhattacharyya A., Mifflin R.C., Smith M.F., Ryan K.A., Scott K.G., Naganuma M., Casola A., Izumi T., Mitra S., et al. Interleukin-8 induction by Helicobacter pylori in gastric epithelial cells is dependent on apurinic/apyrimidinic endonuclease-1/redox factor-1. J. Immunol. 2006;177:7990–7999. doi: 10.4049/jimmunol.177.11.7990. - DOI - PubMed
    1. Lee H.M., Yuk J.M., Shin D.M., Yang C.S., Kim K.K., Choi D.K., Liang Z.L., Kim J.M., Jeon B.H., Kim C.D., et al. Apurinic/apyrimidinic endonuclease 1 is a key modulator of keratinocyte inflammatory responses. J. Immunol. 2009;183:6839–6848. doi: 10.4049/jimmunol.0901856. - DOI - PubMed
    1. Cheng T.L., Chen P.S., Li R.H., Yuan S.S., Su I.J., Hung J.H. Induction of apurinic endonuclease 1 overexpression by endoplasmic reticulum stress in hepatoma cells. Int. J. Mol. Sci. 2014;15:12442–12457. doi: 10.3390/ijms150712442. - DOI - PMC - PubMed
    1. Yuan C.L., He F., Ye J.Z., Wu H.N., Zhang J.Y., Liu Z.H., Li Y.Q., Luo X.L., Lin Y., Liang R. APE1 overexpression is associated with poor survival in patients with solid tumors: A meta-analysis. Oncotarget. 2017;8:59720–59728. doi: 10.18632/oncotarget.19814. - DOI - PMC - PubMed