. 2019 Sep 25;103(6):1016-1033.e10.
doi: 10.1016/j.neuron.2019.07.002. Epub 2019 Jul 30.

Development of a Chimeric Model to Study and Manipulate Human Microglia In Vivo

Affiliations

Development of a Chimeric Model to Study and Manipulate Human Microglia In Vivo

Jonathan Hasselmann et al. Neuron. .

Abstract

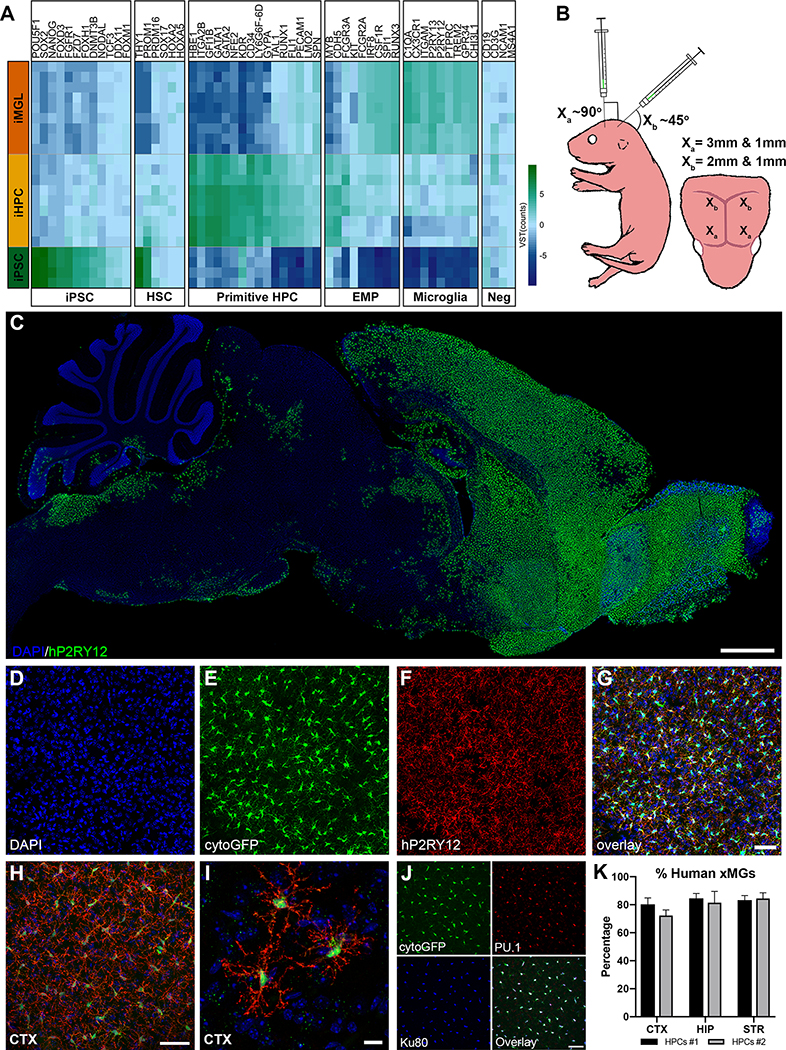
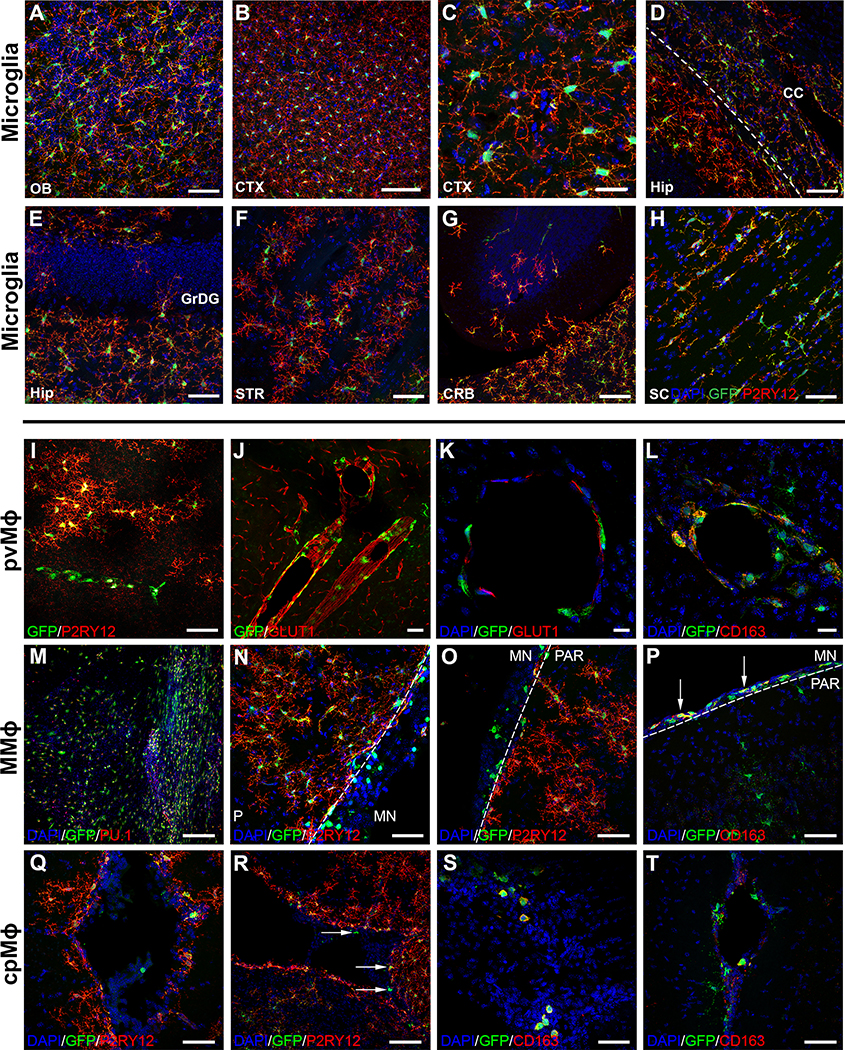
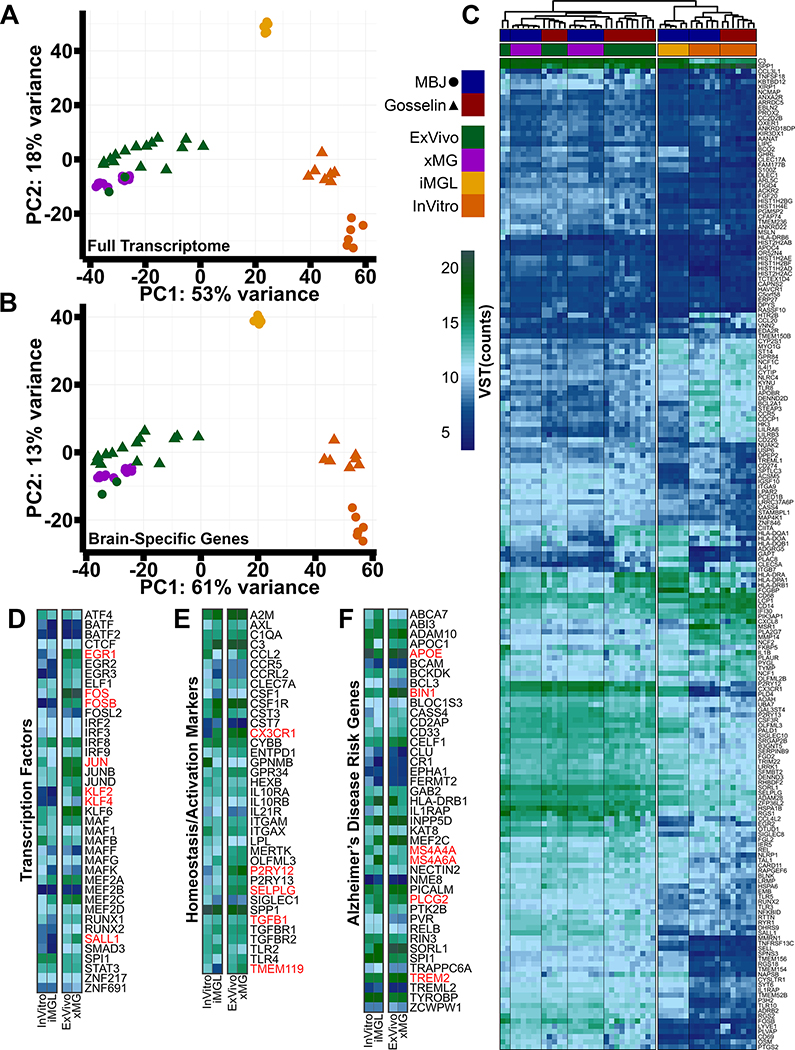
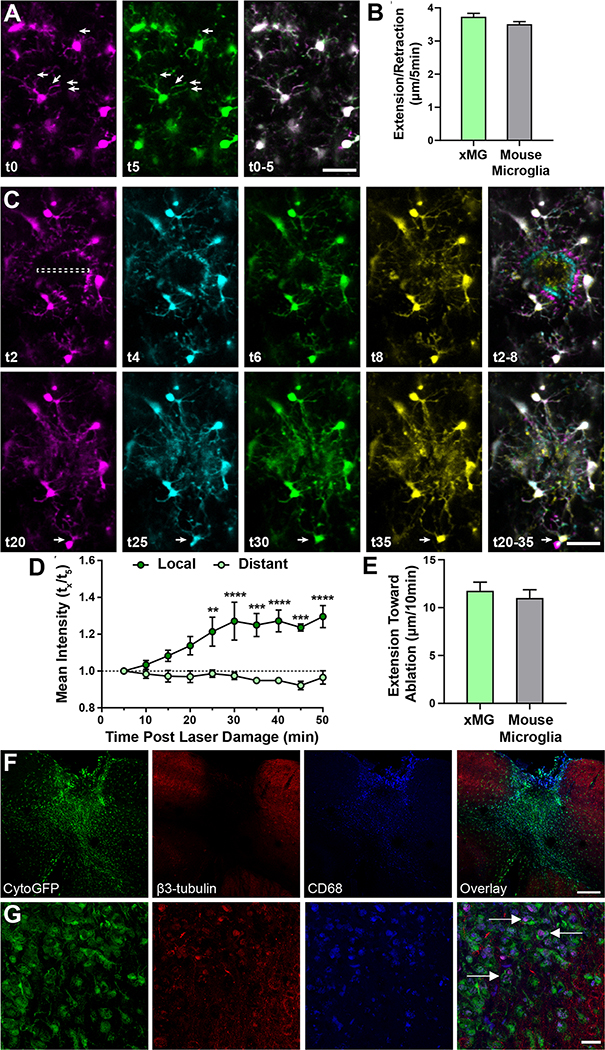
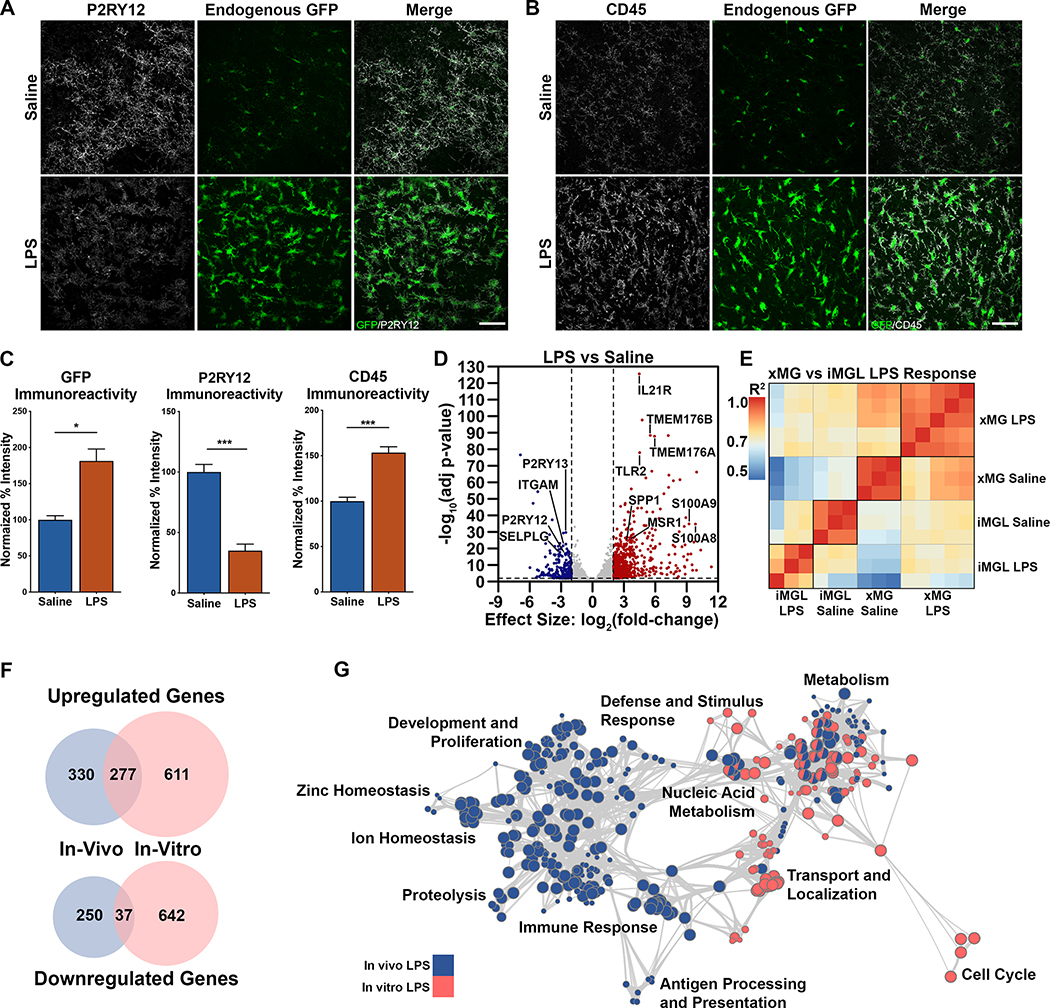
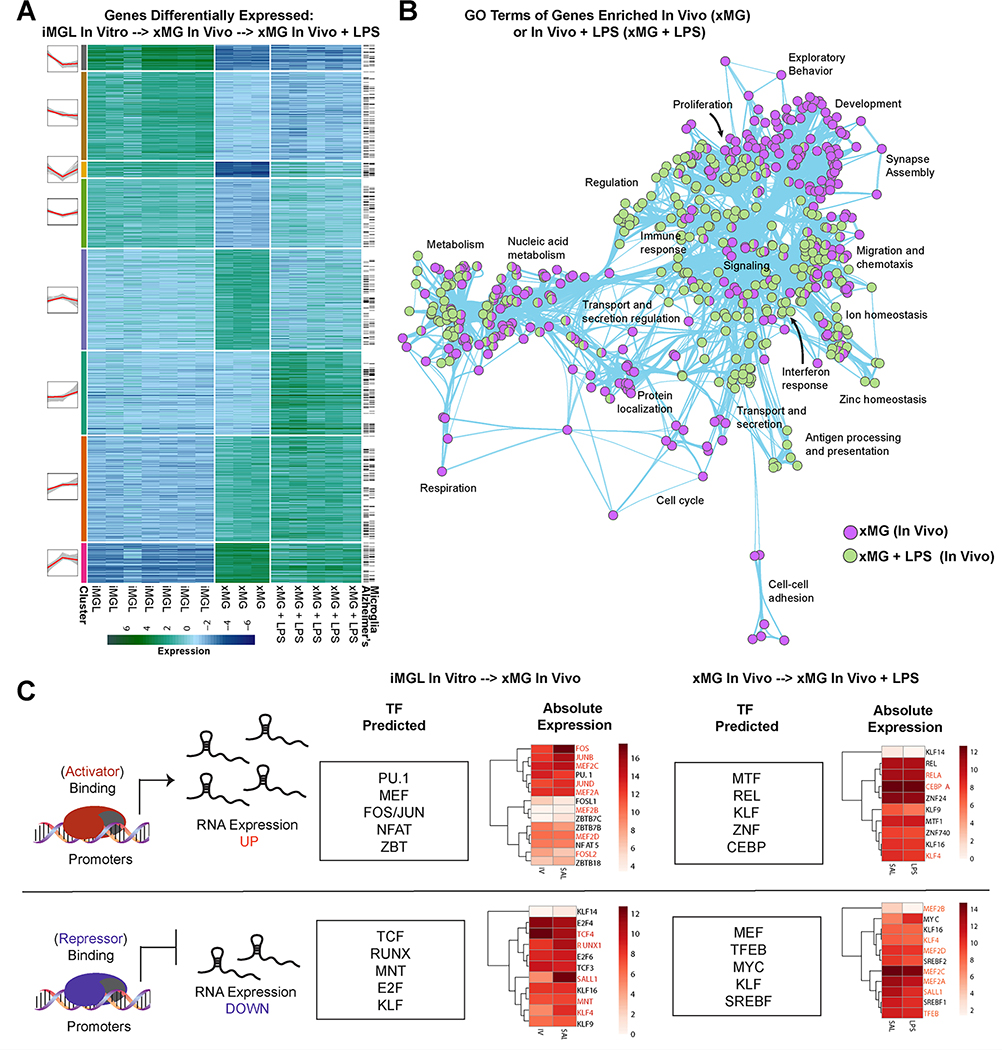
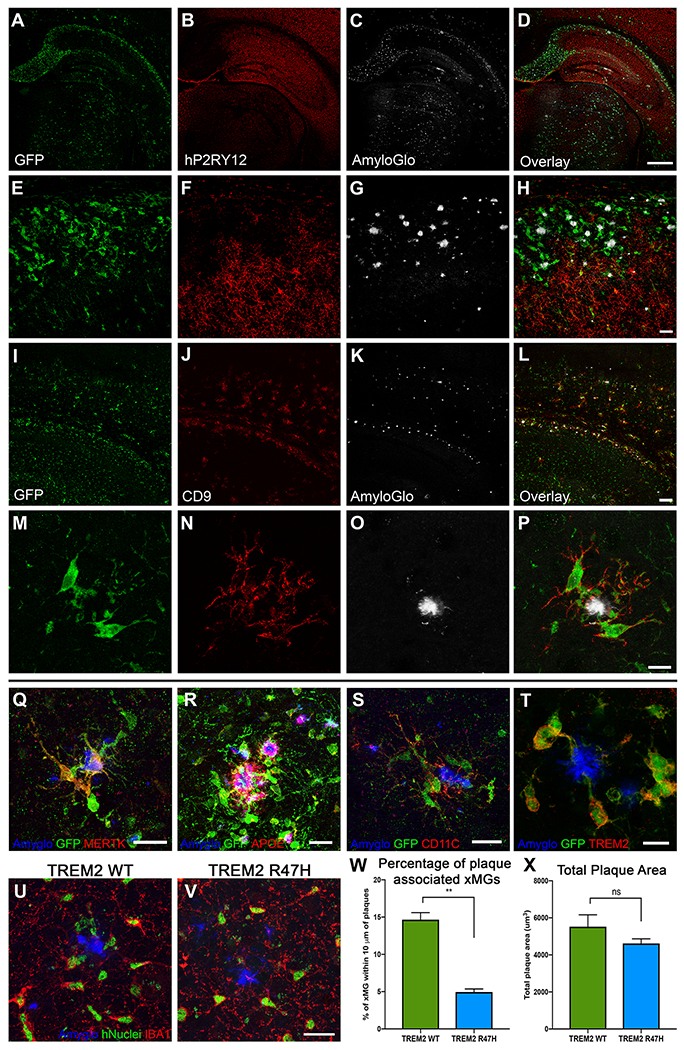
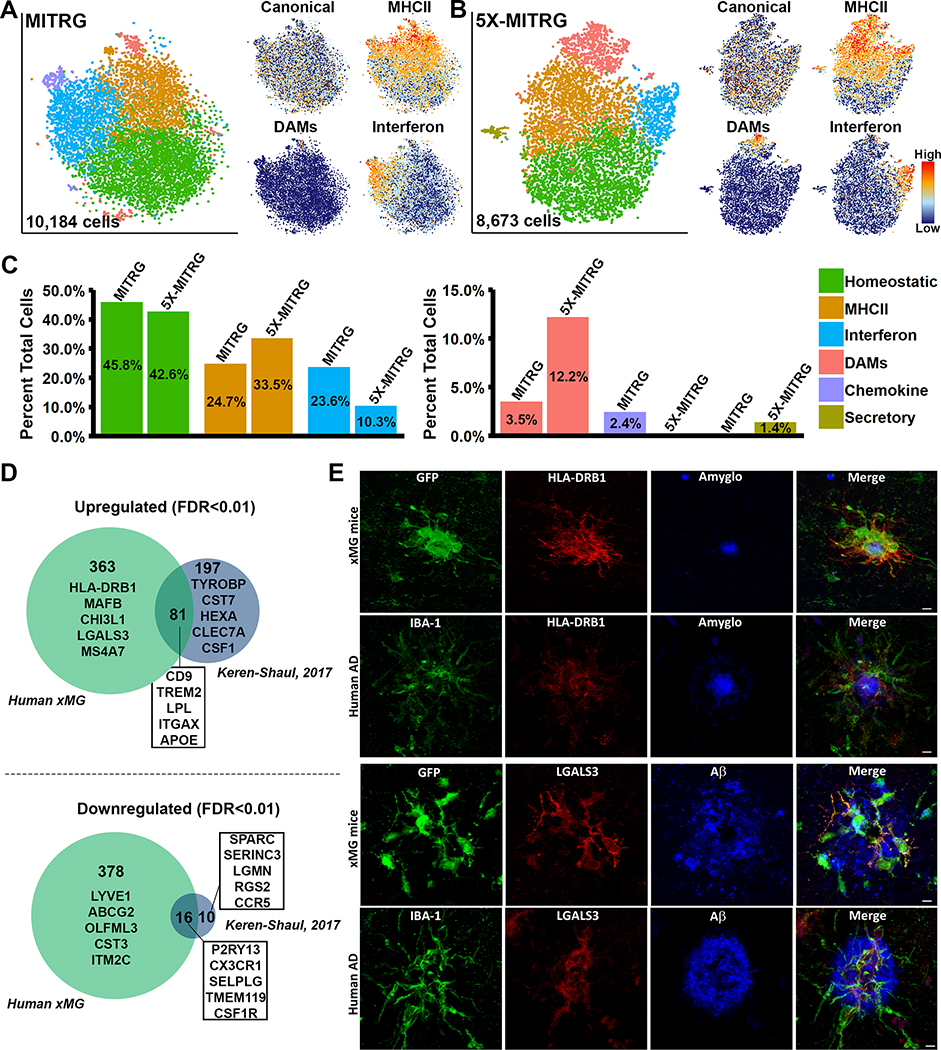
iPSC-derived microglia offer a powerful tool to study microglial homeostasis and disease-associated inflammatory responses. Yet, microglia are highly sensitive to their environment, exhibiting transcriptomic deficiencies when kept in isolation from the brain. Furthermore, species-specific genetic variations demonstrate that rodent microglia fail to fully recapitulate the human condition. To address this, we developed an approach to study human microglia within a surrogate brain environment. Transplantation of iPSC-derived hematopoietic-progenitors into the postnatal brain of humanized, immune-deficient mice results in context-dependent differentiation into microglia and other CNS macrophages, acquisition of an ex vivo human microglial gene signature, and responsiveness to both acute and chronic insults. Most notably, transplanted microglia exhibit robust transcriptional responses to Aβ-plaques that only partially overlap with that of murine microglia, revealing new, human-specific Aβ-responsive genes. We therefore have demonstrated that this chimeric model provides a powerful new system to examine the in vivo function of patient-derived and genetically modified microglia.

Keywords: Alzheimer’s disease; TREM-2; beta-amyloid; chimera; hematopoietic; humanized; microglia; neurodegeneration; pluripotent; stem cells.


Figures

Figure 1.
Figure 1.. iPSC-derived human HPCs differentiate into microglia and display robust engraftment within the forebrain of MITRG mice.
(A) A heatmap comparing iPSC, iHPC, and iMGL (McQuade et al., 2018) across a sampling of genes related to iPSC, hematopoietic stem cell (HSC), primitive HPC, erythromyeloid progenitor (EMP), and microglia lineages, along with lineage negative (Neg) genes, shows that iHPCs most closely resemble primitive HPCs but also express some EMP markers. (B) Schematic of transplantation paradigm. (C) Human P2RY12 staining displays the overall migration and distribution of xMGs 2 months after P1 transplantation (P2RY12, pseudocolored green; DAPI, blue). (D-G) Transplanted cells display near complete co-localization of cytosolic eGFP (green) with human P2RY12 (red). (H-I) Engrafted cells uniformly tile in the cortex and take on a highly ramified morphology. (J) Colocalization of (Green, cytoGFP), PU.1 (Red, all myeloid nuclei) and Ku80 (pseudocolored blue, human nuclei only) was used to quantify xMG engraftment. (K) Percentage of xMG engraftment in the cortex (CTX), the hippocampus (HIP), and the striatum (STR) from two separate experiments (HPCs #1 and HPCs #2). In some cases, brightness and contrast settings of confocal images were adjusted to reveal fine structures and morphology. Scale = 1mm (C), 50μm (G, H, & J), 10μm (I) See also Figures S1 & S2.
Figure 2.
Figure 2.. Transplanted iHPCs adapt to diverse niches within the brain and differentiate into the four CNS macrophage subtypes in a context-dependent manner.
(A-H) High power images demonstrate the variety of morphological features xMGs display during homeostatic conditions, including neat tiling and complex ramifications in (A) the olfactory bulb (OB) and (B-C) the neocortex (CTX). (D) Within the corpus callosum (CC) overlying the hippocampus (Hip), xMGs exhibit a more elongated morphology with a diminished expression of P2YR12. (E-F) Consistent with normal anatomical distributions, xMGs also tend to avoid the granule cell layer of the dentate gyrus (GrDG) and the axon-bundles within the striatum (STR). (G-H) Remarkably, xMGs also migrate to parts of the cerebellum (CRB) and spinal cord (SC). (I-L) A subset of GFP+ cells exhibit an amoeboid morphology, linear organization, and lack the homeostatic microglia marker, P2RY12. These cells also encircle GLUT1+ blood vessels, localize to the perivascular space (J, K), and express CD163 (L) suggesting a perivascular macrophage (pvMϕ) phenotype. (M) Another population of GFP+/PU.1+ cells display robust engraftment in meningeal whole mounts. (N-O) These ameboid shaped meningeal macrophages (mMϕ) and can also be found in sections where parts of the meninges (MN) were preserved and are distinct from the fully ramified GFP+/hP2RY12+ microglia within the parenchyma (PAR). (P) Similar to the pvMϕ, these mMϕ are also GFP+/hP2RY12/CD163+ (arrows). (Q-T) A few GFP+/hP2RY12/CD163+ choroid plexus macrophage-like (cpMϕ) cells can be found within the choroid plexus (arrows). In some images, brightness and contrast settings were adjusted. Scale = 50μm (A, D-J, N-Q, S, T), 25μm (C, K), 20μm (L), 100μm (B, M, R).
Figure 3.
Figure 3.. Transplantation of human iHPCs into the murine brain recapitulates an in vivo human transcriptome.
(A) PCA plot, including 16,413 genes, comparing freshly isolated human microglia (ExVivo, green; n=17 patients), xMGs (purple; 3 iHPC cell lines, n=3–6 mice per line, 13 mice total), iMGLs (yellow; n=6 wells), and cultured human microglia (InVitro, orange; n=13 patients) from our lab (MBJ, circles) or the Gosselin samples (triangles). ExVivo microglia and xMGs cluster together while both in vitro groups (iMGLs and InVitro) cluster separately. (B) PCA comparing the 3,432 differentially expressed genes between the Gosselin ExVivo and InVitro microglia (FDR=0.05, LFC cutoff=±2). Again, xMGs cluster closely with ExVivo microglia, demonstrating that transplantation recovered a brain-dependent microglia signature. (C) Heatmap comparing sample groups from our lab (MBJ, Blue) and Gosselin et al. (Red) based on the top 190 brain-dependent microglia signature genes. Euclidean clustering shows samples cluster by environment (in vivo or in vitro) and xMG samples are intermixed with ExVivo microglia samples. (D) xMGs express transcription factors at levels that are comparable to ExVivo microglia, many of which were either lowly or not expressed in vitro (red text). (E) xMGs express microglia signature genes and activation markers, including P2RY12, TGFB1, and CX3CR1, at comparable levels to ExVivo microglia, suggesting that xMGs have taken on a homeostatic transcriptomic profile. xMGs also express the brain-dependent microglial gene TMEM119, which was not previously expressed in iMGLs. (F) xMGs express AD risk genes at levels that coincide with non-AD ExVivo microglia. This finding demonstrates that xMGs could be accurate surrogates for AD studies in mouse models. Heatmaps in D-F represent VST normalized expression values, averaged for all samples in a group. See also Figures S3 & S4 and Table S1.
Figure 4.
Figure 4.. xMGs survey their surroundings, rapidly respond to laser ablation, and interact with neuronal components after trauma.
Human microglia were visualized using multiphoton in vivo imaging in (A) homeostasis and (C) following focal, high intensity laser exposure. (A) Time coded colorization of homeostatic xMGs demonstrate high process motility, actively surveying their niches. Overlaid color images of t0–5 min. (right) more clearly reveals the morphological dynamics of individual cells (also see Video S1). (B) The average length of extension/retraction in 5 minutes found in xMGs (3.73±0.10μm, n=300 observations, 3 mice) was not different from those found in mouse microglia (3.51±0.08μm, n=300 observations, 3 mice) (p=0.25, U=42581). (C) Time coded colorization of microglial response to focal damage reveals that processes rapidly move toward and surround the site of injury within 8 minutes post laser ablation. At later timepoints (t25-t35), some microglia outside the direct injury region translocate (white arrow), positioning their cell bodies closer to the injury (also see Video S2). (D) The mean intensity at the injury site (local, dark green) is higher than the mean intensity 150um away (distant, light green), showing that xMG processes rapidly localize to the injury site (repeated measures two-way ANOVA, p = 0.006. Scale = 50μm). (E) The average length of extension toward the ablation site in 10 minutes by xMGs (11.76±0.90μm, n=22 observations, 3 mice) is similar to those by mouse microglia (11.01±0.87μm, n=37 observations, 3 mice) (p=0.34, U=346). (F-G) Transplanted MITRG mice underwent repeat mild closed head injury (rmCHI) and histological analysis was performed 2-months post-injury. (F) GFP+ xMGs infiltrate the injury site and express increased levels of CD68 (blue). (G) Higher-power images of GFP+ xMGs reveal β3-tubulin (red) and CD68 (blue) colocalized within xMGs (white arrows), indicative of microglial phagocytosis of neuronal components. All error bars reflect SEM. Scale = 200μm (F), 20μm (G). See also Videos S1 & S2.
Figure 5.
Figure 5.. Differential responses of xMGs and iMGLs to lipopolysaccharide administration.
(A) xMGs treated with saline exhibit strong staining for the homeostatic microglial protein P2RY12 (pseudocolored gray) and cytosolic GFP expression (green). In contrast, LPS-treated xMGs downregulate P2RY12, whereas GFP intensity increases along with distinct alterations in microglial morphology (Scale=50μm). (B) An upregulation of CD45 immunoreactivity (gray) can been seen after LPS treatment (Scale=50μm). (C) Quantification of GFP reveals a significant increase in intensity with LPS stimulation (p=0.0107) accompanied by a significant decrease in P2RY12 intensity (p=0.0003), and a significant increase in CD45 intensity (p=0.0004). (D) DGE analysis between microglia isolated from saline and LPS-treated animals revealed 607 upregulated genes (red, right) and 287 downregulated genes (blue, left) (FDR=0.01, LFC cutoff=±2; Table S4). Many upregulated genes (labeled, right) have been implicated in immune activation while a number of downregulated genes (labeled, left) have been described as markers of microglia homeostasis. (E) Pearson correlation matrix comparing the entire transcriptome of each in vivo (xMG) saline and LPS treated sample with each in vitro (iMGL) saline and LPS treated sample. Heatmap colors correspond to R2 values and samples are clustered via Euclidean distancing. (F) Venn diagram comparing in vivo and in vitro LPS-induced, differentially expressed genes (FDR=0.01, LFC cutoff=±2), demonstrating few conserved changes. (G) Gene ontology overrepresentation analysis and GO term clustering reveals unique regulation depending on LPS treatment environment, with limited overlap between in vivo (blue) and in vitro (pink) groups. Bar plots represent mean±SEM. See also Figure S5 and Tables S1, S4, & S5.
Figure 6:
Figure 6:. xMG gene expression profiles are indicative of known microglial activation signatures.
(A) Heatmap of differentially expressed genes from the same GFP iPSC line differentiated into microglia in vitro versus GFP-xMGs in vivo, versus in vivo GFP-xMGs activated with LPS. Black lines on the right indicate genes that have previously been implicated in Alzheimer’s Disease and/or microglial biology. (B) Network graph of enriched GO terms generated from (A), when comparing up-regulated genes from in vitro, to in vivo, to in vivo with LPS stimulation. Nodes represent individual GO terms (gene sets), and edges represent the relatedness between them. (C) Summary of predicted transcription factors and their association with genes up- or down-regulated between states. Heatmaps represent their expression levels at each state. See also Tables S1 & S6.
Figure 7.
Figure 7.. xMGs down-regulate homeostatic markers and upregulate activation markers around Aβ plaques.
Representative images of xMGs in the hippocampus and subiculum of the 5X-MITRG at 9-months. (A-H) The homeostatic marker P2RY12 is downregulated in plaque-associated xMGs while more distal xMGs continue to express P2RY12. (cytosolic GFP, green; P2RY12, pseudocolored red; fibrillar amyloid (AmyloGlo), gray). (I-P) Plaque-associated xMGs also display and increase in the DAM gene CD9, while distal cells do not (cytosolic GFP, green; CD9, red; fibrillar amyloid (AmyloGlo), gray). (Q-T) Additionally, plaque-associated xMGs upregulate other DAM markers, including MERTK (Q), human APOE (R), CD11C (S), and TREM2 (T). (U-X) 5X-MITRG mice were transplanted with xMGs possessing either WT TREM2 (U) or a homozygous R47H mutation (V) and aged to 9 months. Quantification of xMG migration towards Aβ plaques (blue, Amyglo) revealed a significant decrease in plaque-associated R47H-expressing xMGs (green, hNuclei/Ku80; red, IBA1), but no significant difference in total plaque burden (X). ** p<0.001, scale=500um (A-D), 100um (E-L), 20um (M-S; U-V), 10um (T). See also Video S3.
Figure 8.
Figure 8.. Single-cell sequencing of xMGs from MITRG and MITRG-5X mice reveals altered population distributions and human-specific genetic responses.
(A) tSNE plot of 10,184 xMGs isolated from 10.5-month-old MITRG mice (n=2) reveals multiple clusters defined by genes related to MHC class II (Orange; HLA-DRB1, HLA-DPB1, HLA-DQA1, and CD74), Type I Interferon (Blue; IFI6, IRF7, ISG15, STAT1, and IFIT3), DAMs (Salmon; CD9, TREM2, LPL, and ITGAX), Inflammatory chemokines (Purple; CCL2, CXCL10, CCL8, and CXCL11), and a “homeostatic” cluster (Green) that was mainly defined by a lack of activation markers. Additionally, canonical microglia markers (P2RY12, P2RY13, CX3CR1, and TMEM119) showed a uniform distribution across all clusters besides DAMs. (B) tSNE plot of 8,673 xMGs isolated from 10.5 and 12-month-old 5X-MITRG mice (n=4) reveals similar clusters to the MITRG xMGs. Exceptions include the addition of a secretory cluster (Olive; ANAX3, AGR2, PLAC8, and PLA2G7) the loss of a clearly defined chemokine cluster. (C) Bar plot comparing the percentage of total cells making up each cluster in WT MITRG and 5X-MITRG tSNE plots. (D) DAM genes, reported by Keren-Shaul et al. (2017), from 5XfAD murine microglia were filtered to contain only genes defined by Ensembl or NCBI Homologene to have 1:1 human orthologs. Remaining genes were then compared to the differentially expressed genes between DAM and homeostatic xMGs (FDR≤0.01) demonstrating that limited overlap exists between the human xMG and mouse DAM genes. (E) Protein-level validation of human-specific DAM genes HLA-DRB1 (top) and LGALS3 (bottom) in both 5X-MITRG and human AD brain sections. See also Figure S6 and Table S7.

Comment in

References

    1. Abud EM, Ramirez RN, Martinez ES, Healy LM, Nguyen CHH, Newman SA, Yeromin AV, Scarfone VM, Marsh SE, Fimbres C, et al. (2017). iPSC-Derived Human Microglia-like Cells to Study Neurological Diseases. Neuron 94, 278–293 e279. - PMC - PubMed
    1. Allen M, Kachadoorian M, Carrasquillo MM, Karhade A, Manly L, Burgess JD, Wang C, Serie D, Wang X, Siuda J, et al. (2015). Late-onset Alzheimer disease risk variants mark brain regulatory loci. Neurol Genet 1, e15. - PMC - PubMed
    1. Andrews S (2014). FastQC: a quality control tool for high throughput sequence data.
    1. Ashburner M, Ball CA, Blake JA, Botstein D, Butler H, Cherry JM, Davis AP, Dolinski K, Dwight SS, Eppig JT, et al. (2000). Gene ontology: tool for the unification of biology. The Gene Ontology Consortium. Nat Genet 25, 25–29. - PMC - PubMed
    1. Bennett FC, Bennett ML, Yaqoob F, Mulinyawe SB, Grant GA, Hayden Gephart M, Plowey ED, and Barres BA (2018). A Combination of Ontogeny and CNS Environment Establishes Microglial Identity. Neuron 98, 1170–1183 e1178. - PMC - PubMed

Publication types

MeSH terms

Substances