. 2019 Aug 20;51(2):337-350.e7.
doi: 10.1016/j.immuni.2019.07.001. Epub 2019 Jul 30.

Class-Switch Recombination Occurs Infrequently in Germinal Centers

Affiliations

Class-Switch Recombination Occurs Infrequently in Germinal Centers

Jonathan A Roco et al. Immunity. .

Abstract

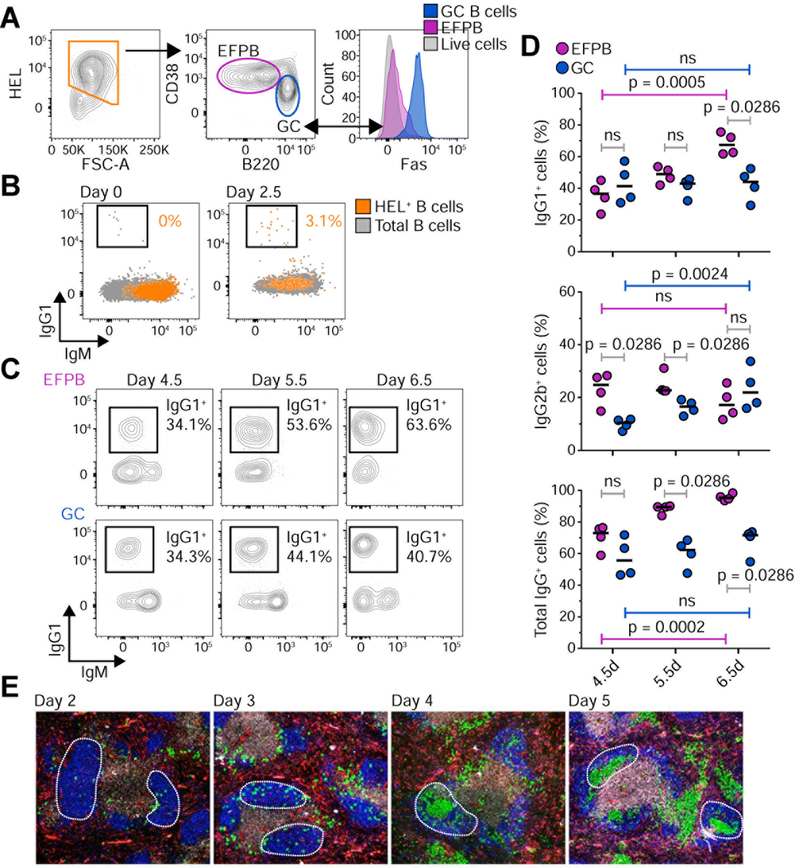
Class-switch recombination (CSR) is a DNA recombination process that replaces the immunoglobulin (Ig) constant region for the isotype that can best protect against the pathogen. Dysregulation of CSR can cause self-reactive BCRs and B cell lymphomas; understanding the timing and location of CSR is therefore important. Although CSR commences upon T cell priming, it is generally considered a hallmark of germinal centers (GCs). Here, we have used multiple approaches to show that CSR is triggered prior to differentiation into GC B cells or plasmablasts and is greatly diminished in GCs. Despite finding a small percentage of GC B cells expressing germline transcripts, phylogenetic trees of GC BCRs from secondary lymphoid organs revealed that the vast majority of CSR events occurred prior to the onset of somatic hypermutation. As such, we have demonstrated the existence of IgM-dominated GCs, which are unlikely to occur under the assumption of ongoing switching.


Conflict of interest statement

Competing interests

The authors declare no competing interests.

Figures

Figure 1.
Figure 1.. Isotype switching commences prior to germinal center onset.
A) Adoptive transfer protocol of SWHEL B cells and HEL2x-SRBCs into congenic recipient mice (see STAR Methods). B) Immunofluorescence images of spleen sections collected from recipient mice as in (A). Sections were stained for SWHEL B cells (red), IgD (green), and CD3 (blue). Scale bars = 200μm. C–D) Representative flow cytometric plots showing gating strategy to identified donor-derived SwHEL B cells after adoptive transfer (C) and expression (D) of BLIMP1 vs CXCR5 or B220, and Fas vs CXCR5 in HEL-binding B cells recovered 5 days after challenge as shown in (A). E) qPCR gene expression profile of purified donor-derived SWHEL B cells for γ1-GLT, γ2b-GLT, Aicda, and Bcl6. Data was normalized to the reference gene Ubc and is presented as a fold-change compared to day 3.5 values using the ∆∆CT method. Dots represent the mean of pooled biological replicates as in (C). Data is representative of two independent experiments. n = number of recipient mice used at each time point. See also Fig. S1 and S2.
Figure 2.
Figure 2.. Class switching proceeds at comparable rates in germinal centers and extrafollicular sites and early visualization of germline transcription in a polyclonal response.
A) Flow cytometric plots showing gating strategy employed to identify donor-derived SWHEL B cells after immunization as shown in Figure 1. B–C) Flow cytometric analysis for surface expression of IgG1 and IgM in naïve (day 0), activated (day 2.5) (B), EFPB and GC SWHEL B cells (day 4.5 – 6.5) (C). Numbers indicate the percentage of donor-derived HEL+ IgG1+ cells. D) Quantification of IgG1, IgG2b and total IgG in EFPBs and GC B cells as shown in (C). Bars represent medians and dots individual mice (n=4). Horizontal grey bars show comparisons between EFPB and GC subsets at the same time point (Mann-Whitney U test). Horizontal purple and blue bars show comparisons between EFPBs or GC B cells (Kruskal-Wallis test), respectively. Numbers on top of bars indicate the respective p-value. ns = not significant. E) Immunofluorescence images of spleen sections from Cγ1-Cre:mT/mG mice after SRBC immunization at the indicated time points: CD3 (grey), IgD (blue), Cγ1-Cre (green) and non-activated B cells (red). Data is representative of two (A–D) and three (E) independent experiments. See also Fig. S2.
Figure 3.
Figure 3.. Single cell analysis of germline transcripts in early activated and GC B cells.
A–B) Flow cytometry plots showing gating strategy to purify HEL-binding B cells after HEL2x-SRBC immunization. Donor-derived cells were single cell purified as IgM+HEL+ B blasts (day 3) (A) and IgM+HEL+ GC B cells (day 6.5) (B). GC B cells were subdivided as either DZ or LZ cells based on CXCR4 and CD86 expression as shown. C) Heatmap showing single cell qPCR expression profile of selected targets in B blasts, DZ and LZ SWHEL B cells purified as described in (A–B). D) Quantification of raw CT values for γ1-GLT, γ2b-GLT, Aicda, Bcl6 and Apex1 obtained in (C). Violin plots depict data distribution; each dot represents an individual cell. E) Pie charts showing quantification of target genes as shown in (D). Numbers indicate the percentage of cells expressing the indicated target. The limit of detection for analysis was set to 40 cycles, cells with a CT value < 40 were considered positive events. NTC = no template control. Bulk = bulk population control of 20 cells. Data is representative of two independent experiments. See also Fig. S3.
Figure 4.
Figure 4.. Expression of GLTs remains low in late GC responses
A) Adoptive transfer protocol of B1–8hi tdTomato (tdT) B cells to investigate the early phases of the immune response to NP-CGG (see STAR methods). B) Flow cytometric plots showing gating strategy to identify B1–8hi tdT+ B cells as shown in (A). Top panel shows representative plots of CD38 vs Fas for donor-derived B1–8hi tdT+ B cells and bottom panel the profile for recipient cells in the same mouse. C) qPCR gene expression profile for γ1-GLT in purified donor-derived B1–8hi tdT+ B cells as for (A-B). See (F) for details. D) Adoptive transfer protocol of B1–8hi tdT+ B cells to investigate the late phases of the immune response to NP-GCC. C57BL/6 mice were immunized as shown in (A). E) Flow cytometric plots showing gating strategy to analyze surface expression of total IgG at day 2 (top panel) and days 4–18 (bottom panel) in splenocytes harvested from mice immunized as in (D). F) qPCR gene expression profile for γ1-GLT in purified donor-derived B1–8hi tdT+ B cells as shown in (D). Duplex qPCR analyses were conducted using Actb as reference gene. Data is presented as a fold-change compared to day 1.0 B cells (C) or day 4 GC B cells (F) using the ∆∆CT method. Dots represent individual mice. Black dotted lines connect the group medians. G–H) Flow cytometric quantification of total IgG in donor-derived B1–8hi tdT+ cells (G) and total numbers of B1–8hi tdT+ GC B cells (H) in the spleens of recipient mice identified as in (D). Number of mice used in each time point: day 2 (n=5), day 4 (n=5), day 8 (n=4), day 14 (n=5) and day 18 (n=5). Total cell numbers were normalized to 1×10⁶ splenocytes. Data is representative of three independent experiments. See also Fig. S4.
Figure 5.
Figure 5.. Lack of ongoing switching in IgM+ B cells from established germinal centers and in silico modelling
A) Schematic representation of the clonal and isotype composition of the GCs obtained from the popliteal lymph nodes (pLNs) of GFP-PA mice immunized 15 or 20 days earlier with CGG in alum. Each column represents a single GC and the boxes in each column represent individual clones determined by phylogenetic analysis of single cell mRNA VH sequences. The size of each box has been scaled to reflect the number of cells in each clone. Grey represents IgG+ B cells and green represents IgM+ B cells, as determined by Igh mRNA sequences. The boxes outlined in black indicate those selected for the somatic mutation analysis depicted in (B), based on mixed composition by both IgG+ and IgM+ cells, and the presence of 4 or more IgM+ cells (see STAR methods). B) Charts showing clonal trees representing the phylogeny of VH sequences within B cell clones (symbols according to the legend in the bottom panel). C) Summary of the data in (A-B) showing the SHM content of individual B cells at the time of the inferred switch event (filled red arrowheads). Clones containing only IgM+ cells (empty red arrowheads) were pooled with those in which switching occurred at the level of the unmutated precursor (zero mutations). For each time point 5 different mice in 3 independent experiments were included. D-F) Histograms showing distribution of IgG fractions at the end of affinity maturation in silico in (D) constant switching probability of p = 0.03, (E) constant switching probability combined with an increased probability of IgG+ cells to leave the GC and (F) dynamic switching with an initial switching probability of p = 0.15 and a decaying switching probability of γ = 0.035 h−1 (see Fig. 1E). Each distribution shows the fraction of IgG+ B cells at day 21 after the onset of the GC reaction. G) Effect of class switch timing on the diversity of Ig-isotypes in simulated GCs. tswitch (horizontal axis) denotes the time post GC onset (time post immunization minus 3.5 days) at which CSR is started with a decreasing probability. Each point corresponds to the interquartile range of the IgG fraction among B cells at the end of in silico GC reactions in 400 simulations. See also Fig. S5 and S6.
Figure 6.
Figure 6.. APE1 is downregulated in human GC B cells and its expression is modulated by BCL6
A) Barplot showing expression of human BCL6, AICDA, UNG, APEX1, and APEX2 genes from purified tonsillar naïve B cells and GC B cells by RNA-seq. Data is presented as the log2 fold-change between reads per kilobase per million reads (RPKMs) of GC B cells relative to those on naïve B cells. The bars represent means and error bars ± standard deviations. Dots represent individual donors (n=5). B) Immunofluorescence images of human tonsil samples showing APE1 (red), IgD (green), and DAPI (blue). Scale bars = 200μm. C) Flow cytometric plots showing the gating strategy to purify naïve, DZ and LZ B cells from human tonsils. Activated B cells correspond to naïve B cells stimulated in vitro for 72h with IL-21 and CD40L. D) Immunoblot of human APE1 protein in naïve, DZ, LZ and activated B cells.β-actin was used as a loading control. E) Quantification of APE1 protein by densitometry as for blot in (D). APE1 expression was normalized using β-actin. Data is presented as a fold-change relative to naïve B cells. Horizontal black bars represent means and dotted grey lines connect samples derived from the same tonsil donor. Numbers on top indicate the respective p-value from two-tailed paired t-test analysis, n = 3 donors. F) Regions where BCL6 binds to the promoter region of the genes encoding for APE1 (APEX1), APE2 (APEX2), BCL6 and TLR1, as determined by ChIP on chip (Ci et al., 2009). See also Fig. S6.

Comment in

References

    1. Al-Safi RI, Odde S, Shabaik Y, and Neamati N (2012). Small-molecule inhibitors of APE1 DNA repair function: an overview. Curr Mol Pharmacol 5, 14–35. - PubMed
    1. Audzevich T, Pearce G, Breucha M, Gunal G, and Jessberger R (2013). Control of the STAT6-BCL6 antagonism by SWAP-70 determines IgE production. J Immunol 190, 4946–4955. - PubMed
    1. Bernasconi NL, Traggiai E, and Lanzavecchia A (2002). Maintenance of serological memory by polyclonal activation of human memory B cells. Science 298, 2199–2202. - PubMed
    1. Binder SC, and Meyer-Hermann M (2016). Implications of Intravital Imaging of Murine Germinal Centers on the Control of B Cell Selection and Division. Front Immunol 7, 593. - PMC - PubMed
    1. Brink R, Paus D, Bourne K, Hermes JR, Gardam S, Phan TG, and Chan TD (2015). The SW(HEL) system for high-resolution analysis of in vivo antigen-specific T-dependent B cell responses. Methods Mol Biol 1291, 103–123. - PubMed

Publication types

Substances