. 2019 Oct 7;216(10):2394-2411.
doi: 10.1084/jem.20182124. Epub 2019 Aug 2.

Specific targeting of CD163+ TAMs mobilizes inflammatory monocytes and promotes T cell-mediated tumor regression

Affiliations

Specific targeting of CD163+ TAMs mobilizes inflammatory monocytes and promotes T cell-mediated tumor regression

Anders Etzerodt et al. J Exp Med. .

Abstract

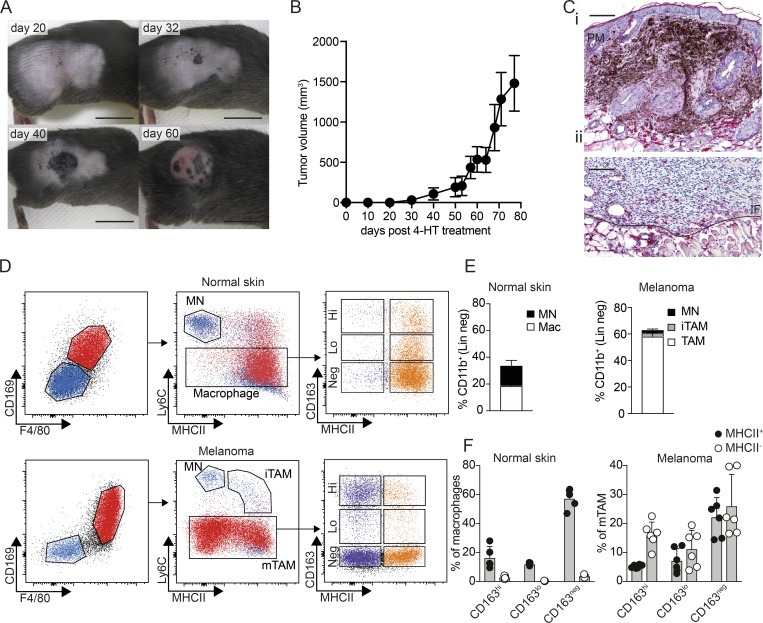
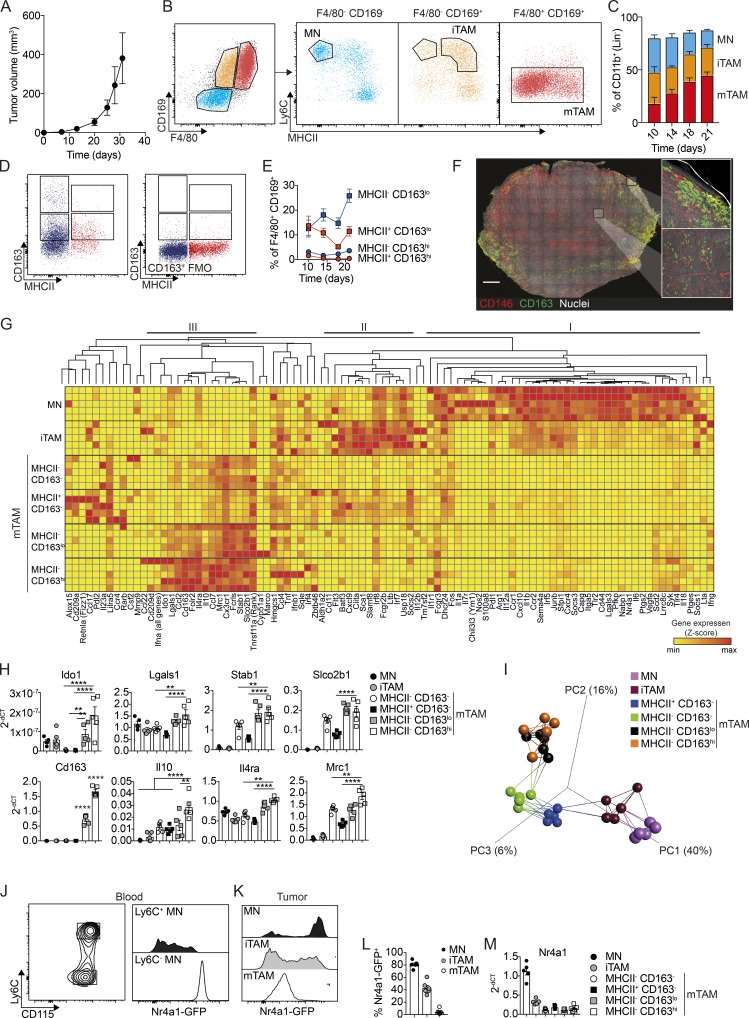
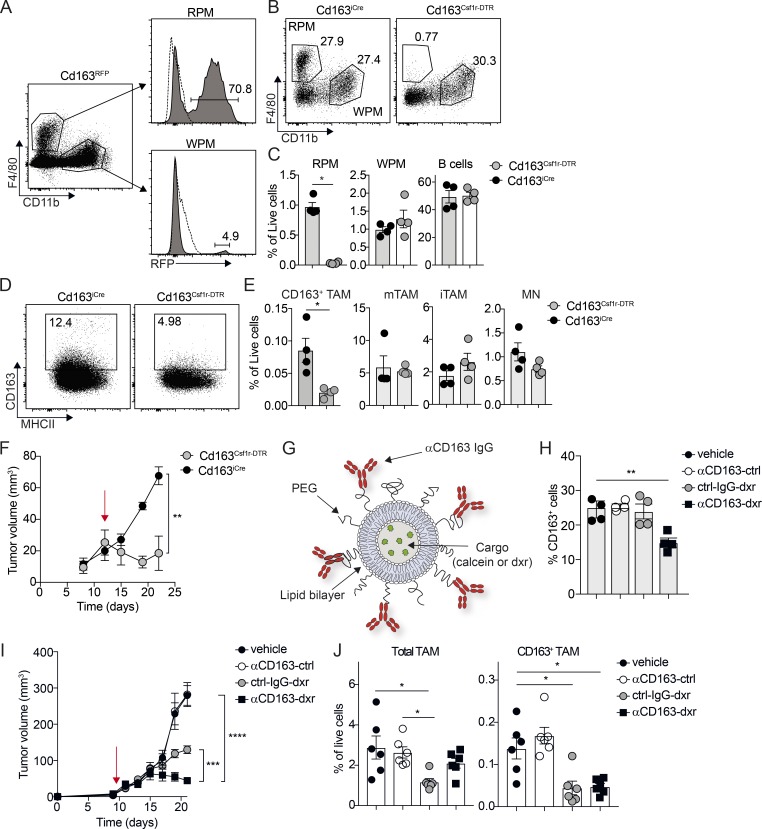
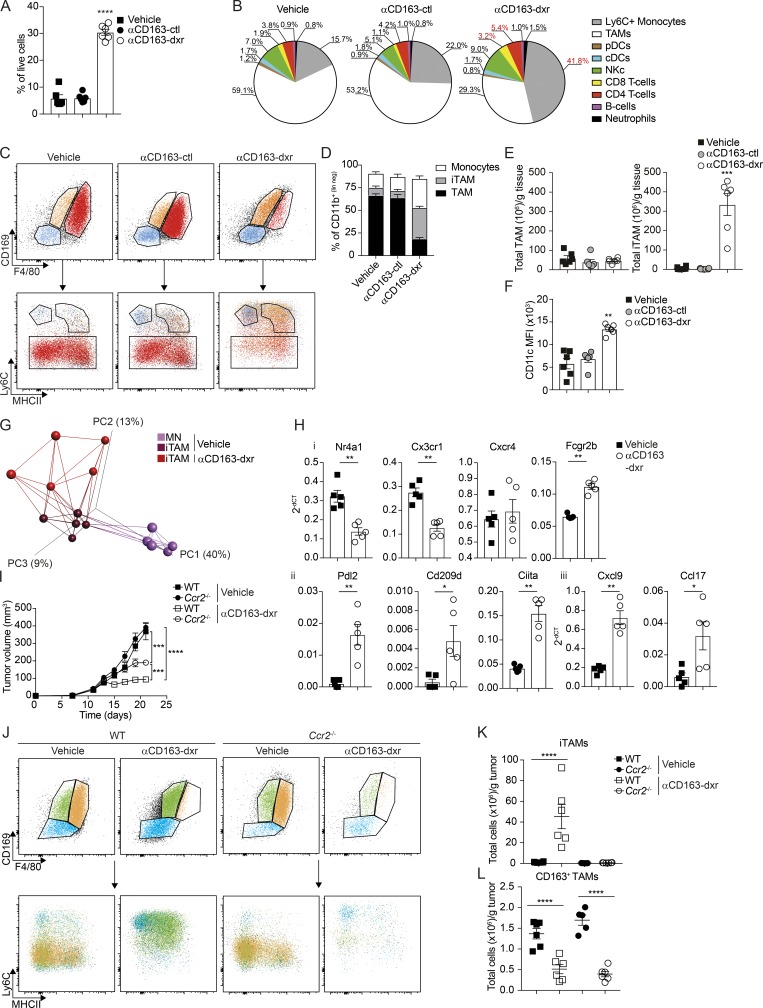
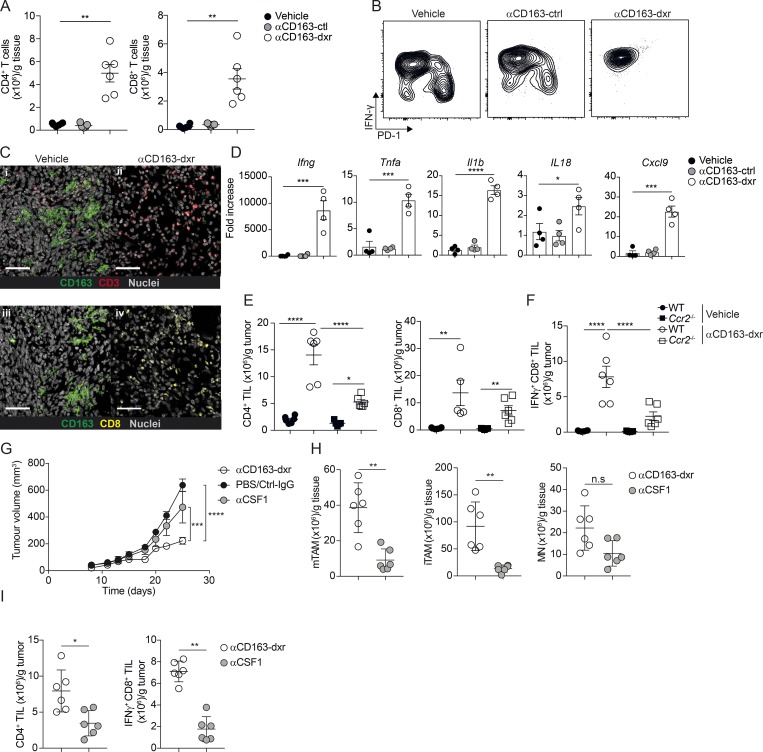
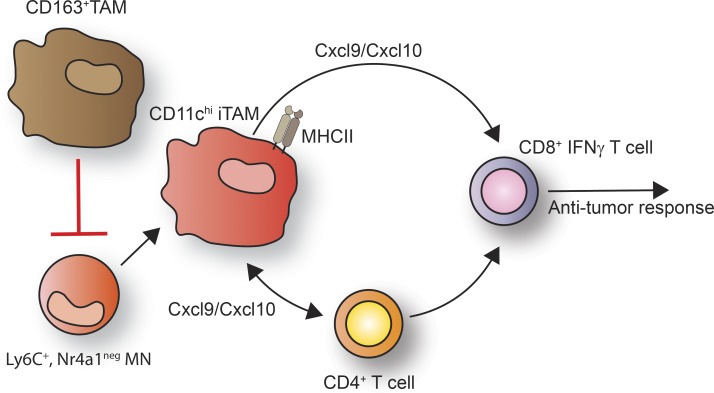
Tumor-associated macrophages (TAMs) play critical roles in tumor progression but are also capable of contributing to antitumor immunity. Recent studies have revealed an unprecedented heterogeneity among TAMs in both human cancer and experimental models. Nevertheless, we still understand little about the contribution of different TAM subsets to tumor progression. Here, we demonstrate that CD163-expressing TAMs specifically maintain immune suppression in an experimental model of melanoma that is resistant to anti-PD-1 checkpoint therapy. Specific depletion of the CD163+ macrophages results in a massive infiltration of activated T cells and tumor regression. Importantly, the infiltration of cytotoxic T cells was accompanied by the mobilization of inflammatory monocytes that significantly contributed to tumor regression. Thus, the specific targeting of CD163+ TAMs reeducates the tumor immune microenvironment and promotes both myeloid and T cell-mediated antitumor immunity, illustrating the importance of selective targeting of tumor-associated myeloid cells in a therapeutic context.


Figures

None
Graphical abstract
Figure 1.
Figure 1.
CD163-expressing macrophages infiltrate spontaneous BrafV600E-driven melanomas. (A and B) Development of melanomas in Tyr(CreER, BrafCA, Ptenf/f) mice after application of 4-HT on the right rear flank; scale bars, 1 cm. (C) IHC staining for CD163 (red) on sections from pigmented premelanotic lesions (PM) 32 d after 4-HT (i) and invasive tumors at endpoint (ii). The invasive front (IF) is marked by the solid line. Scale bars, 100 µm. Images are representative of three independent experiments (n = 4). (D) Flow cytometry analysis of macrophages in normal skin or TAMs in late-stage tumors. Myeloid cells, excluding neutrophils, were gated as CD45+, Lin (CD5, CD19, NK1.1, Siglec F, Ly6G), CD11b+. MNs were gated as F4/80, CD169, Ly6C+, MHCII; iTAMs were F4/80, CD169, Ly6C+, MHCII+; and mTAMs were defined as F4/80+, CD169+, Ly6C, MHCII+/−. The distribution of CD163 and MHCII expression among macrophages in normal skin and mTAMs is shown (see Fig. S1 C for the full gating strategy). (E and F) Relative proportions of MNs, iTAMs, mTAMs, and macrophages among myeloid cells in normal skin or tumor-associated myeloid cells (E) and proportion of CD163hi, CD163lo, and CD163 macrophages and TAMs (F). Data are pooled from three independent experiments (n = 6) and represented as mean ± SEM. Mac, macrophage.
Figure 2.
Figure 2.
Characterization of CD163-expressing TAMs in subcutaneous BrafV600E-driven melanomas. (A) Kinetics of tumor development after s.c. injection of 106 YUMM1.7 cells. (B) Flow cytometry analysis of TAMs in YUMM1.7 tumors. Myeloid cells, excluding neutrophils, were gated as CD45+, Lin (CD5, CD19, NK1.1, Siglec F, Ly6G), CD11b+. MNs were gated as F4/80, CD169, Ly6C+, MHCII; iTAMs as F4/80, CD169, Ly6C+, MHCII+; and mTAMs as F4/80+, CD169+, Ly6C, MHCII+/−. See Fig. S1 C for the full gating strategy. (C) Proportions of MNs, iTAMs, and mTAMs within the myeloid cell compartment at the indicated time points. (D) The distribution of CD163 and MHCII expression among mTAMs; CD163+ TAM (left) were gated based on the fluorescence minus one (FMO) control for CD163 staining (right). (E) Relative proportion of CD163+ TAMs among mTAMs in YUMM1.7 tumors at the indicated time points; data are represented as mean ± SEM of n = 4. (F) Immunofluorescence staining for CD163 (green) and CD146 (indicating blood vessels, red) and nuclei (Hoechst, white) in a 200-µm-thick vibratome cross section of an entire tumor. Image was acquired as a tile-scan with Z-stacks using 10× objective and subsequent processed in 3D (left). High-resolution images was acquired as single Z-stack and processed in 3D (right). Scale bar, 1,000 µm. (G) High-throughput gene expression analysis of MN, iTAM, and mTAM subsets: (1) MHCII CD163, (2) MHCII+ CD163, (3) MHCII CD163lo, and (4) MHCII CD163hi (see Fig. S2 D for full gating strategy). Z-scores were calculated by subtracting the ΔCT(sample) from the ΔCT(mean) across all samples. (H) Relative gene expression (2−ΔCT) of Cd163, Il10, Il4ra, Mrc1, Stab1, Slco2b1, Ido1, and Lgals in MN and TAM subsets. (I) PCA and network analysis of gene expression data highlighting the five nearest neighbors. PCA analysis was performed on normalized data (mean = 0 and variance = 1) generating a correlation based PCA plot. Network analysis connects k nearest neighbors (k = 5) based on similarity calculated by Pearson correlation. (J–L) Flow cytometry analysis of blood MNs (J) and tumor-associated MNs, iTAMs, and mTAMs (K) from Nr4a1GFP mice; histograms show GFP expression in MNs, iTAMs, and mTAMs and the proportion of GFP+ cells (L). (M) Relative Nr4a1 gene expression in MN, iTAM, and mTAM subsets. Data are represented as mean ± SEM of n = 5. All statistically significant differences were calculated using Kruskal–Wallis one-way ANOVA followed by Dunn’s multiple comparisons test; **, P < 0.01; ***, P < 0.001; ****, P < 0.0001. All data are representative of a minimum of two independent experiments.
Figure 3.
Figure 3.
Specific depletion of CD163-expressing TAMs promotes tumor regression. (A) Flow cytometry analysis of spleen from Cd163iCre/+ × Rosa26lsl-RFP/+ mice (Cd163RFP); RPMs were gated as CD45+, Lin (CD3, CD19, NK1.1, Ly6G) F4/80+, CD11b and WPMs as CD45+, Lin (CD3, CD19, NK1.1, Ly6G) F4/80, CD11b+. Histograms show relative RFP expression in RPMs and WPMs. (B and C) Flow cytometry analysis of spleen from Cd163iCre/+ × Csf1rlsl-DTR/+ mice (Cd163Csf1r-DTR). RPMs, WPMs, and B cells were analyzed in spleen 24 h after a single injection of 4 ng/kg DT; Cd163iCre/+ littermate control mice injected with DT were used as controls. Representative FACS plots for RPM/WPM analysis (B) and quantification of RPM, WPMs, and B cells in spleen (C) are shown. (D and E) Depletion of CD163+ TAMs in YUMM1.7 melanomas from Cd163Csf1r-DTR mice upon a single injection of 4 ng/kg DT. Representative FACS plots for CD163+ TAMs (D) and quantification of CD163+ TAMs and total TAM, iTAM, and MN in tumors from treated mice (E) are shown. Statistically significant differences were calculated using the Mann–Whitney U test; *, P < 0.05. (F) Tumor growth after sustained depletion of CD163+ TAMs with repeated DT injection; cohorts of Cd163Csf1r-DTR and Cd163iCre/+ mice bearing palpable tumors were treated with 4 ng/kg DT twice a week for 2 wk and tumor volume measured (red arrow indicates initiation of treatment). Statistically significant differences were calculated using a two-way ANOVA followed by Tukey post hoc test; **, P < 0.01. (G) Schematic illustration of αCD163 antibody–conjugated LNPs. PEG, polyethylene glycol. (H) Depletion of CD163-expressing macrophages in spleen after one injection of αCD163-LNP loaded with dxr; mice were injected with dxr-loaded αCD163-LNP (αCD163-dxr), IgG control-LNP (ctrl-IgG-dxr), empty αCD163-LNP (αCD163-ctrl), or PBS alone (vehicle). After 24 h, RPMs were analyzed in spleen by flow cytometry and the proportion of CD163+ RPMs determined. (I) Mice bearing palpable tumors were randomized into groups and treated as in H every second day for 2 wk and tumor volume measured (red arrow indicates initiation of treatment). (J) At endpoint, total TAM and CD163+ TAMs were analyzed by flow cytometry and frequency of live cells calculated. Data in graphs are represented as mean ± SEM of n = 4–6, and results are representative of three independent experiments. Statistically significant differences were calculated using a Kruskal–Wallis one-way ANOVA followed by Dunn’s multiple comparisons test; *, P < 0.05; **, P < 0.01; ***, P < 0.001; **** P < 0.0001.
Figure 4.
Figure 4.
Targeted depletion of CD163+ TAM reeducates TIM cells. Mice bearing palpable tumors were randomized into groups and treated as in Fig. 3; tumors were collected at endpoint for analysis by flow cytometry. (A and B) Total leukocyte infiltration (A; CD45+ cells) and high-content unsupervised immunophenotyping analysis after therapeutic depletion of CD163+ TAMs (B; see Fig. S4 C for definitions of populations). cDCs, conventional dendritic cells; pDCs, plasmacytoid dendritic cells. (C and D) Flow cytometry analysis of MNs, iTAMs, and mTAMs after CD163+ TAM depletion (C) and as proportion of tumor-associated CD11b+ cells (D). (E and F) Total number of TAMs (left) and iTAMs (right) per gram of tissue (E) and expression of CD11c, expressed as mean fluorescence intensity (MFI; F). Data are represented as mean ± SEM of n = 6. Statistically significant differences were calculated using a Kruskal–Wallis one-way ANOVA followed by Dunn’s multiple comparisons test; **, P < 0.01; ***, P < 0.001; ****, P < 0.0001. (G) PCA and network analysis of gene expression in iTAMs from αCD163-dxr treated mice compared with vehicle control. PCA analysis was performed on normalized data (mean = 0 and variance = 1) generating a correlation-based PCA plot. Network analysis connects k nearest neighbors (k = 5) based on similarity calculated by Pearson correlation (see Fig. S4 D for a heatmap of differentially expressed genes). (H) Relative expression of specific genes in iTAMs (2−ΔCT) with and without CD163+ TAM depletion; data are represented as mean ± SEM of n = 5. Statistically significant differences were calculated using a Mann–Whitney U test; *, P < 0.05; **, P < 0.01. (I) Depletion of CD163+ TAM in WT or Ccr2−/− mice grafted with YUMM1.7 tumors; cohorts of mice bearing palpable tumors were treated with either αCD163-dxr or vehicle alone, every second day for 2 wk (n = 6). Statistically significant difference was calculated using two-way ANOVA followed by Tukey post hoc test; ***, P < 0.001; ****, P < 0.0001. (J–L) Flow cytometry analysis of MN, iTAM, and mTAM in tumors from WT and Ccr2−/− mice at endpoint (J); total numbers of iTAM (K) and CD163+ TAM (L) were calculated and expressed per gram of tissue. Data are represented as mean ± SEM of n = 6. Statistically significant differences were calculated using a Kruskal–Wallis one-way ANOVA followed by Dunn’s multiple comparisons test; ****, P < 0.0001. All data are representative of a minimum of two independent experiments.
Figure 5.
Figure 5.
Depletion of CD163+ TAM promotes CD4 and CD8 T cell recruitment. (A) Total numbers of CD8+ and CD4+ T cells in tumor tissue after therapeutic depletion of CD163+ TAMs, analyzed by flow cytometry. T cells were gated as CD45+, Lin (CD19, NK1.1, Ly6G, CD11b), CD5+, CD3+ and subsequently identified as either CD4+ or CD8+ and numbers per gram of tissue calculated. See Fig. S1 D for the full gating strategy. (B) Flow cytometry analysis of IFNγ and PD-1 expression in tumor-infiltrating CD8+ T cells. Results are representative of three independent experiments with n = 6 per group. (C) Immunofluorescent staining of tumor tissue for CD163 (green), CD3 (red), and CD8 (yellow) in αCD163-dxr– or vehicle-treated mice. Scale bars, 50 µm. (D) Gene expression analysis in tumor tissue from αCD163-dxr– or vehicle-treated mice. Data are represented as mean ± SEM of n = 5. (E and F) Flow cytometry analysis of tumor-infiltrating T cells in WT and Ccr2−/− mice after therapeutic depletion of CD163+ TAMs; total numbers of (E) CD4+ T cells and CD8+ T cells and (F) IFNγ+ CD8+ T cells were calculated and expressed per gram of tissue. Statistically significant differences were calculated using a Kruskal–Wallis one-way ANOVA followed by Dunn’s multiple comparisons test; *, P < 0.05; **, P < 0.01; ***, P < 0.001; ****, P < 0.0001. (G) Treatment study comparing efficacy of CD163+ TAM depletion with pan-macrophages depletion using αCSF1 blocking antibody. Mice bearing palpable tumors were randomized into groups and treated with either αCD163-dxr (n = 6) or PBS (n = 4) i.v. every second day for 2 wk or αCSF1 (n = 6) or controls (CtrlIgG, n = 6 or PBS, n = 6) i.p. every 5 d. Statistically significant differences were calculated using a two-way ANOVA followed by Tukey post hoc test; ***, P < 0.001; ****, P < 0.0001. (H and I) At endpoint, the total number of mTAM, iTAM, and MN (H) or CD4+ TILs and IFNγ+ CD8+ TILs (I) was analyzed by flow cytometry and calculated from frequency of live cells. Data are represented as mean ± SEM of n = 6. Statistically significant differences were calculated using a Mann–Whitney U test; *, P < 0.05; **, P < 0.01; ***, P < 0.001; ****, P < 0.0001. All data are representative of two independent experiments. n.s., not significant.
Figure 6.
Figure 6.
CD163+ TAM depletion promotes anti–PD-1–resistant antitumor T cell responses. (A) Tumor-bearing mice were randomized into groups and treated with αCD163-dxr or vehicle every second day in combination with either αCD4 or αCD8-depleting antibodies or isotype control antibody twice a week (n = 5). Statistically significant differences were calculated using a two-way ANOVA followed by Tukey post hoc test; **, P < 0.01. (B–E) At endpoint, the relative numbers of tumor-infiltrating (B) CD4+ T cells, (C) CD8+ T cells, (D) IFNγ+ CD8+ T cells, and (E) iTAMs were determined by flow cytometry. Statistically significant differences were calculated using a Mann–Whitney U test (B and C) or Kruskal–Wallis one-way ANOVA followed by Dunn’s multiple comparisons test (D and E); **, P < 0.01. (F) Gene expression analysis on tumor tissue at endpoint. Data are represented as mean ± SEM of n = 5. Statistically significant differences were calculated using a Kruskal–Wallis one-way ANOVA followed by Dunn’s multiple comparisons test; *, P < 0.05; **, P < 0.01; ***, P < 0.001. (G) Flow cytometric analysis of CD4+, CD8+, and iTAM infiltration in YUMM1.7 tumor 1 d after αCD163-dxr treatment. Mice (n = 5 per time point) received one to five doses of 2 mg/kg dxr (red arrow indicates days of i.v. treatment). Total numbers of cells were calculated from the proportion of live cells and expressed per gram of tissue. (H) Mice inoculated with 106 YUMMER1.7 cells on the right flank were randomized into groups and treated from day 10 with 2 mg/kg dxr or control every second day for 2 wk as previously described for YUMM1.7 tumor bearing mice (Fig. 2 I). (I) Mice with palpable tumors were treated with αCD163-dxr or vehicle in combination with αPD-1 antibody or isotype control, as described above. (J) Tumor-bearing mice were treated with αCD163-dxr or vehicle, and 10 d later, treatment with αPD-1 or isotype control antibody was initiated. Data are represented as mean ± SEM of n = 6. Statistically significant difference was calculated using a two-way ANOVA followed by Tukey post hoc test; **, P < 0.01; ***, P < 0.001. All data are representative of a minimum of two independent experiments. n.s., not significant.
Figure 7.
Figure 7.
Schematic representation of the immune-suppressive function of CD163+ TAMs in melanoma. CD163+ TAMs block the recruitment antitumor CD8 T cells by blocking the accumulation of Ly6C+, Nr4a1 MNs and CD11chi iTAMs. Upon CD163+ TAM depletion, Ly6C+, Nr4a1neg MNs are rapidly mobilized, leading to the accumulation of CD11chi iTAMs that in connection with CD4+ T cells drive the recruitment and activation of antitumor CD8+ T cells.

References

    1. Bronkhorst I.H.G., Ly L.V., Jordanova E.S., Vrolijk J., Versluis M., Luyten G.P.M., and Jager M.J.. 2011. Detection of M2-macrophages in uveal melanoma and relation with survival. Invest. Ophthalmol. Vis. Sci. 52:643–650. 10.1167/iovs.10-5979 - DOI - PubMed
    1. Cassetta L., Fragkogianni S., Sims A.H., Swierczak A., Forrester L.M., Zhang H., Soong D.Y.H., Cotechini T., Anur P., Lin E.Y., et al. 2019. Human Tumor-Associated Macrophage and Monocyte Transcriptional Landscapes Reveal Cancer-Specific Reprogramming, Biomarkers, and Therapeutic Targets. Cancer Cell. 35:588–602.e10. 10.1016/j.ccell.2019.02.009 - DOI - PMC - PubMed
    1. Cassier P.A., Italiano A., Gomez-Roca C.A., Le Tourneau C., Toulmonde M., Cannarile M.A., Ries C., Brillouet A., Müller C., Jegg A.-M., et al. 2015. CSF1R inhibition with emactuzumab in locally advanced diffuse-type tenosynovial giant cell tumours of the soft tissue: a dose-escalation and dose-expansion phase 1 study. Lancet Oncol. 16:949–956. 10.1016/S1470-2045(15)00132-1 - DOI - PubMed
    1. Chevrier S., Levine J.H., Zanotelli V.R.T., Silina K., Schulz D., Bacac M., Ries C.H., Ailles L., Jewett M.A.S., Moch H., et al. 2017. An Immune Atlas of Clear Cell Renal Cell Carcinoma. Cell. 169:736–749.e18. 10.1016/j.cell.2017.04.016 - DOI - PMC - PubMed
    1. Dankort D., Curley D.P., Cartlidge R.A., Nelson B., Karnezis A.N., Damsky W.E. Jr., You M.J., DePinho R.A., McMahon M., and Bosenberg M.. 2009. Braf(V600E) cooperates with Pten loss to induce metastatic melanoma. Nat. Genet. 41:544–552. 10.1038/ng.356 - DOI - PMC - PubMed

Publication types