. 2019 Sep 30;93(20):e00638-19.
doi: 10.1128/JVI.00638-19. Print 2019 Oct 15.

Zika Virus Infection Induces DNA Damage Response in Human Neural Progenitors That Enhances Viral Replication

Affiliations

Zika Virus Infection Induces DNA Damage Response in Human Neural Progenitors That Enhances Viral Replication

Christy Hammack et al. J Virol. .

Abstract

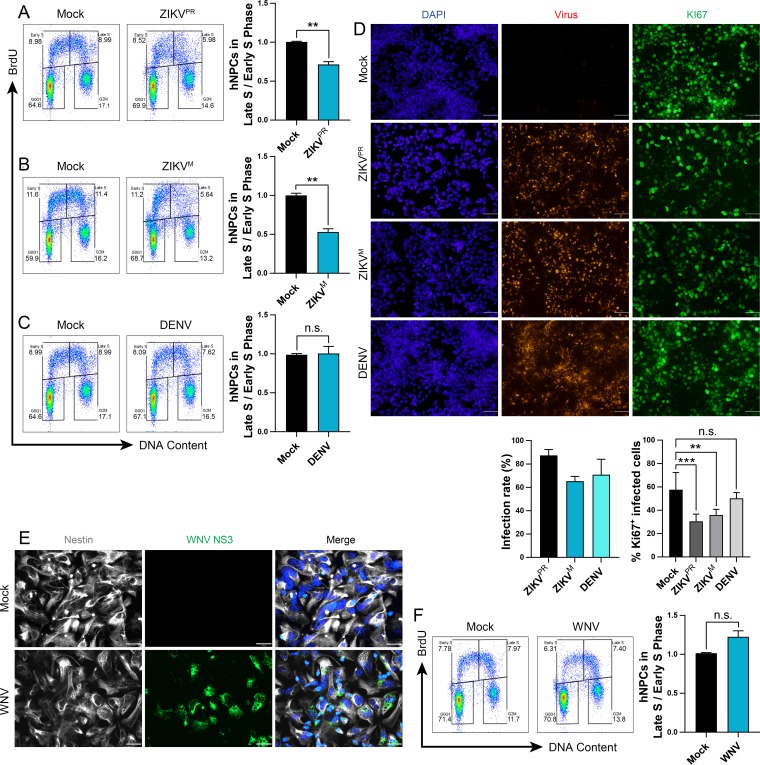
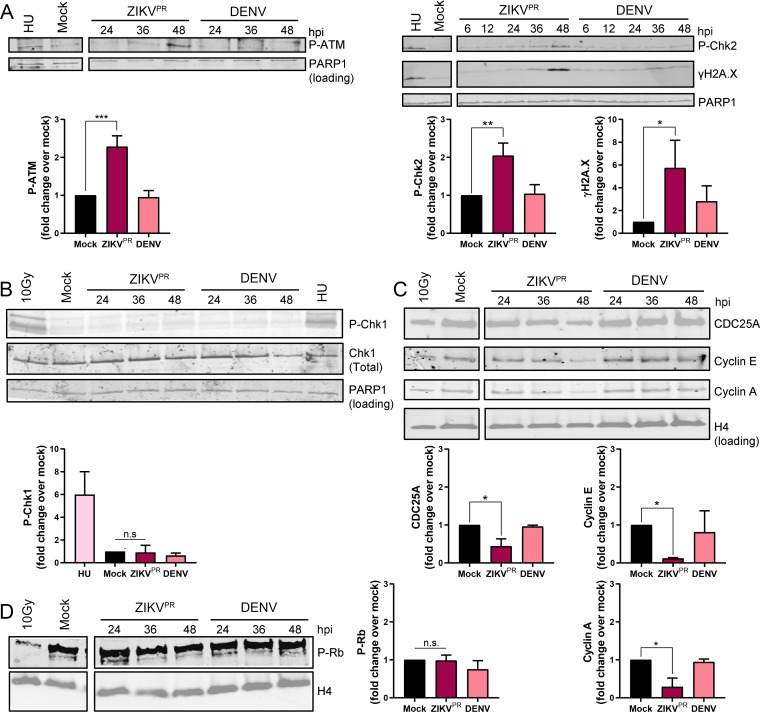
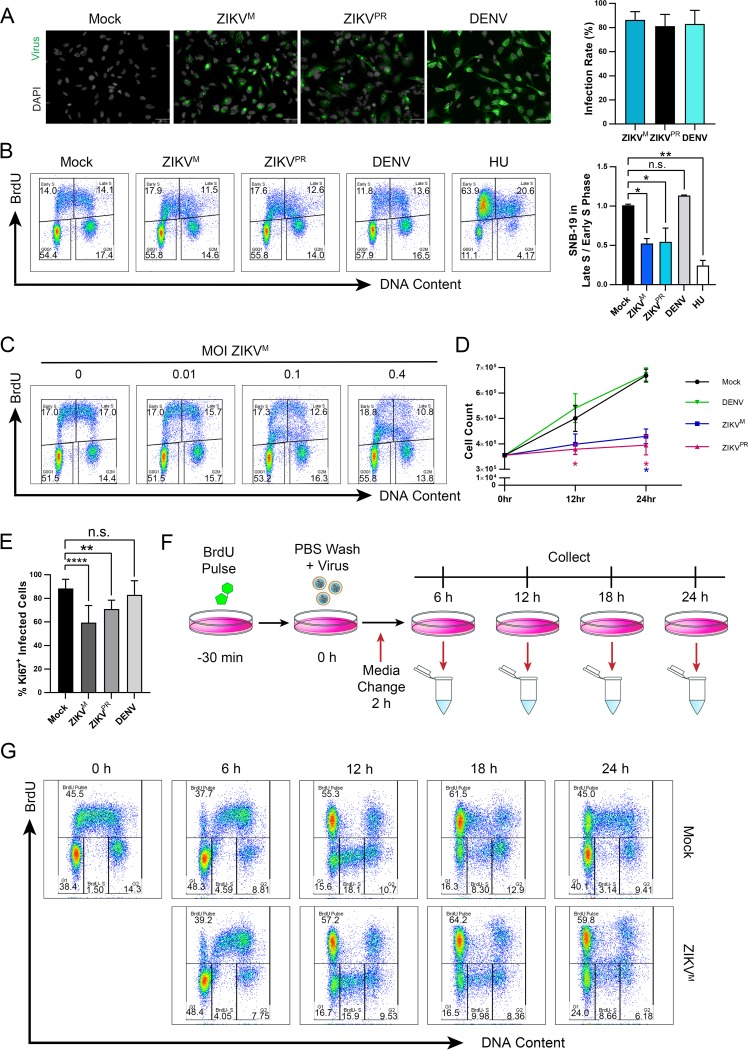
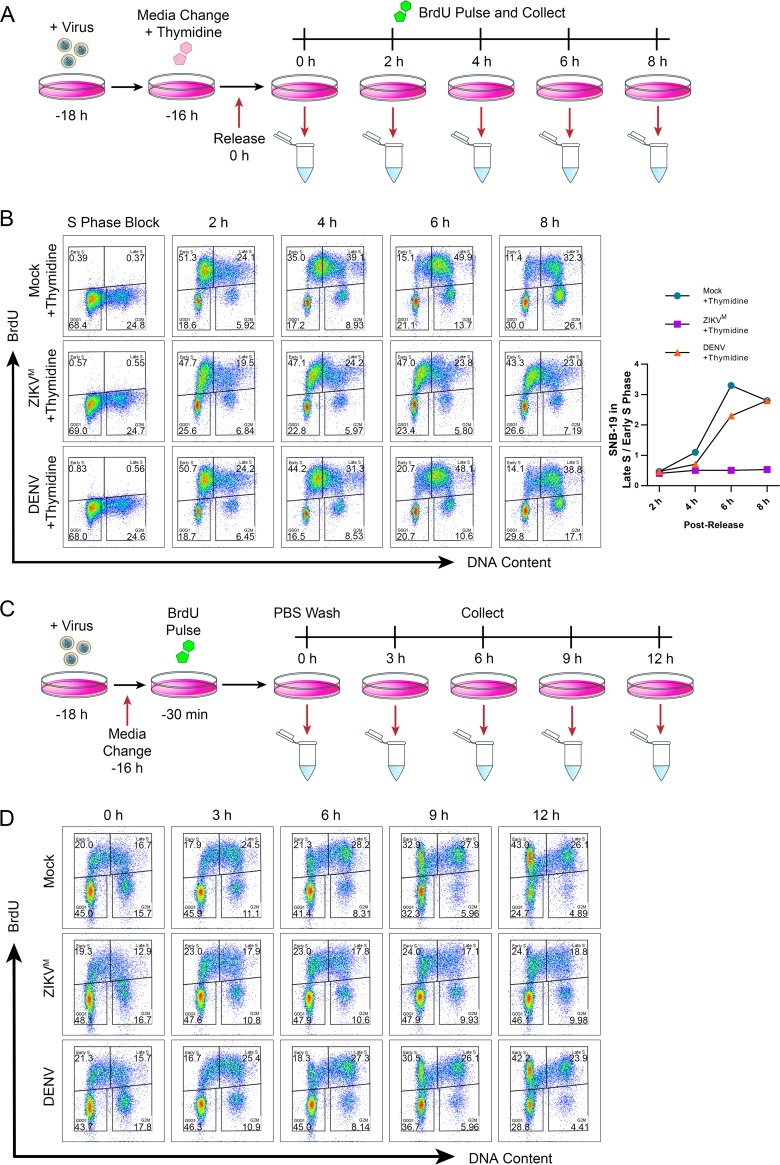
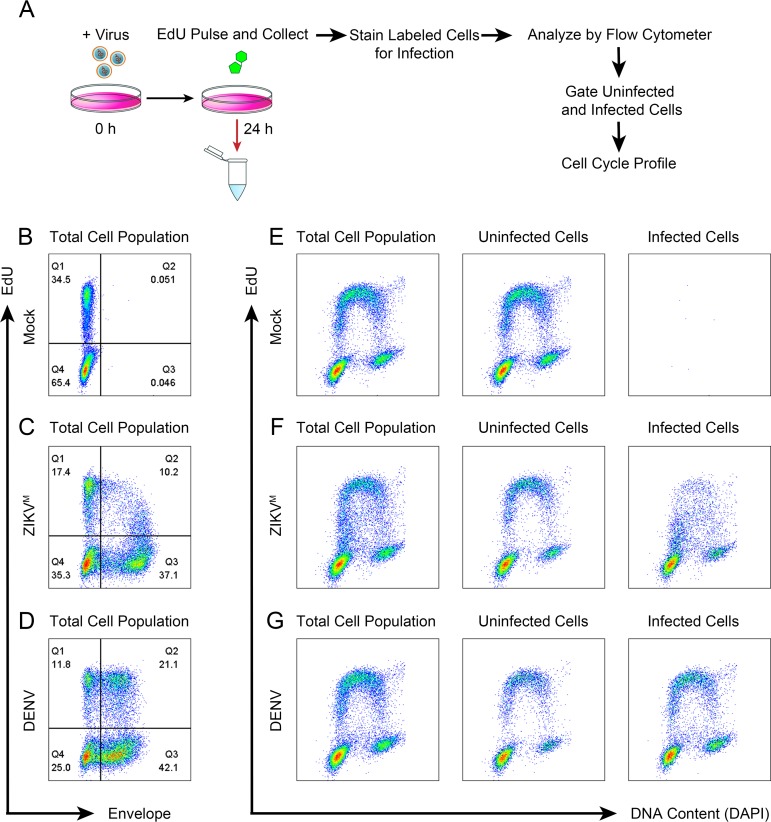
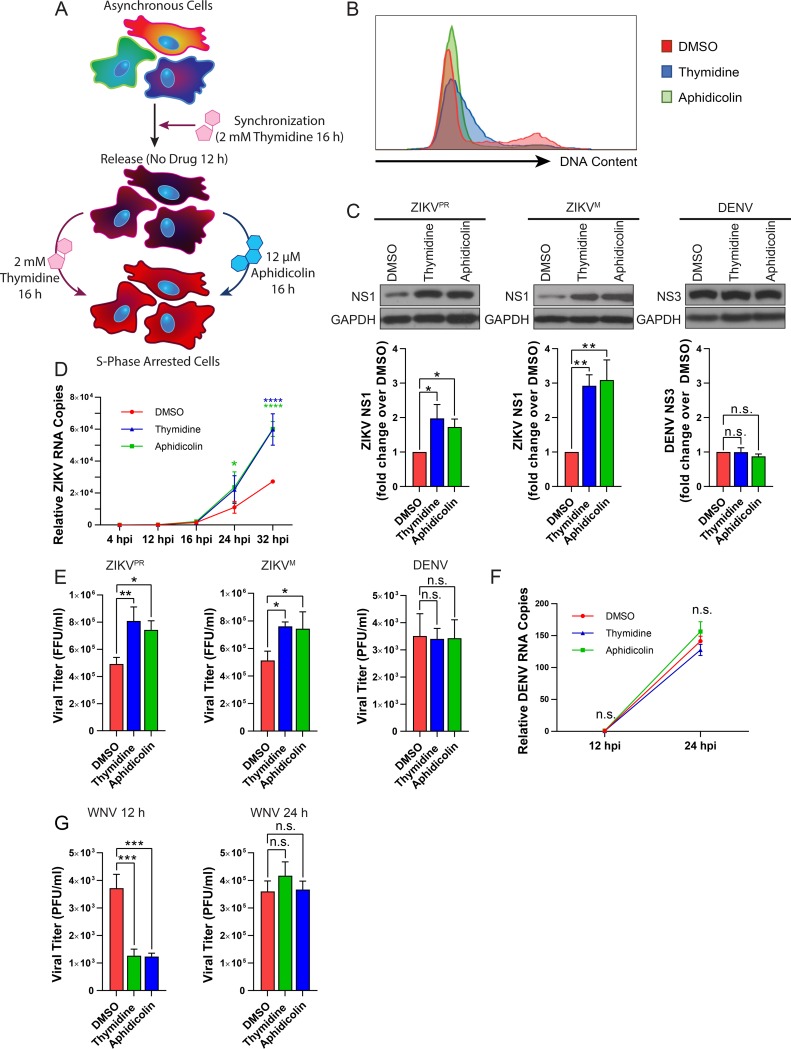
Zika virus (ZIKV) infection attenuates the growth of human neural progenitor cells (hNPCs). As these hNPCs generate the cortical neurons during early brain development, the ZIKV-mediated growth retardation potentially contributes to the neurodevelopmental defects of the congenital Zika syndrome. Here, we investigate the mechanism by which ZIKV manipulates the cell cycle in hNPCs and the functional consequence of cell cycle perturbation on the replication of ZIKV and related flaviviruses. We demonstrate that ZIKV, but not dengue virus (DENV), induces DNA double-strand breaks (DSBs), triggering the DNA damage response through the ATM/Chk2 signaling pathway while suppressing the ATR/Chk1 signaling pathway. Furthermore, ZIKV infection impedes the progression of cells through S phase, thereby preventing the completion of host DNA replication. Recapitulation of the S-phase arrest state with inhibitors led to an increase in ZIKV replication, but not of West Nile virus or DENV. Our data identify ZIKV's ability to induce DSBs and suppress host DNA replication, which results in a cellular environment favorable for its replication.IMPORTANCE Clinically, Zika virus (ZIKV) infection can lead to developmental defects in the cortex of the fetal brain. How ZIKV triggers this event in developing neural cells is not well understood at a molecular level and likely requires many contributing factors. ZIKV efficiently infects human neural progenitor cells (hNPCs) and leads to growth arrest of these cells, which are critical for brain development. Here, we demonstrate that infection with ZIKV, but not dengue virus, disrupts the cell cycle of hNPCs by halting DNA replication during S phase and inducing DNA damage. We further show that ZIKV infection activates the ATM/Chk2 checkpoint but prevents the activation of another checkpoint, the ATR/Chk1 pathway. These results unravel an intriguing mechanism by which an RNA virus interrupts host DNA replication. Finally, by mimicking virus-induced S-phase arrest, we show that ZIKV manipulates the cell cycle to benefit viral replication.

Keywords: DNA damage; DNA damage checkpoints; DNA damage response; DNA replication; S phase; Zika virus; cell cycle; neural progenitors.


Figures

FIG 1
FIG 1
ZIKV infection disrupts DNA replication of hNPCs. (A to F) hNPCs were infected with (A to D) ZIKVM (MOI of 0.4), ZIKVPR (MOI of 0.4), or DENV (MOI of 0.4) for 48 h or (E and F) WNV (MOI of 0.5) for 24 h. (A to C and F) Representative cell cycle profiles and quantifications of BrdU-pulse-labeled hNPCs. The same mock-infected cells were used for the ZIKVPR and DENV representative images. Error bars are mean ± SD, representing the average from two biological replicates. (D) Representative immunofluorescence images and quantifications of viral infection of hNPCs using anti-flavivirus envelope (4G2) and anti-KI67 staining 48 h postinfection. KI67+ cell quantification is the percentage of infected cells. Scale bars are 50 μm. Error bars are mean ± SD, representing the average from two biological replicates (n > 500 cells per treatment). (E) Representative immunofluorescence images of hNPCs infected with WNV (MOI of 0.5) for 24 h and stained with anti-WNV NS3 or antinestin. Scale bars are 26 μm. In panels A to D and F, ** indicates P ≤ 0.01 and *** indicates P ≤ 0.001. (A to C and F) Unpaired t test. (D) One-way ANOVA.
FIG 2
FIG 2
ZIKV infection activates the ATM/Chk2 checkpoint in hNPCs. (A to C) Representative Western blot images and quantifications of DNA damage response signaling pathway protein expression in hNPCs infected with ZIKVPR (MOI of 0.4) or DENV (MOI of 0.4) analyzed over the time course shown (hours postinfection [hpi]). Positive controls include cells treated with 1 mM hydroxyurea (HU) for 22 h and 10-Gy-irradiated cells. Quantifications are of 48-h time points. Error bars are mean ± SD, representing the average from (A and B) three or (C) two biological replicates. (D) Representative Western blot image and quantification of phosphorylated Rb in hNPCs infected with ZIKVPR (MOI of 0.4) or DENV (MOI of 0.4) analyzed over the time course shown (hpi). The positive control is 10-Gy-irradiated cells. Quantifications are of 48-h time points. Error bars are mean ± SD, representing the average from three biological replicates. In panels A to D, * indicates P ≤ 0.05, ** indicates P ≤ 0.01, and *** indicates P ≤ 0.001 (one-way ANOVA).
FIG 3
FIG 3
ZIKV infection induces DNA damage in hNPCs, while simultaneously restricting activation of the ATR/Chk1 checkpoint. (A) Representative immunofluorescence images and quantification of γH2A.X foci in hNPCs infected for 48 h with ZIKVM (MOI of 0.4) or DENV (MOI of 0.4). Cells were stained with anti-γH2A.X, and nuclear foci were counted. DAPI is represented in gray; γH2A.X is represented in green. The scale bar is 20 μm. Error bars are mean ± SD (n > 500 cells per treatment). (B) Quantification of γH2A.X foci in cleaved caspase-3-negative (c-Cas3) hNPCs infected for 48 h with ZIKVPR (MOI of 0.4) or DENV (MOI of 0.4). Cells were stained with anti-γH2A.X, and anti-cleaved caspase-3, and nuclear foci were counted in cells negative for caspase-3 staining. Error bars are mean ± SD (n > 500 cells per treatment,). (C and D) Representative immunofluorescence images and quantification of (C) phosphorylated 53BP1 foci or (D and E) tail moment in hNPCs infected for 48 h with ZIKVPR (MOI of 0.4) or DENV (MOI of 0.4). (C) Cells were stained with anti-phospho-53BP1, and nuclear foci were counted. DAPI is represented in gray; phospho-53BP1 is represented in green. Scale bars are 20 μm. Error bars are mean ± SD for images representative of two biological replicates (n > 500 cells per treatment). (D) Immunofluorescence images and (E) cluster plot analysis of the neutral comet assay. Following neutral comet assay lysis and single-cell electrophoresis, infected hNPCs were stained with SYBR gold, and tail moment was measured. Scale bars are 50 μm. Error bars are mean ± SD, representing the average from three biological replicates (immunofluorescence, n > 50 comets per replicate; cluster plot, n = 160 comets per treatment). (F) Representative Western blot image and quantification of phosphorylated Chk1 in hNPCs infected with ZIKVPR (MOI of 0.4) or DENV (MOI of 0.4) for 44 or 26 h and then treated with 1 mM HU for 4 or 22 h prior to collection. Error bars are mean ± SD, representing the average from two biological replicates. In panels A to E, * indicates P ≤ 0.05, ** indicates P ≤ 0.01, *** indicates P ≤ 0.001, and **** indicates P ≤ 0.0001 (one-way ANOVA).
FIG 4
FIG 4
ZIKV infection alters the proliferation and cell cycle progression of SNB-19 cells. (A, B, D, and E) SNB-19 cells were infected with ZIKVM (MOI of 1.0), ZIKVPR (MOI of 1.0), or DENV (MOI of 1.0) for (A and B) 24 h or (D) 12 to 24 h prior to analysis. (A) Representative immunofluorescence images and quantification of infected SNB-19 cells stained with anti-flavivirus envelope (4G2). Scale bars are 50 μm. Error bars are mean ± SD (n > 500 cells per treatment). (B) Representative cell cycle profiles and quantifications of BrdU-pulse-labeled SNB-19 cells following infection or treatment with 1 mM HU for 22 h. Error bars are mean ± SD, representing the average from two biological replicates. (C) Cell cycle profile of SNB-19 cells infected with increasing MOI of ZIKVM at 24 h prior to BrdU pulse-labeling. (D) Time course of SNB-19 cell proliferation for infected or mock-infected cells. Error bars are mean ± SD, representing the average from three biological replicates. (E) Quantification of KI67-positive SNB-19 cells in the infected population. Cells were stained with anti-KI67 and anti-flavivirus envelope (4G2) 24 h postinfection and counted for double-positive cells. Error bars are mean ± SD (n > 500 per treatment). (F) Schematic of SNB-19 BrdU pulse-labeling for cell cycle profile analysis of DNA replication progression. SNB-19 cells were initially pulsed with BrdU for 30 min and then infected for 2 h with ZIKVM (MOI of 1.0). Samples were collected at 6, 12, 18, and 24 h postinfection for analysis by flow cytometry. (G) Cell cycle progression of BrdU-pulse-labeled SNB-19 cells throughout ZIKV infection as indicated in panel F. Analyzed gates include the BrdU-labeled cells (BrdU Pulse), and all BrdU-negative cells divided into the G1, BrdU S, and G2 DNA content groups. The cell cycle profiles shown are representative of three biological replicates. In panels B, D, and E, * indicates P ≤ 0.05, ** indicates P ≤ 0.01, *** indicates P ≤ 0.001, and **** indicates P ≤ 0.0001 (one-way ANOVA).
FIG 5
FIG 5
ZIKV infection disrupts progression of S phase and causes an S-phase arrest in SNB-19 cells. (A) Schematic of SNB-19 S-phase synchronization and BrdU pulse-labeling for cell cycle profile analysis of S-phase progression. SNB-19 cells were initially infected for 2 h with ZIKVM (MOI of 1.0) or DENV (MOI of 1.0) followed by treatment with 2 mM thymidine for 16 h. At 18 h postinfection, 0-h samples were BrdU pulse-labeled for 30 min and collected, while all other cells were released from thymidine block. At 2, 4, 6, and 8 h postrelease, cells were BrdU pulse-labeled for 30 min and collected for analysis by flow cytometry. (B) Cell cycle synchronization and progression of ZIKVM- or DENV-infected SNB-19 cells through S phase treated as indicated in panel A. Shown is quantification of representative profile. The cell cycle profiles shown are representative of three biological replicates. (C) Schematic of SNB-19 BrdU pulse-labeling for cell cycle profile analysis of S-phase progression in infected cells. SNB-19 cells were initially infected for 2 h with ZIKVM (MOI of 1.0) or DENV (MOI of 1.0). At 18 h postinfection, samples were BrdU pulse-labeled for 30 min and collected at 0, 3, 6, 9, and 12 h post-BrdU labeling for analysis by flow cytometry. (D) Cell cycle progression of an asynchronous population of BrdU-pulse-labeled SNB-19 cells during infection as indicated in panel C. The cell cycle profiles shown are representative of three biological replicates.
FIG 6
FIG 6
ZIKV-induced S-phase arrest is specific to infected cells. (A) Schematic of EdU pulse-labeling for cell cycle profile analysis of infected versus uninfected cells. SNB-19 cells were infected with ZIKVM (MOI of 0.5) or DENV (MOI of 0.5) for 24 h. Samples were pulse-labeled with 100 μM EdU for 30 min, collected, and then stained with anti-flavivirus envelope (4G2) prior to Click-iT chemistry and staining with DAPI. (B to D) Representative 2D analysis of EdU-labeled cells and envelope protein staining of SNB-19 cells treated as indicated in panel A. (E to G) Corresponding cell cycle profiles of panels B to D. The “Uninfected Cells” plot displays cells gated from Q1 and Q4 of panels B to D. The “Infected Cells” plot displays cells gated from Q2 and Q3 of panels B to D. (B to G) The cell cycle profiles shown are representative of three biological replicates.
FIG 7
FIG 7
Induced S-phase arrest of SNB-19 cells enhances ZIKV, but not DENV or WNV replication. (A) Schematic of two treatment conditions used to synchronize SNB-19 cells in S phase. Cells were initially treated with 2 mM thymidine for 16 h and then were released back into the cell cycle for 12 h. Following release, the cells were treated with either 2 mM thymidine or 12 μM aphidicolin for an additional 16 h to induce S-phase arrest prior to infection. (B) Representative flow cytometry analysis of SNB-19 cells treated as indicated in panel A. Samples were stained with propidium iodide (PI) and analyzed by flow cytometry. (C, D, and F) SNB-19 cells were infected for (C) 24 h, (D) 4 to 32 h, or (F) 12 to 24 h with ZIKVPR (MOI of 0.5), ZIKVM (MOI of 0.5), or DENV (MOI of 0.5). (C) Western blot images and quantification of intracellular viral protein expression. Viral protein was detected by anti-ZIKV NS1 or anti-DENV NS3 for each respective sample. Viral protein band intensities were normalized to the DMSO control, representing the mean from three biological replicates ± SD. (D and F) Time course of relative intracellular viral RNA copies in (D) ZIKVM- or (F) DENV-infected SNB-19 cells as measured by qPCR. Error bars are the mean ± SD from three biological replicates. (E and G) Infectivity titers of culture supernatants at (E) 48 h postinfection as measured by focus-forming units (ZIKVPR and ZIKVM [MOI of 0.5]) and at 36 h postinfection as measured by PFU (DENV [MOI of 0.5]) or (G) at 12 and 24 h postinfection as measured by PFU (WNV [MOI of 0.5]) on (E) Vero cells or (F) BHK cells. Error bars are the mean ± SD from three biological replicates. In panels C to G, * indicates P ≤ 0.05, ** indicates P ≤ 0.01, *** indicates P ≤ 0.001, and **** indicates P ≤ 0.0001. (C, E, and G) One-way ANOVA. (D and F) Two-way ANOVA.
FIG 8
FIG 8
G0/G1-phase arrest of SNB-19 cells does not promote ZIKV replication. (A) Flow cytometry analysis of SNB-19 cells cultured for 24 h in 10, 1, and 0.1% serum media, respectively. Samples were stained with propidium iodide (PI) and analyzed by flow cytometry. (B and C) SNB-19 cells were infected for (B) 24 h or (C) 36 h with ZIKVPR (MOI of 0.5) or ZIKVM (MOI of 0.5) or 48 h with DENV (MOI of 0.5). (B) Western blot images of intracellular viral protein expression in serum-starved SNB-19 cells 24 h postinfection. Following culture for 24 h in standard (10% FBS) or reduced (1% or 0.1% FBS) serum medium, cells were infected by direct addition of virus culture to the existing culture medium. Viral protein was detected by anti-ZIKV NS1 or anti-DENV NS3 for each respective sample. Viral protein band intensities were normalized to the 10% FBS control, representing the mean ± SD from three biological replicates. (C) Infectivity titers of culture supernatants as measured by FFU (ZIKVM and ZIKVPR) or PFU (DENV) on Vero cells. Error bars are the mean ± SD from three biological replicates. (D) Western blot images of intracellular viral protein expression in SNB-19 cells 24 h postinfection. Following a 2-h infection in standard serum medium (10% FBS) with ZIKVPR (MOI of 2.0), ZIKVM (MOI of 2.0), or DENV (MOI of 2.0), the medium was changed to standard serum medium (10% FBS) or reduced serum medium (1% or 0.1% FBS) for 24 h prior to collection. Viral protein was detected by anti-ZIKV NS1 or anti-DENV NS3 for each respective sample. Viral protein band intensities were normalized to the 10% FBS control, representing the mean ± SD from three biological replicates. In panels B to D, * indicates P ≤ 0.05, ** indicates P ≤ 0.01, *** indicates P ≤ 0.001, and **** indicates P ≤ 0.0001 (one-way ANOVA).
FIG 9
FIG 9
Model depicting the effects of ZIKV infection on cell cycle progression in hNPCs. In this study, we demonstrate that ZIKV infection of neural progenitors causes DNA double-strand breaks (DSBs) and suppresses activation of the ATR/Chk1 signaling pathway, resulting in induction of the DNA damage response (DDR) via the ATM/Chk2 signaling pathway. Activation of ATM and the subsequent Chk2-mediated signaling cascade leads to the phosphorylation of the DNA damage repair proteins H2A.X and 53BP1 and degradation of the S-phase regulatory and effector proteins CDC25A, cyclin A, and cyclin E, culminating in an S-phase arrest environment that fosters productive ZIKV replication.

Similar articles

Cited by

References

    1. Tang H, Hammack C, Ogden SC, Wen Z, Qian X, Li Y, Yao B, Shin J, Zhang F, Lee EM, Christian KM, Didier RA, Jin P, Song H, Ming GL. 2016. Zika virus infects human cortical neural progenitors and attenuates their growth. Cell Stem Cell 18:587–590. doi:10.1016/j.stem.2016.02.016. - DOI - PMC - PubMed
    1. Mlakar J, Korva M, Tul N, Popović M, Poljšak-Prijatelj M, Mraz J, Kolenc M, Resman Rus K, Vesnaver Vipotnik T, Fabjan Vodušek V, Vizjak A, Pižem J, Petrovec M, Avšič Županc T. 2016. Zika virus associated with microcephaly. N Engl J Med 374:951–958. doi:10.1056/NEJMoa1600651. - DOI - PubMed
    1. Rasmussen SA, Jamieson DJ, Honein MA, Petersen LR. 2016. Zika virus and birth defects—reviewing the evidence for causality. N Engl J Med 374:1981–1987. doi:10.1056/NEJMsr1604338. - DOI - PubMed
    1. Garcez PP, Loiola EC, Madeiro da Costa R, Higa LM, Trindade P, Delvecchio R, Nascimento JM, Brindeiro R, Tanuri A, Rehen SK. 2016. Zika virus impairs growth in human neurospheres and brain organoids. Science 352:816–818. doi:10.1126/science.aaf6116. - DOI - PubMed
    1. Qian X, Nguyen HN, Song MM, Hadiono C, Ogden SC, Hammack C, Yao B, Hamersky GR, Jacob F, Zhong C, Yoon KJ, Jeang W, Lin L, Li Y, Thakor J, Berg DA, Zhang C, Kang E, Chickering M, Nauen D, Ho CY, Wen Z, Christian KM, Shi PY, Maher BJ, Wu H, Jin P, Tang H, Song H, Ming GL. 2016. Brain-region-specific organoids using mini-bioreactors for modeling ZIKV exposure. Cell 165:1238–1254. doi:10.1016/j.cell.2016.04.032. - DOI - PMC - PubMed

Publication types