. 2019 Oct 15;93(21):e01154-19.
doi: 10.1128/JVI.01154-19. Print 2019 Nov 1.

Modified Vaccinia Virus Ankara Can Induce Optimal CD8+ T Cell Responses to Directly Primed Antigens Depending on Vaccine Design

Affiliations

Modified Vaccinia Virus Ankara Can Induce Optimal CD8+ T Cell Responses to Directly Primed Antigens Depending on Vaccine Design

Yik Chun Wong et al. J Virol. .

Abstract

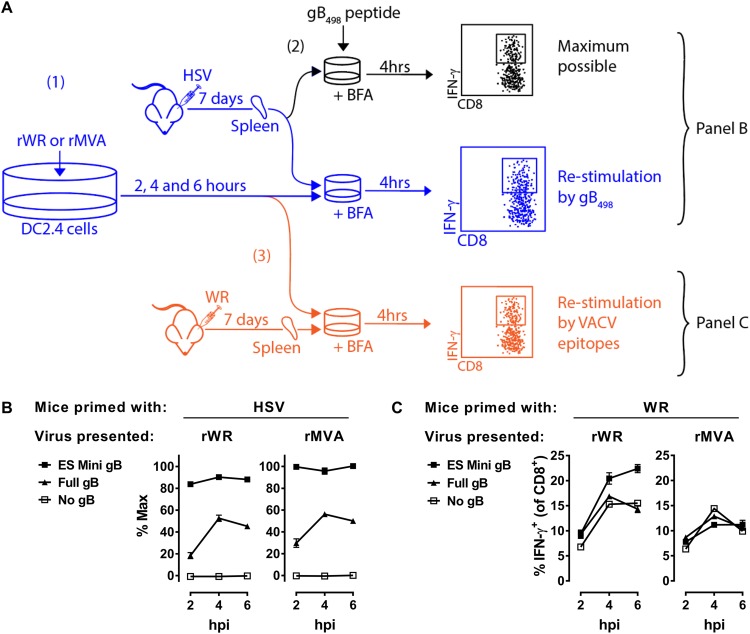
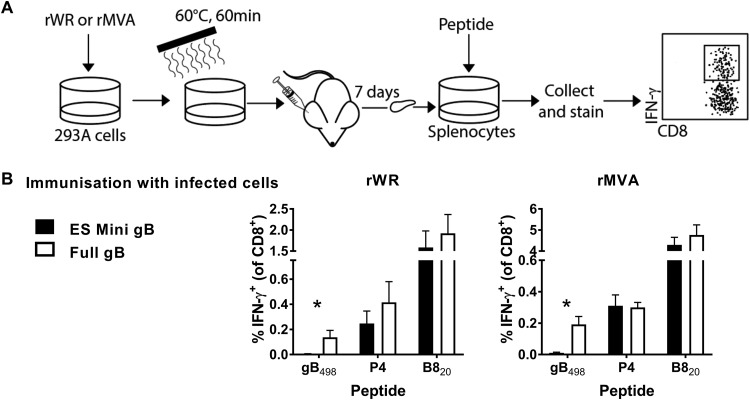
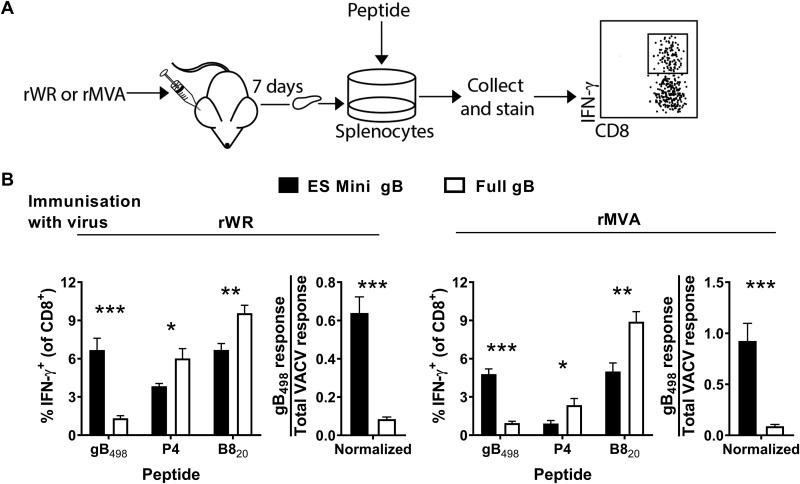
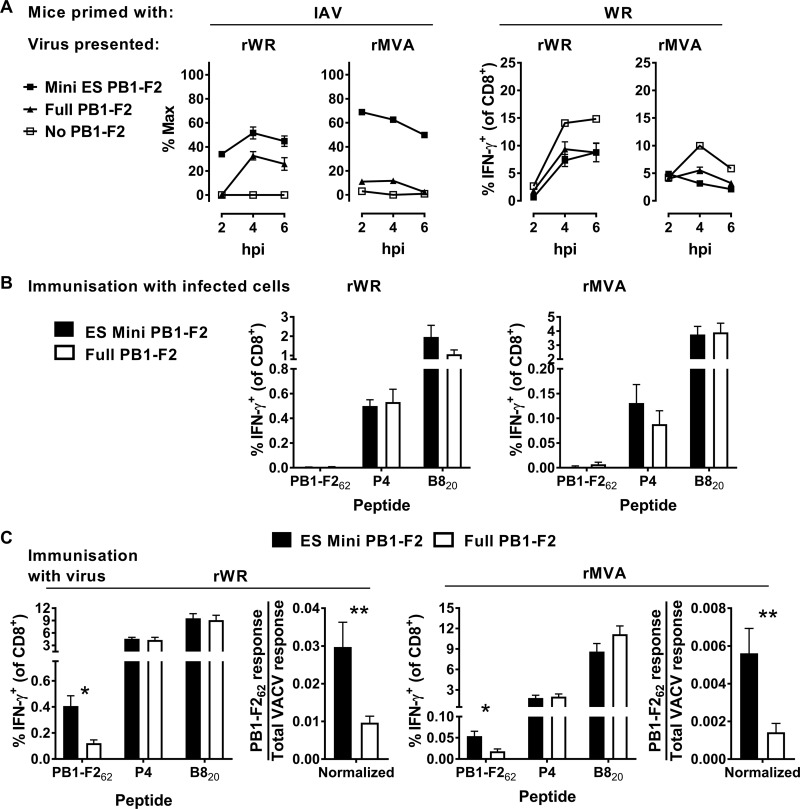
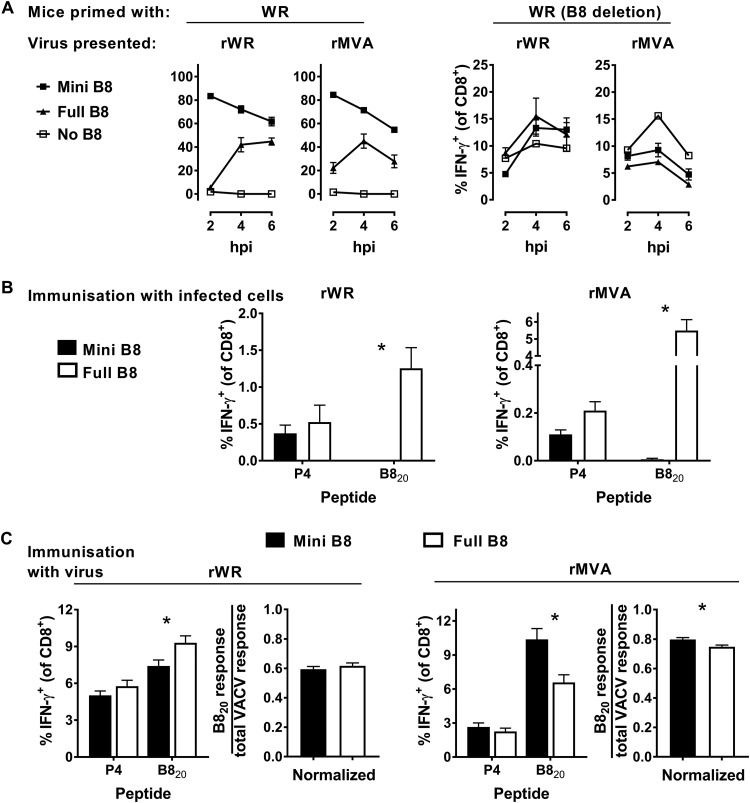
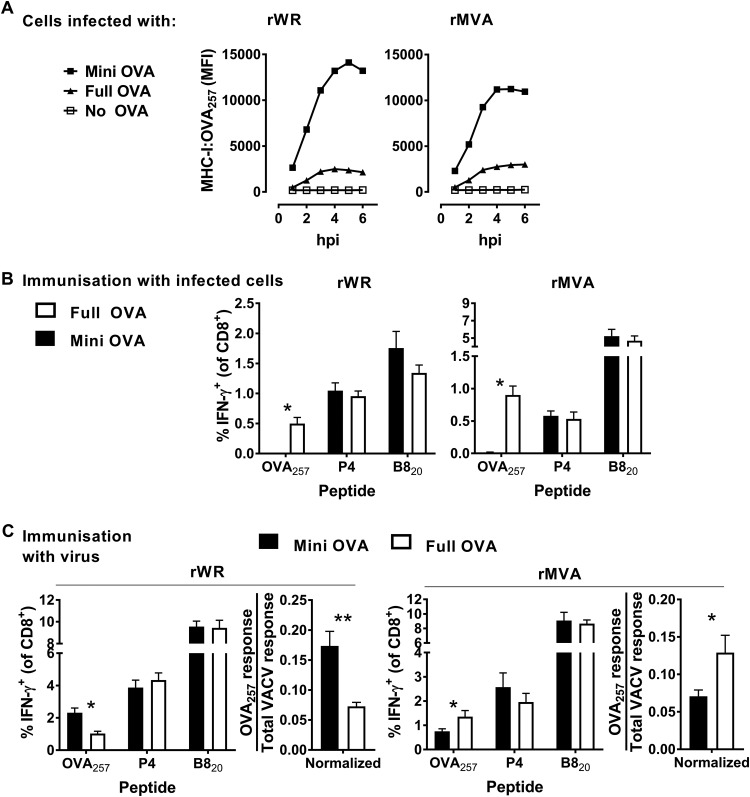
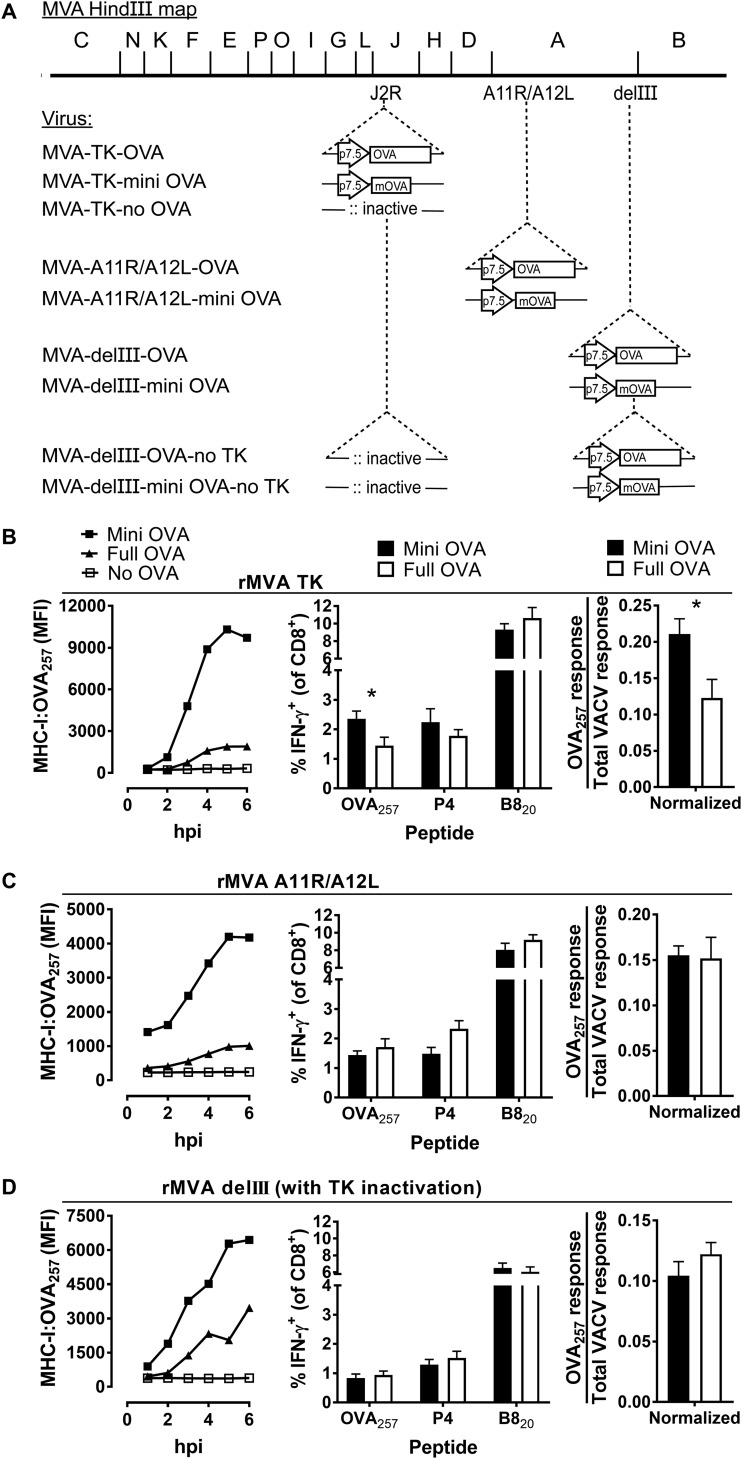
A variety of strains of vaccinia virus (VACV) have been used as recombinant vaccine vectors with the aim of inducing robust CD8+ T cell immunity. While much of the pioneering work was done with virulent strains, such as Western Reserve (WR), attenuated strains such as modified vaccinia virus Ankara (MVA) are more realistic vectors for clinical use. To unify this literature, side-by-side comparisons of virus strains are required. Here, we compare the form of antigen that supports optimal CD8+ T cell responses for VACV strains WR and MVA using equivalent constructs. We found that for multiple antigens, minimal antigenic constructs (epitope minigenes) that prime CD8+ T cells via the direct presentation pathway elicited optimal responses from both vectors, which was surprising because this finding contradicts the prevailing view in the literature for MVA. We then went on to explore the discrepancy between current and published data for MVA, finding evidence that the expression locus and in some cases the presence of the viral thymidine kinase may influence the ability of this strain to prime optimal responses from antigens that require direct presentation. This extends our knowledge of the design parameters for VACV vectored vaccines, especially those based on MVA.IMPORTANCE Recombinant vaccines based on vaccinia virus and particularly attenuated strains such as MVA are in human clinical trials, but due to the complexity of these large vectors much remains to be understood about the design parameters that alter their immunogenicity. Previous work had found that MVA vectors should be designed to express stable protein in order to induce robust immunity by CD8+ (cytotoxic) T cells. Here, we found that the primacy of stable antigen is not generalizable to all designs of MVA and may depend where a foreign antigen is inserted into the MVA genome. This unexpected finding suggests that there is an interaction between genome location and the best form of antigen for optimal T cell priming in MVA and thus possibly other vaccine vectors. It also highlights that our understanding of antigen presentation by even the best studied of vaccine vectors remains incomplete.

Keywords: CD8+ T cells; CTL; MVA; antigen presentation; antigen processing; cytotoxic T cells; live vector vaccines; modified vaccinia virus Ankara; vaccinia virus.


Figures

FIG 1
FIG 1
Full-length gB and minigene-gB498 are expressed from rVACVs. (A) Diagram of experimental plan. DC2.4 cells were infected with rVACVs for 2, 4, or 6 h, and then the levels of HSV gB498 presentation on MHC-I were determined by coculture with HSV-immune splenocytes in the presence of brefeldin A, followed by flow cytometry to identify IFN-γ+ CD8+ T cells (blue, step 1). The HSV-immune splenocytes were separately stimulated with gB498 peptide for 4 h, and the percentages of CD8+ T cells that were IFN-γ+ were measured to provide a maximum possible gB498-specific response (black, step 2). Results from cocultures of infected cells with HSV-immune splenocytes are shown as a percentage of this maximum possible response. Finally, separate aliquots of the same infected cultures were incubated with VACV-immune splenocytes, and IFN-γ+ CD8+ T cells were again counted to determine the general levels of infection and antigen presentation (orange, step 3). (B) Data reflecting the levels of gB489 presented on triplicate cultures of rWR- or rMVA-infected cells from the experiment described above. The virus strain is shown above graphs, and the form of gB antigen expressed is in the key. (C) Data reflecting levels of VACV antigen presentation on the same triplicate cultures of rWR- and rMVA-infected cells. Means and standard errors of triplicates are shown; some errors are obscured by data points. The experiment was repeated with similar results.
FIG 2
FIG 2
Cells infected with rVACVs expressing full-length gB, but not minigene-gB498, can cross prime CD8+ T cells in vivo. (A) Diagram of the experimental plan. Human 293A cells were infected with rWR or rMVA for a total of 6 h, and then counted and heat treated to eliminate any infectivity. Mice were immunized with these cells by i.d. injection and, after 7 days, epitope-specific CD8+ T cell responses were measured by in vitro culture with peptides and flow cytometry for CD8 and IFN-γ. (B) Data from the experiment described in panel A. Mice were immunized with cells infected with the VACV strain as shown above the graphs expressing the form of gB498 as shown in the key. The epitopes are shown on the x axis; P4 is the sum of responses to A47138, A47171, L253, and A3270. Means and standard errors of data from six mice combined from two independent experiments are shown (*, P < 0.05).
FIG 3
FIG 3
Minigene-gB498 is more effective than full-length gB for priming CD8+ T cells when expressed from rWR and rMVA. (A) Diagram of the experimental plan. Mice were infected with rWR and rMVA viruses expressing versions of HSV gB498 by i.d. injection and, after 7 days, epitope-specific CD8+ T cell responses were measured by in vitro culture with peptides and flow cytometry for CD8 and IFN-γ. (B) Data from the experiment described in panel A. Mice were immunized with rWRs (left) or rMVAs (right) expressing the form of gB498 as shown in the key. The peptides are shown on the x axis. The graph on the right for each VACV strain shows the gB498-specific response divided by the total VACV-specific response (i.e., the sum of P4 and B820) to account for any differences in infection across the viruses. Means and standard errors of data from six mice combined from two independent experiments are shown (*, P < 0.05; **, P < 0.01; ***, P < 0.001).
FIG 4
FIG 4
Presentation to, and priming of, CD8+ T cells by PB1-F262 expressed in different forms by rWR and rMVA. (A) Results obtained according to the experimental design in Fig. 1A show the extent of restimulation of CD8+ T cells from IAV-immune (left) or VACV WR-immune (right) splenocytes by cells infected by the virus strain, as shown above graphs, expressing the forms of PB1-F262 as shown in the key. For the cocultures with IAV-immune splenocytes (left), data are presented relative to the maximum possible value obtained by stimulation of the same spleen cells with PB1-F262 peptide. Means and standard errors of triplicates are shown. The experiment was repeated with similar results. (B) Results obtained according to the experimental design shown in Fig. 2A, except viruses expressed versions of PB1-F262 (as shown). Epitope-specific responses are shown as the percentage of CD8+ T cells making IFN-γ. (C) Results obtained according to the experimental design in Fig. 3A. Mice were infected with rWR and rMVA viruses expressing versions of PB1-F262 (as shown) and, 7 days later, the epitope-specific responses were measured. The graph on the right for each VACV strain shows the PB1-F262-specific response divided by the total VACV-specific response. For panels B and C, the means and standard errors of data from nine mice from three independent experiments are shown (*, P < 0.05; **, P < 0.01).
FIG 5
FIG 5
Presentation to, and priming of, CD8+ T cells by B820 expressed in different forms by rWR and rMVA. (A) Results obtained according to the experimental design in Fig. 1A showing the extent of restimulation of CD8+ T cells from IAV-miniB820-immune (left) or VACV WR(delB8)-immune (right) splenocytes by cells infected by the virus strain, as shown above the graphs, expressing the forms of B820 as shown in the key. For the cocultures with IAV-miniB820-immune splenocytes (left), the data are presented relative to the maximum possible value obtained by stimulation of the same spleen cells with B820 peptide. Means and standard errors of triplicates are shown. The experiment was repeated with similar results. (B) Results obtained according to the experimental design shown in Fig. 2A, except the viruses expressed versions of B8 (as shown). Epitope-specific responses are shown as the percentage of CD8+ T cells making IFN-γ. (C) Results obtained according to the experimental design in Fig. 3A. Mice were infected with rWR and rMVA viruses expressing versions of B8 (as shown) and, 7 days later, the epitope-specific responses were measured. The graph on the right for each VACV strain shows the B8-specific response divided by the total VACV-specific response. For panels B and C, means and standard errors of data from 15 mice from five independent experiments are shown (*, P < 0.05).
FIG 6
FIG 6
Presentation to, and priming of, CD8+ T cells by OVA257 expressed in different forms by rWR and rMVA. (A) The extent of cell surface presentation of MHC-I:OVA257 complexes was determined in DC2.4 cells after infection with OVA-, mini-OVA-, or no-OVA-expressing rWR and rMVA. MHC-I:OVA257 complexes were detected by 25D1.16 antibodies, and the MFI was determined by flow cytometry. (B) Results obtained according to the experimental design shown in Fig. 2A, except the viruses expressed versions of OVA (as shown). Epitope-specific responses are shown as the percentage of CD8+ T cells making IFN-γ. (C) Results obtained according to the experimental design in Fig. 3A. Mice were infected with rWR and rMVA viruses expressing versions of OVA (as shown) and, 7 days later, the epitope-specific responses were measured. The graph on the right for each VACV strain shows the OVA257-specific response divided by the total VACV-specific response. For panels B and C, means and standard errors of data from nine mice combined from three independent experiments are shown (*, P < 0.05; **, P < 0.01).
FIG 7
FIG 7
Presentation to, and priming of, CD8+ T cells by OVA257 expressed in different loci of rMVA and without a functional TK. (A) MVA genome maps showing HindIII fragments and the site of insertion of OVA antigenic constructs and the promoter (arrow). The “m” denotes the minigene (OVA257). (B to D, left) Extent of cell surface presentation of MHC-I:OVA257 complexes on DC2.4 cells infected with viruses. (B to D, middle) Mice were infected with rMVA viruses expressing versions of OVA257 (as shown) and, 7 days later, the responses to peptides were measured. (B to D, right) Using the data shown in the middle graphs, the OVA257-specific response was normalized by dividing by the total VACV-specific response. Means and standard errors of data from at least nine mice combined from three independent experiments are shown (*, P < 0.05).

Similar articles

Cited by

References

    1. Qiu J, Peng S, Ma Y, Yang A, Farmer E, Cheng MA, Roden RBS, Wu TC, Chang Y-N, Hung C-F. 2018. Epithelial boost enhances antigen expression by vaccinia virus for the generation of potent CD8+ T cell-mediated antitumor immunity following DNA priming vaccination. Virology 525:205–215. doi:10.1016/j.virol.2018.09.019. - DOI - PMC - PubMed
    1. Marin-Lopez A, Calvo-Pinilla E, Barriales D, Lorenzo G, Brun A, Anguita J, Ortego J. 2018. CD8 T cell responses to an immunodominant epitope within the nonstructural protein NS1 provide wide immunoprotection against bluetongue virus in IFNAR–/– mice. J Virol 92. doi:10.1128/JVI.00938-18. - DOI - PMC - PubMed
    1. Altenburg AF, Magnusson SE, Bosman F, Stertman L, de Vries RD, Rimmelzwaan GF. 2017. Protein and modified vaccinia virus Ankara-based influenza virus nucleoprotein vaccines are differentially immunogenic in BALB/c mice. Clin Exp Immunol 190:19–28. doi:10.1111/cei.13004. - DOI - PMC - PubMed
    1. Asbach B, Kibler KV, Köstler J, Perdiguero B, Yates NL, Stanfield-Oakley S, Tomaras GD, Kao S-F, Foulds KE, Roederer M, Seaman MS, Montefiori DC, Parks R, Ferrari G, Forthal DN, Phogat S, Tartaglia J, Barnett SW, Self SG, Gottardo R, Cristillo AD, Weiss DE, Galmin L, Ding S, Heeney JL, Esteban M, Jacobs BL, Pantaleo G, Wagner R. 2018. Priming with a potent HIV-1 DNA vaccine frames the quality of immune responses prior to a poxvirus and protein boost. J Virol 93:e01529-18. doi:10.1128/JVI.01529-18. - DOI - PMC - PubMed
    1. Marlin R, Nugeyre M-T, Tchitchek N, Parenti M, Hocini H, Benjelloun F, Cannou C, Dereuddre-Bosquet N, Levy Y, Barré-Sinoussi F, Scarlatti G, Le Grand R, Menu E. 2017. Modified vaccinia virus Ankara vector induces specific cellular and humoral responses in the female reproductive tract, the main HIV portal of entry. J Immunol 199:1923–1932. doi:10.4049/jimmunol.1700320. - DOI - PubMed

Publication types

MeSH terms