. 2019 Aug 2;51(8):1-17.
doi: 10.1038/s12276-019-0289-0.

Altered adipocyte differentiation and unbalanced autophagy in type 2 Familial Partial Lipodystrophy: an in vitro and in vivo study of adipose tissue browning

Affiliations

Altered adipocyte differentiation and unbalanced autophagy in type 2 Familial Partial Lipodystrophy: an in vitro and in vivo study of adipose tissue browning

Camilla Pellegrini et al. Exp Mol Med. .

Abstract

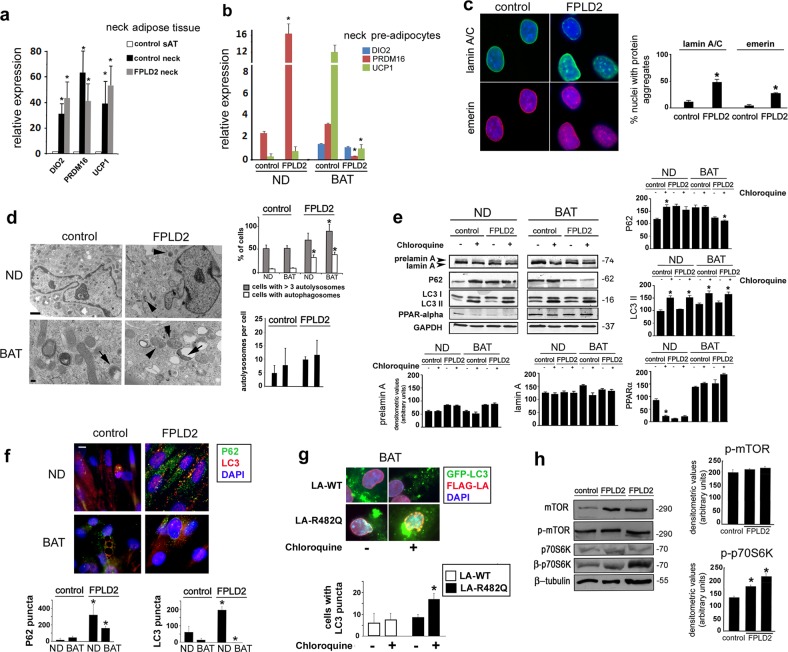
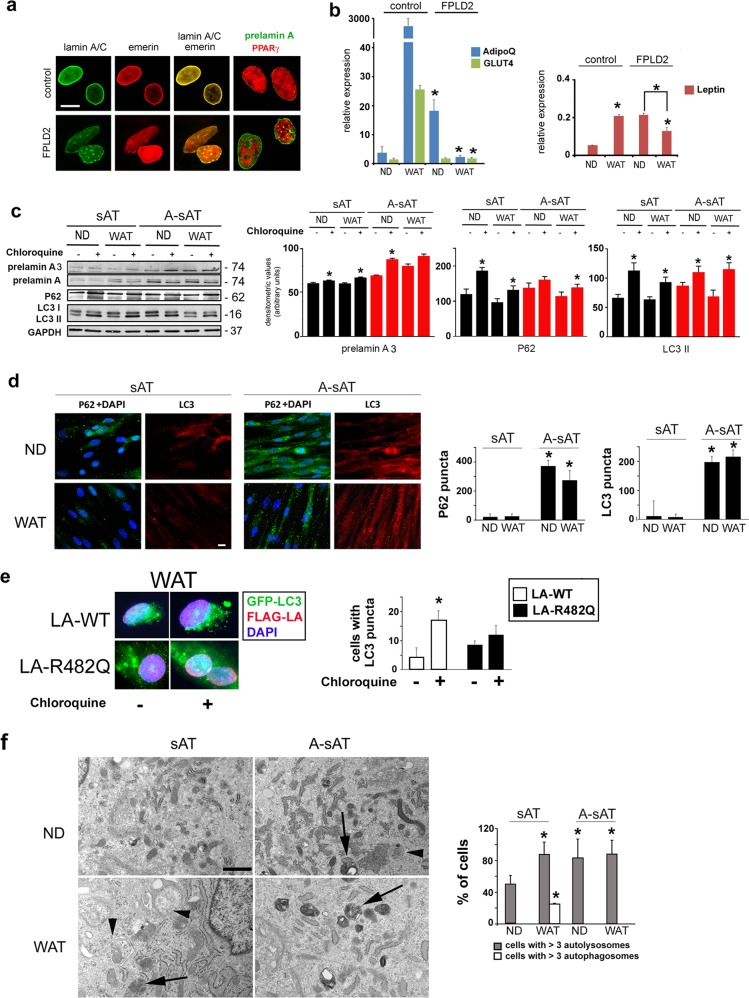
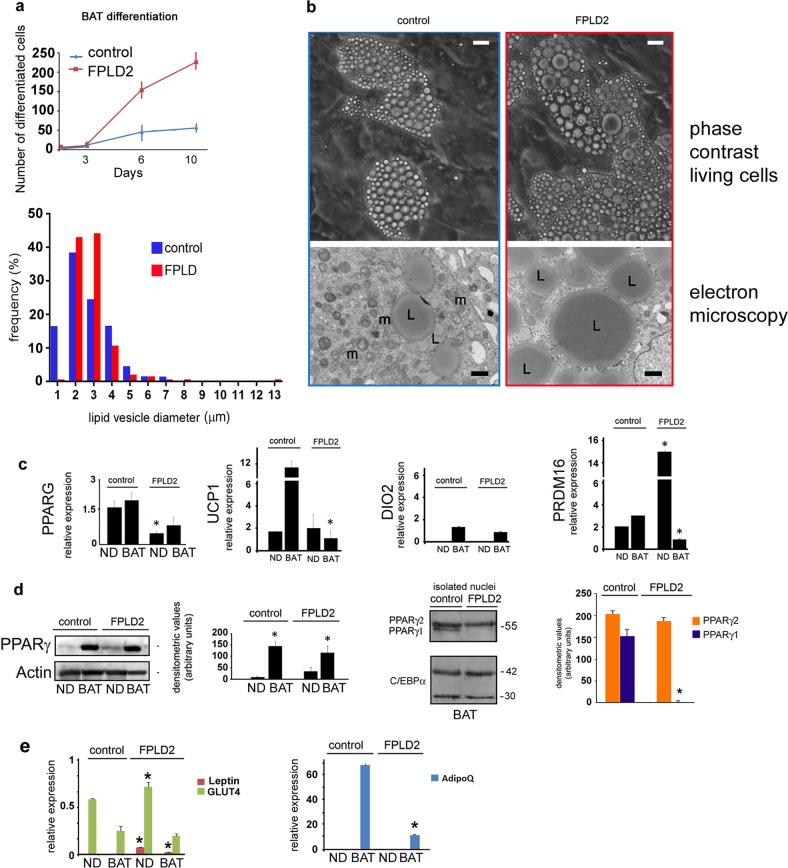
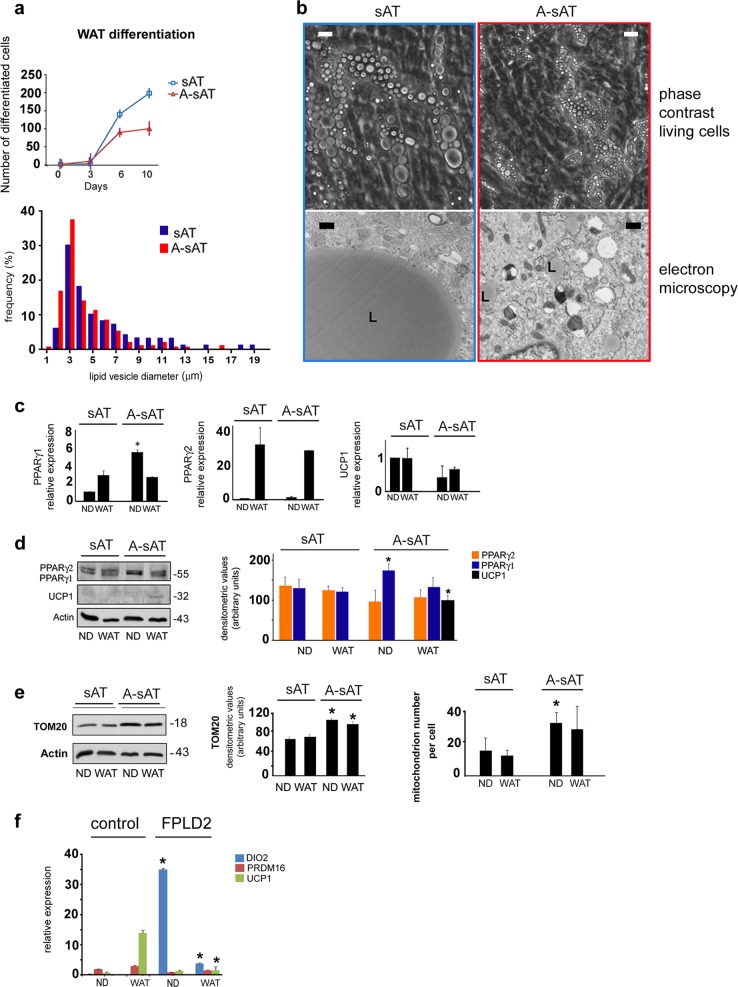
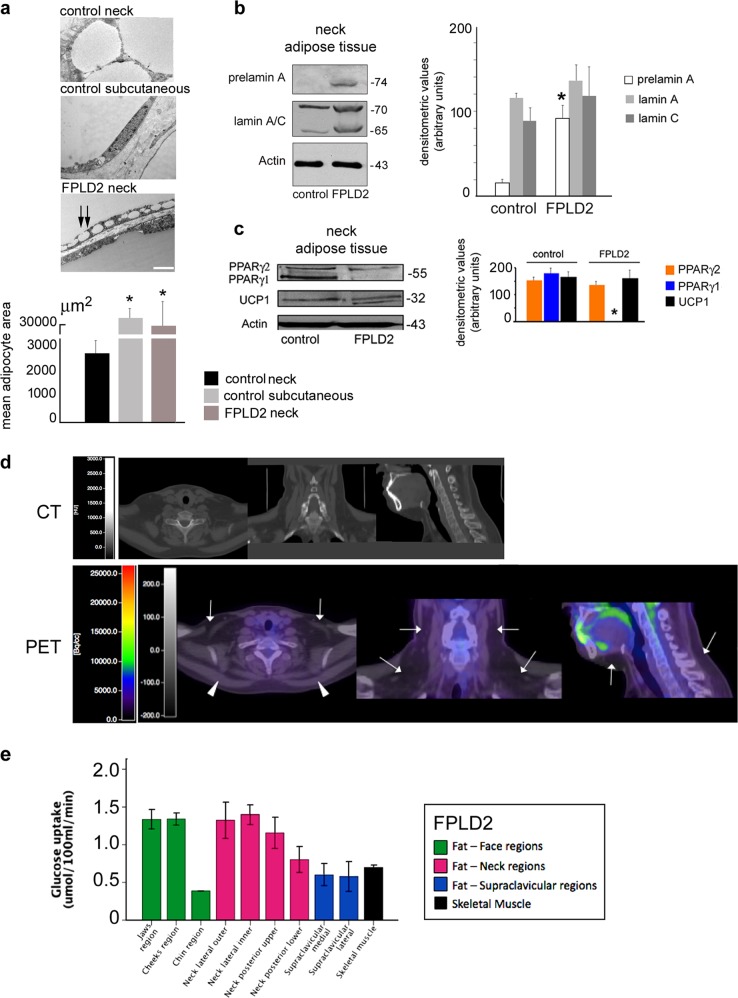
Type-2 Familial Partial Lipodystrophy is caused by LMNA mutations. Patients gradually lose subcutaneous fat from the limbs, while they accumulate adipose tissue in the face and neck. Several studies have demonstrated that autophagy is involved in the regulation of adipocyte differentiation and the maintenance of the balance between white and brown adipose tissue. We identified deregulation of autophagy in laminopathic preadipocytes before induction of differentiation. Moreover, in differentiating white adipocyte precursors, we observed impairment of large lipid droplet formation, altered regulation of adipose tissue genes, and expression of the brown adipose tissue marker UCP1. Conversely, in lipodystrophic brown adipocyte precursors induced to differentiate, we noticed activation of autophagy, formation of enlarged lipid droplets typical of white adipocytes, and dysregulation of brown adipose tissue genes. In agreement with these in vitro results indicating conversion of FPLD2 brown preadipocytes toward the white lineage, adipose tissue from FPLD2 patient neck, an area of brown adipogenesis, showed a white phenotype reminiscent of its brown origin. Moreover, in vivo morpho-functional evaluation of fat depots in the neck area of three FPLD2 patients by PET/CT analysis with cold stimulation showed the absence of brown adipose tissue activity. These findings highlight a new pathogenetic mechanism leading to improper fat distribution in lamin A-linked lipodystrophies and show that both impaired white adipocyte turnover and failure of adipose tissue browning contribute to disease.


Conflict of interest statement

The authors declare that they have no conflict of interest.

Figures

Fig. 1
Fig. 1. Early activation of autophagy in laminopathic brown preadipocytes.
a Quantitative RT-PCR analysis of the BAT markers DIO2, PRDM16, and UCP1 in subcutaneous adipose tissue of control subjects (control sAT) or in adipose tissue from the neck area of controls (control neck) or FPLD2 patients (FPLD2 neck). Statistically significant differences are referred to subcutaneous adipose tissue (control sAT) values. b Quantitative RT-PCR analysis of the BAT markers DIO2, PRDM16, and UCP1 in control or FPLD2 neck preadipocytes either non-differentiated (ND) or after 20 days of differentiation toward the brown lineage (BAT). Statistically significant differences between values measured in control and the corresponding ND or BAT FPLD2 cells are indicated (*). c Control and FPLD2 neck-derived preadipocytes (FPLD2) were costained for lamin A/C (green) and emerin (red), and nuclei were counterstained with DAPI (blue). Bar, 10 μm. The percentage of nuclei with protein aggregates (lamin A/C or emerin) is reported in the graph. Data refer to 200 nuclei per sample in three independent counts. Statistically significant differences between values measured in control and FPLD2 ND cells are indicated (*). d Electron microscopy analysis of control (control) or FPLD2 (FPLD2) neck preadipocytes. Pictures from proliferating cells (ND) or after differentiation for 20 days (BAT), displaying mitochondria, autophagosomes (arrowheads), and autolysosomes (arrows). Bar, 1 μm in the upper panels. Bar, 100 nm in the lower panels. The percentage of cells with autophagosomes or with more than three autolysosomes and the number of autolysosomes per cell are reported in the upper graph. The number of autolysosomes per cell is reported in the lower graph. Fifty cells per sample were counted in three independent experiments. Statistically significant differences between values measured in control and the corresponding ND or BAT FPLD2 cells are indicated (*). e Western blotting analysis of prelamin A and the autophagic markers P62 and LC3 in control and FPLD2 preadipocytes (same samples as in b). PPARalpha is shown as a marker of differentiation. GAPDH bands are shown as protein loading controls. Molecular weight markers are reported in kDa. Densitometric analysis of immunoblotted prelamin A, lamin A, PPARG alpha, P62, and LC3II bands is reported in the graphs. Statistically significant differences between values measured in untreated and chloroquine-treated cells are indicated (*). f Immunofluorescence analysis of P62 (green) and LC3 (red) in control and FPLD2 preadipocytes (same samples as in b). DNA was stained with DAPI (blue). Statistical analysis of the number of P62 and LC3 puncta is reported in the graphs. Bar, 10 μm. Statistically significant differences between values measured in control and the corresponding ND or BAT FPLD2 cells are indicated (*). g GFP-LC3II and FLAG-LA staining in control BAT adipocytes expressing LA-WT or LA-R482Q. Statistical analysis of the number of cells with GFP-LC3II puncta is reported in the graph. Statistically significant differences between values measured in LA-WT and the corresponding LA-R482 cells are indicated (*). h Western blotting analysis of mTOR, p-mTOR, p70S6k, and p-p70S6K in control (control) and two different FPLD2 patient ND cell cultures (FPLD2). Tubulin bands are shown as protein-loading controls. Densitometry of phosphorylated proteins is reported in the graph. When comparing wild-type and FPLD2 samples, three biological replicates were used in each experiment as well as in qRT-PCR analyses. Statistically significant differences between values measured in control and FPLD2 cells are indicated (*)
Fig. 2
Fig. 2. Early activation and block of autophagy in laminopathic white preadipocytes.
a Control and FPLD2 cultured preadipocytes from subcutaneous tissue were costained for lamin A/C (green) and emerin (red) or prelamin A (green) and PPARγ (red). Bar, 10 μm. b Quantitative RT-PCR analysis of mRNA levels of WAT markers ADIPOq, GLUT4, and leptin in control or FPLD2 white preadipocytes, either non-differentiated (ND) or after 9 days of differentiation in WAT medium (WAT). Statistically significant differences between values measured in control and the corresponding ND or WAT FPLD2 cells are indicated (*). A significant decrease in leptin values in WAT FPLD2 vs. ND FPLD2 is also indicated (*). c Control cultured preadipocytes left untreated (sAT) or treated with AFCMe (A-sAT) were examined for autophagic markers. Western blotting analysis of prelamin A, P62, and LC3 (LC3I and LC3II forms) in sAT and A-sAT cells under basal conditions (ND) or differentiated in WAT medium for 9 days (WAT). GAPDH bands are shown as protein-loading controls. Molecular weight markers are reported in kDa. Densitometric analysis of immunoblotted prelamin A, P62, and LC3II bands is reported in the graphs. Statistically significant differences between values measured in untreated and the corresponding chloroquine-treated cells are indicated (*). d Immunofluorescence detection of P62 (green) and LC3 (red) in sAT and A-sAT cells under basal conditions (ND) or differentiated in WAT medium for 9 days (WAT). DNA was stained with DAPI (blue). Statistical analysis of the number of P62 and LC3 puncta is reported in the graphs. Statistically significant differences between values measured in sAT and the corresponding A-sAT cells are indicated (*). Bar, 10 μm. e GFP-LC3II and FLAG-LA staining in control WAT adipocytes expressing wild-type LMNA or R482Q-LMNA. Statistical analysis of the number of cells with GFP-LC3II puncta is reported in the graph. Fifty cells showing FLAG staining of the nuclear lamina were examined per sample. Statistically significant differences between values measured in wild-type LMNA and the corresponding R482-LMNA cells are indicated (*). f Electron microscopy analysis of sAT and A-sAT cells under basal conditions (ND) or after 9 days in WAT medium (WAT). Arrowheads: autophagosomes; arrows: autolysosomes. Bar, 1 μm. The percentage of cells with more than three autophagosomes/autolysosomes is reported in the graph. Fifty cells per sample were counted in three independent experiments. Three biological replicates were used in each experiment as well as in qRT-PCR analyses. Statistically significant differences between values measured in sAT and the corresponding A-sAT cells are indicated (*)
Fig. 3
Fig. 3. Altered differentiation of laminopathic BAT precursors.
a Differentiation rate of control and FPLD2 BAT precursors is shown in the upper graph. The number of cells with lipid droplets observed by phase-contrast microscopy is reported. Lipid droplet diameter frequency in control and FPLD2 BAT adipocytes at day 9 of differentiation is shown in the lower graph. Data are the percentage of total counted vesicles (300 per sample in three different samples). b Representative images of cultured control and FPLD2 living cells at day 9 during BAT differentiation (phase-contrast living cells) and electron microscopy images of the same cell culture (electron microscopy). L, lipid droplet; m, mitochondrion. Bars, 10 μm for phase-contrast pictures, 1 μm for electron microscopy. c Quantification of PPARG, UCP1, DIO2, and PRDM16 expression by qRT-PCR in control and FPLD2 cells under basal conditions (ND) or after 20 days of differentiation toward the brown lineage (BAT). Statistically significant differences between control and the corresponding FPLD2 cells are indicated (*). d Western blotting and densitometric analysis of PPARγ in control and FPLD2 adipocyte precursors under basal conditions (ND) or after 20 days of differentiation (BAT). The actin band is shown as a loading control. Western blotting and densitometric analysis of PPARγ isoforms in isolated control and FPLD2 adipocyte (BAT) nuclei is shown on the right. C-EBPα bands were stained as loading controls, indicating comparable amounts of adipocytes. Molecular weight markers are reported in kDa. e Quantitative RT-PCR analysis of WAT markers leptin, GLUT4, and ADIPOq in control or FPLD2 brown adipocyte precursors. Three biological replicates were used in each experiment as well as in qRT-PCR analyses. Data are means of three independent experiments ± SD. Statistically significant differences (p < 0.05) between control and corresponding FPLD2 samples are indicated (*)
Fig. 4
Fig. 4. Altered differentiation of laminopathic WAT precursors.
a Differentiation rate of control (sAT) and laminopathic WAT precursors (A-sAT) is shown in the upper graph. Lipid droplet diameter frequency in sAT and A-sAT adipocytes at day 9 of differentiation. Data are percentage of total counted vesicles (300 per sample in three different samples). b Representative images of cultured sAT and A-sAT living cells at day 9 in WAT medium (phase-contrast living cells) and electron microscopy images are shown (electron microscopy). L, lipid droplets. Bars, 10 μm for phase-contrast pictures, 1 μm for electron microscopy. c Quantification of PPARγ1, PPARγ2, and UCP1 mRNA expression by qRT-PCR in sAT and A-sAT cells under basal conditions (ND) or exposed to WAT differentiation medium for 9 days (WAT). d Western blotting, and densitometric analysis ofPPARγ1, PPARγ2 and UCP1 in sAT and A-sAT cells under basal conditions (ND) or exposed to WAT differentiation medium for 9 days (WAT). The actin band is shown as a protein loading control. e Western blotting and densitometric analysis of TOM20 in sAT and A-sAT cells under basal conditions (ND) or exposed to WAT differentiation medium for 9 days (WAT). The actin band is shown as a protein loading control. The number of mitochondria per cell in the corresponding samples as measured by electron microscopy analysis is reported in the right graph. f Quantitative RT-PCR analysis of BAT markers DIO2, PRDM16, and UCP1 in control or FPLD2 white adipocyte precursors. Three biological replicates were used in each experiment as well as in qRT-PCR analyses. Data are means of three independent experiments ± SD. Molecular weight markers in d and e are reported in kDa. Statistically significant differences (p < 0.05) between control and corresponding FPLD2 samples are indicated by an asterisk (*)
Fig. 5
Fig. 5. Neck FPLD2 adipose tissue shows an intermediate brown/white phenotype and absence of BAT activity.
Characterization of adipose tissue isolated from the neck district of healthy donors (control neck), subcutaneous tissue from the leg of healthy donors (control subcutaneous), and FPLD2 patients neck (FPLD2 neck) is shown in ac. a Electron microscopy analysis of control and FPLD2 adipose tissue. Small lipid droplets fusing to a large droplet are indicated by double arrows. Bar, 2 μm. The mean adipocyte area is reported in the graph. Statistically significant differences relative to control neck tissue are indicated (*). b Western blot analysis of prelamin A and lamin A/C in control and FPLD2 adipose tissue, and densitometric analysis. Statistically significant differences between control and FPLD2 tissue samples are indicated (*). c Western blotting analysis of PPARγ and UCP1 in control and FPLD2 adipose tissue and densitometric analysis. Statistically significant differences between control and FPLD2 tissue samples are indicated (*). In b and c: actin band is shown as a protein-loading control; molecular weight markers are reported in kDa. Cold-induced fat 18F-2-fluoro-2-deoxy-D-glucose (18F-FDG) uptake in the supraclavicular regions, face, neck, and skeletal muscle of FPLD2 patients is shown in d, e. d Representative CT and CT-PET images referring to one out of three examined FPLD2 patients are shown. e Levels of cold-induced glucose uptake (18F-2-fluoro-2-deoxy-D-glucose (18F-FDG) uptake) in fat depots of the face, neck supraclavicular regions, and trapezius muscle (skeletal muscle) of FPLD2 patients. Data are means ± SD

References

    1. Vigouroux C, Caron-Debarle M, Le Dour C, Magre J, Capeau J. Molecular mechanisms of human lipodystrophies: from adipocyte lipid droplet to oxidative stress and lipotoxicity. Int J. Biochem. Cell Biol. 2011;43:862–876. doi: 10.1016/j.biocel.2011.03.002. - DOI - PubMed
    1. Patni N, Garg A. Congenital generalized lipodystrophies–new insights into metabolic dysfunction. Nat. Rev. Endocrinol. 2015;11:522–534. doi: 10.1038/nrendo.2015.123. - DOI - PMC - PubMed
    1. Bidault G, Vatier C, Capeau J, Vigouroux C, Bereziat V. LMNA-linked lipodystrophies: from altered fat distribution to cellular alterations. Biochem. Soc. Trans. 2011;39:1752–1757. doi: 10.1042/BST20110675. - DOI - PubMed
    1. Brown RJ, et al. The diagnosis and management of lipodystrophy syndromes: a multi-society practice guideline. J. Clin. Endocrinol. Metab. 2016;101:4500–4511. doi: 10.1210/jc.2016-2466. - DOI - PMC - PubMed
    1. Capanni C, et al. Altered pre-lamin A processing is a common mechanism leading to lipodystrophy. Hum. Mol. Genet. 2005;14:1489–1502. doi: 10.1093/hmg/ddi158. - DOI - PubMed

Publication types