. 2019 Aug 2;10(1):3477.
doi: 10.1038/s41467-019-11054-7.

Pluripotency reprogramming by competent and incompetent POU factors uncovers temporal dependency for Oct4 and Sox2

Affiliations

Pluripotency reprogramming by competent and incompetent POU factors uncovers temporal dependency for Oct4 and Sox2

Vikas Malik et al. Nat Commun. .

Abstract

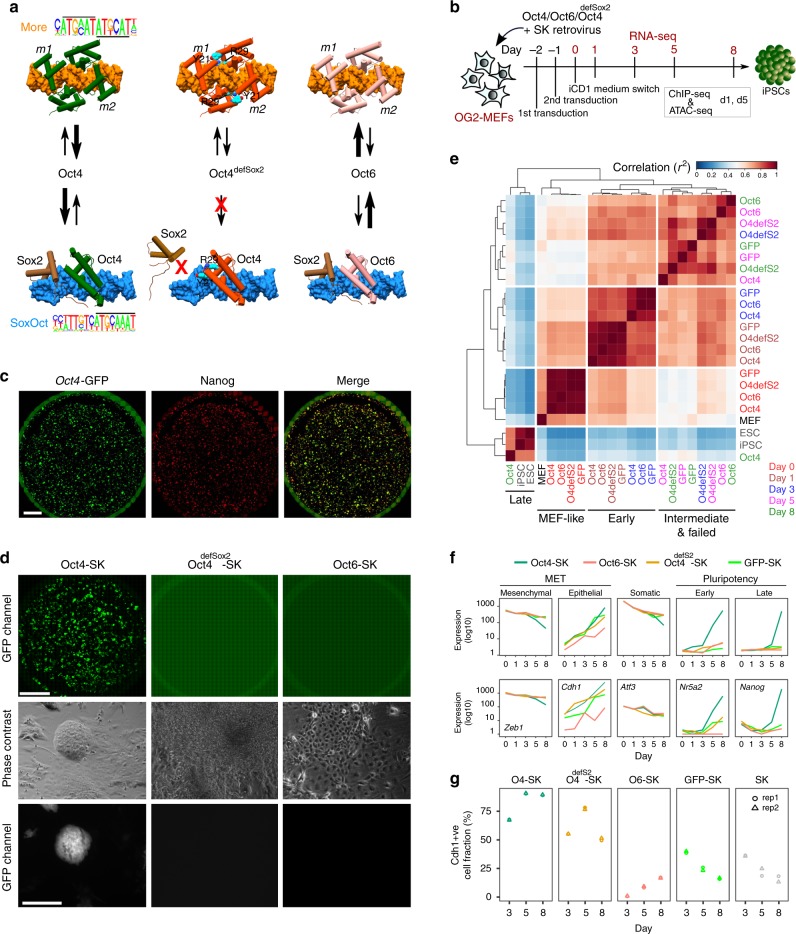
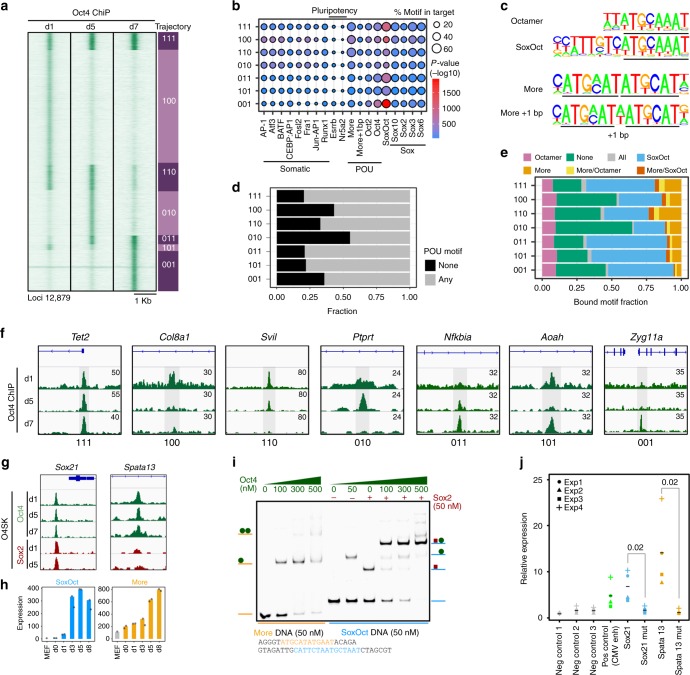
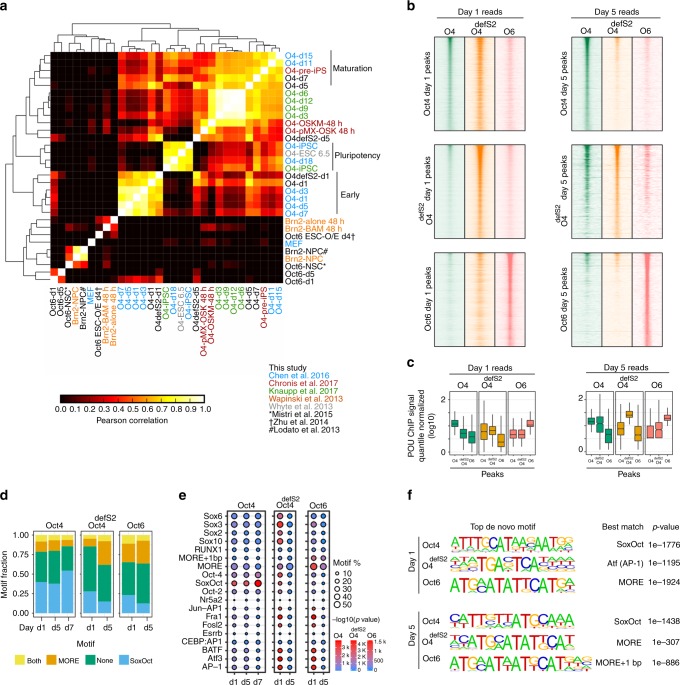
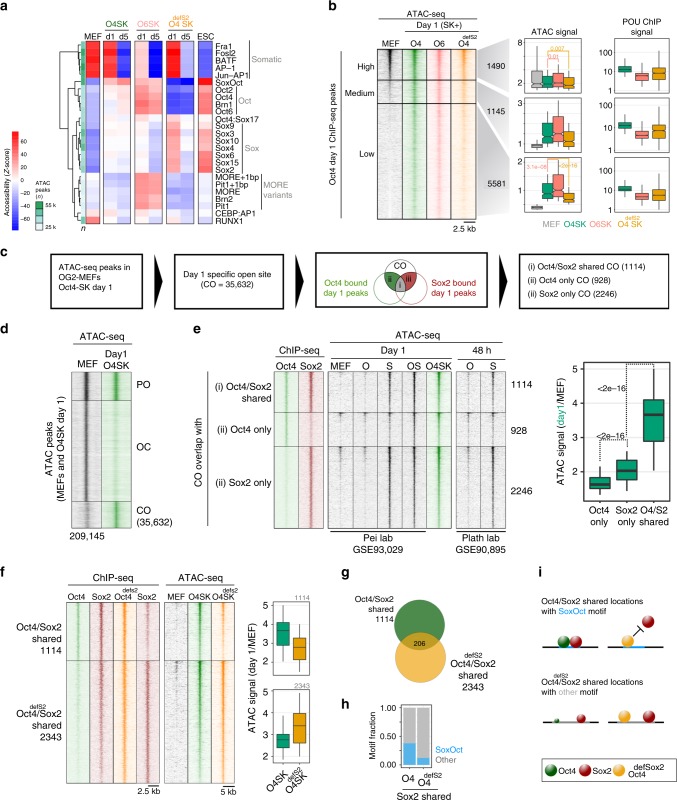
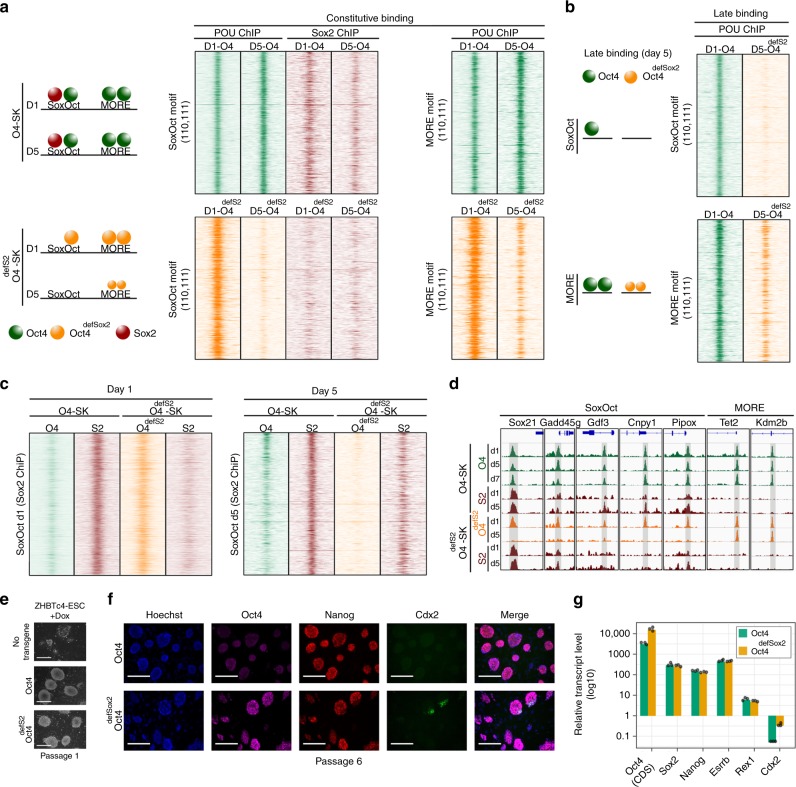
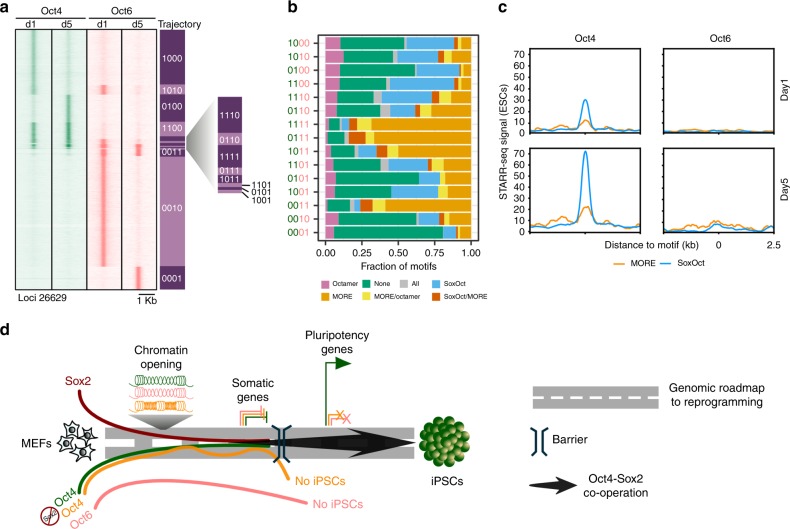
Oct4, along with Sox2 and Klf4 (SK), can induce pluripotency but structurally similar factors like Oct6 cannot. To decode why Oct4 has this unique ability, we compare Oct4-binding, accessibility patterns and transcriptional waves with Oct6 and an Oct4 mutant defective in the dimerization with Sox2 (Oct4defSox2). We find that initial silencing of the somatic program proceeds indistinguishably with or without Oct4. Oct6 mitigates the mesenchymal-to-epithelial transition and derails reprogramming. These effects are a consequence of differences in genome-wide binding, as the early binding profile of Oct4defSox2 resembles Oct4, whilst Oct6 does not bind pluripotency enhancers. Nevertheless, in the Oct6-SK condition many otherwise Oct4-bound locations become accessible but chromatin opening is compromised when Oct4defSox2 occupies these sites. We find that Sox2 predominantly facilitates chromatin opening, whilst Oct4 serves an accessory role. Formation of Oct4/Sox2 heterodimers is essential for pluripotency establishment; however, reliance on Oct4/Sox2 heterodimers declines during pluripotency maintenance.


Conflict of interest statement

The authors declare no competing interests.

Figures

Fig. 1
Fig. 1
Reprogramming trajectories of cocktails containing Oct4, Oct6, Oct4defSox2, or GFP in chemically defined medium. a The cartoons represent the preferences of the POU proteins for the DNA-dependent homodimerization on MORE versus heterodimerization with Sox2 on SoxOct elements determined using quantitative biochemical assays. MORE DNA is shown in orange and SoxOct DNA in blue; m1 is monomer 1 and m2 is monomer2. The thickness of the arrows illustrates the DNA binding preferences. b Experimental design of reprogramming and RNA-seq, ATAC-seq, and ChIP-seq experiments. c Whole-well scans from a 6-well plate using GFP channel (Oct4-GFP), Nanog immunofluorescence and merged panels; for OG2-MEF cells reprogrammed with Oct4-SK at day 8; scale 5 mm. d Whole-well scans (upper panel) of wells from 12-well plate using GFP channel for three POU factors (Oct4, Oct4defSox2, and Oct6); scale 5 mm. Representative phase contrast (middle panel) and corresponding Oct4-GFP fluorescence (lower panel) images of reprogramming experiments; time-point: day 8 post transduction; scale 200 μm. e Hierarchically clustered heatmap based on r2 correlation coefficients using RNA-seq reads as input. iPSCs and ESCs expression data are from GSE93029. f Mean gene expression trajectories for indicated categories (upper panel) or a representative gene from each category (lower panel) in four reprogramming conditions. See Supplementary Fig. 1E for a larger panel of genes for each category. g Fraction of E-cadherin positive (Cdh1 + ve) cells at different stages of reprogramming in indicated cocktails. FACS was performed in technical duplicates (n = 2). Source data for FACS experiment are provided as a Source Data file
Fig. 2
Fig. 2
Determinants for the binding trajectories of Oct4. a Heatmap of Oct4 ChIP-seq signal within 2 kb window centered at Oct4 summits. Rows are Oct4 peaks arranged in 7 binary trajectories. 1 indicates presence and 0 absence of binding; left to right digits are days 1, 5 and 7. Summits were merged if within 100 bp. Genomic locations are provided in Supplementary Data 2. b Enrichment of selected TF motifs in Oct4 occupancy trajectories. Point size represents the proportion of sequences with the motif and color gradient (blue to red) the p-value score. c Consensus binding motifs of Oct4 represented as PWMs (position weight matrices). POU binding sites are underlined. d Proportion of ChIP-seq peaks in each occupancy trajectory featuring ‘any’ (consensus motifs shown in c) or ‘none’ of these POU motifs. e Fraction of binding locations for each occupancy trajectory containing the indicated POU motifs. ‘All’ refers to peaks where motif scanning concurrently detected all the POU motifs listed in (c) and ‘none’ the absence of any of these motifs. f Genome browser track of Oct4 ChIP-seq peaks (shaded gray) for selected trajectories. Genomic coordinates for the summits are listed in Supplementary Table 4. g Genome browser tracks of constitutively bound Oct4 and Sox2 ChIP-seq peaks containing either SoxOct (near Sox21 gene) or MORE (near Spata13 gene) motifs. h Gene expression (mean tag counts as bar and individual technical replicate as dots) of Sox21 and Spata13 in the Oct4 condition. i EMSAs using Oct4-POU and Sox2-HMG protein constructs and DNA probes containing SoxOct elements (near the Sox21 gene) or MORE elements (near the Spata13 gene). EMSA probes are provided in Supplementary Table 5. j STARR reporter assay in ESCs with Oct4 bound regions from (g) near Sox21 or Spata13. The positive and negative control sequences are shown in Supplementary Table 8. Each data point (n = 4, biological replicates) is shown with mean as black bar; indicated p-values were calculated by Student’s t-test. Source data for i and j are provided as a Source Data file
Fig. 3
Fig. 3
POU TFs exhibit distinctive binding profiles and motif preferences. a Hierarchical clustering of the pairwise correlation coefficients (R2) of ChIP-seq signals from Oct4, Oct4defSox2 and Oct6 ChIP-seq peaks with publically available ChIP-seq datasets for Oct4, Oct6 and Brn2–,,,,,. b ChIP-seq signal heatmaps for Oct4 (green), Oct4defSox2 (orange), and Oct6 (salmon) at days 1 (left panels) and 5 (right panels) centered on ChIP-seq peaks for Oct4 (top panels), Oct4defSox2 (middle panels) and Oct6 (bottom panels). c Boxplots of quantile normalized ChIP-seq signals at Oct4, Oct4defSox2 and Oct6 peaks at days 1 and 5 from heatmaps in (b). For the boxplots, the midline indicates the median, boxes indicate the upper and lower quartiles and the whiskers indicate 1.5 times interquartile range. d Fraction of binding locations containing MORE (including MORE variant with 1 bp spacer) or SoxOct elements at different reprogramming stages. ‘Both’ refers to peaks where motif scanning detected MORE and SoxOct motifs concurrently and ‘none’ the absence of either of the two motifs. e Enrichment of selected TF motifs in ChIP-seq peaks at days 1 and 5 for Oct4, Oct4defSox2, and Oct6. Size represents fractional occurrences and color gradient the p-value scores. f Top de novo motifs for Oct4, Oct4defSox2 and Oct6 at days 1 and 5. In the HOMER database the MORE motif is designated as Pit1 and MORE + 1 bp as Pit1 + 1bp
Fig. 4
Fig. 4
Sox2 facilitates chromatin opening and Oct4 augments it. a Accessibility variation of ATAC-seq peaks categorized by the presence of selected motifs was determined by chromVAR. Data are scaled row-wise. The color gradient denotes high (red) and low (blue) accessibility. n = number of ATAC-seq peaks containing indicated motifs. b Oct4 ChIP-seq peaks at day 1 were ranked by ATAC-seq read coverage in MEFs and grouped into sites with high (read counts > 30, n = 1490), medium (read counts = 15 to 30, n = 1145) and low-accessibility in MEFs (read counts < 15, n = 5581). Box plots show ATAC-seq and POU ChIP-seq signals at peaks from three corresponding groups. c Analysis flow chart to interrogate the role of Oct4 and Sox2 in facilitating chromatin opening. d ATAC-seq signal heatmaps grouped by three chromatin trajectories: PO (permanently open), OC (open to close), CO (close to open) defined using ATAC-seq peaks from MEFs (GSE93029) and the Oct4-SK day 1 condition. Numbers indicate peak numbers. e The CO category was further grouped by the presence of Sox2 and Oct4 ChIP-seq peaks from day 1Oct4-SK condition. ChIP-seq and ATAC-seq signal heatmaps were generated using data from this study and indicated sources. Boxplots represent the day1 by MEF ATAC-seq signal ratio. f Heatmaps showing the ChIP-seq (left) and ATAC-seq (right) signals at ChIP-seq peaks defined by co-binding of Oct4/Sox2 or Oct4defSox2/Sox2. Boxplots are day 1/MEF ATAC-signal ratios over the two peak sets. g Overlap of Oct4/Sox2 and Oct4defSox2/Sox2 ChIP-seq peaks. h Fraction of Oct4/Sox2 and Oct4defSox2/Sox2 peaks with matches to the canonical SoxOct motif. i Oct4defSox2 prevents Sox2 from targeting sites with canonical SoxOct elements whilst co-binding of Oct4defSox2/Sox2 at alternative locations is permitted. The size of spheres schematically represent binding preferences. p-values in b and e were calculated using the unpaired Wilcoxon rank sum test (R function pairwise.wilcox.test) adjusted for multiple testing using the Holm method. ATAC-seq boxplots show signals normalized using EAseq (DNA fragments per kilobase pairs (kbp) per million (m) reads) and POU ChIP-seq read coverage boxplots were quantile normalized. Genomic locations for b, d, e, and f are provided in Supplementary Data 2. For the boxplots, the midline indicates the median, boxes indicate the upper and lower quartiles and the whiskers indicate 1.5 times interquartile range
Fig. 5
Fig. 5
Oct4defSox2 targets pluripotency enhancers but eventually derails. a Heat maps of ChIP-seq reads at days 1 and 5 for Oct4, Oct4defSox2 and Sox2 in Oct4-SK (top panels) or Oct4defSox2-SK (bottom panels) cocktails centered at Oct4 constitutively bound occupancy trajectories (‘110’ and ‘111’) containing SoxOct motifs (left panels) or MORE motifs (right panel). A cartoon on the left summarizes the results. b ChIP-seq reads at day 5 for Oct4 and Oct4defSox2 for Oct4 late bound occupancy trajectories ‘010’ and ‘011’ at SoxOct (top) or MORE (bottom) locations. c Heatmap of Oct4, Oct4defSox2 and Sox2 ChIP-seq signals at days 1 and 5. Rows are Sox2 ChIP-seq peaks called in the Oct4-SK condition containing SoxOct motifs at day 1 (left panel) and day 5 (right panel). ChIP-seq signal heatmaps in a, b and c are normalized using EAseq (DNA fragments per kilobase pairs (kbp) per million (M) reads) and shown for 2 kb genomic intervals centered on midpoints or motifs. d Genome browser tracks of selected Oct4, Oct4defSox2 and corresponding Sox2 ChIP-seq peaks are shown at different days of reprogramming. The nearest genes and motif under the peaks are mentioned on the top. Genomic coordinates for the summits are listed in Supplementary Table 4. e Phase-contrast images of conditional Oct4-knockout ZHBTc4 ESCs rescued with wild-type Oct4 or Oct4defSox2 after culturing for 6 days in the presence of Dox (passage 1). Scale = 100 μm. f Fluorescence images of ZHBTc4 ESCs rescued with wild-type Oct4 or Oct4defSox2 after 6 passages in the presence of Dox. Scale = 100 μm. The antibodies list is in Supplementary Table 11. g qRT-PCR analysis of selected gene expression of ZHBTc4 ESCs rescued with wild-type Oct4 or Oct4defSox2 after 6 passages in the presence of Dox. The expression is relative to untransduced control induced with Dox for 7 days. Rpl37a was used as a house keeping gene. Individual data points are shown as black jitter plots (n= 3, technical replicates). The primers for Oct4 CDS (coding DNA sequence) and other markers are mentioned in Supplementary Table 10 and Source data are provided as a Source Data file
Fig. 6
Fig. 6
Oct6 binds to alternative targets and avoids pluripotency enhancers. a Comparison of Oct4 (green color) and Oct6 (salmon color) ChIP-seq signals at days 1 and 5 of reprogramming. Rows are 15 occupancy trajectories defined by the presence or absence of Oct4 or Oct6 peaks at day 1 or 5 (1 = binding, 0 = absence of binding). The summits were merged if they were within 100 bp. Genomic locations are provided in Supplementary Data 2. b Fraction of POU motifs mapping to binding sites in each of the occupancy trajectories. c Read pileup plots of STARR-seq signal (enhancer activity) in ESCs at Oct4 (left) and Oct6 (right) binding sites at days 1 (up) and 5 (bottom) of reprogramming containing either SoxOct or MORE motifs. d Model for unique and dispensable roles of Oct4 at different stages of somatic cell reprogramming

References

    1. Ieda M, et al. Direct reprogramming of fibroblasts into functional cardiomyocytes by defined factors. Cell. 2010;142:375–386. doi: 10.1016/j.cell.2010.07.002. - DOI - PMC - PubMed
    1. Takahashi K, Yamanaka S. Induction of pluripotent stem cells from mouse embryonic and adult fibroblast cultures by defined factors. Cell. 2006;126:663–676. doi: 10.1016/j.cell.2006.07.024. - DOI - PubMed
    1. Vierbuchen T, et al. Direct conversion of fibroblasts to functional neurons by defined factors. Nature. 2010;463:1035–1041. doi: 10.1038/nature08797. - DOI - PMC - PubMed
    1. Chen J, et al. Hierarchical Oct4 binding in concert with primed epigenetic rearrangements during somatic cell reprogramming. Cell Rep. 2016;14:1540–1554. doi: 10.1016/j.celrep.2016.01.013. - DOI - PubMed
    1. Chronis C, et al. Cooperative binding of transcription factors orchestrates reprogramming. Cell. 2017;168:442–459 e420. doi: 10.1016/j.cell.2016.12.016. - DOI - PMC - PubMed

Publication types

MeSH terms