. 2019 Aug 2;10(1):3486.
doi: 10.1038/s41467-019-11477-2.

Regulation of Notch output dynamics via specific E(spl)-HLH factors during bristle patterning in Drosophila

Affiliations

Regulation of Notch output dynamics via specific E(spl)-HLH factors during bristle patterning in Drosophila

Lydie Couturier et al. Nat Commun. .

Abstract

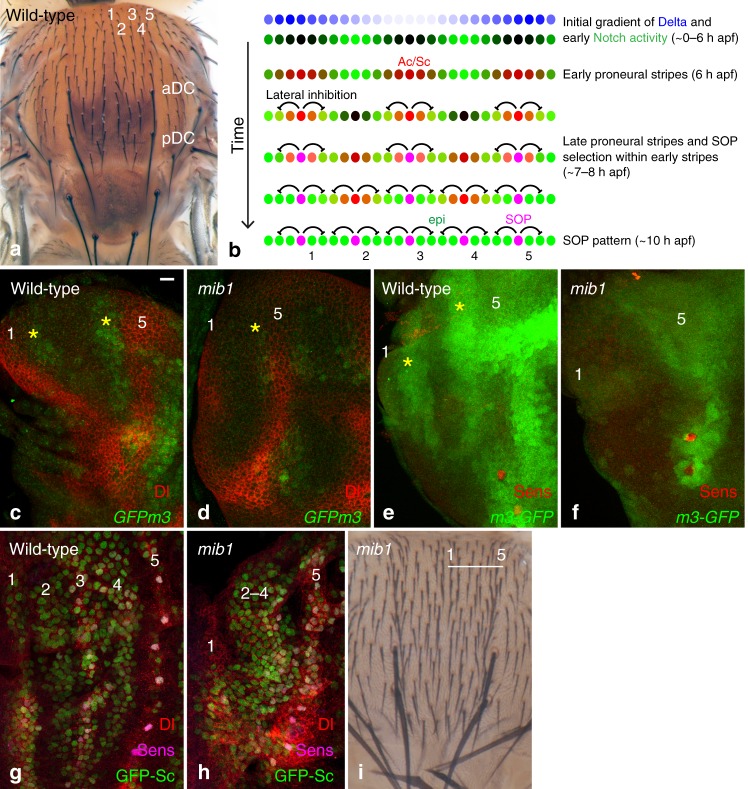
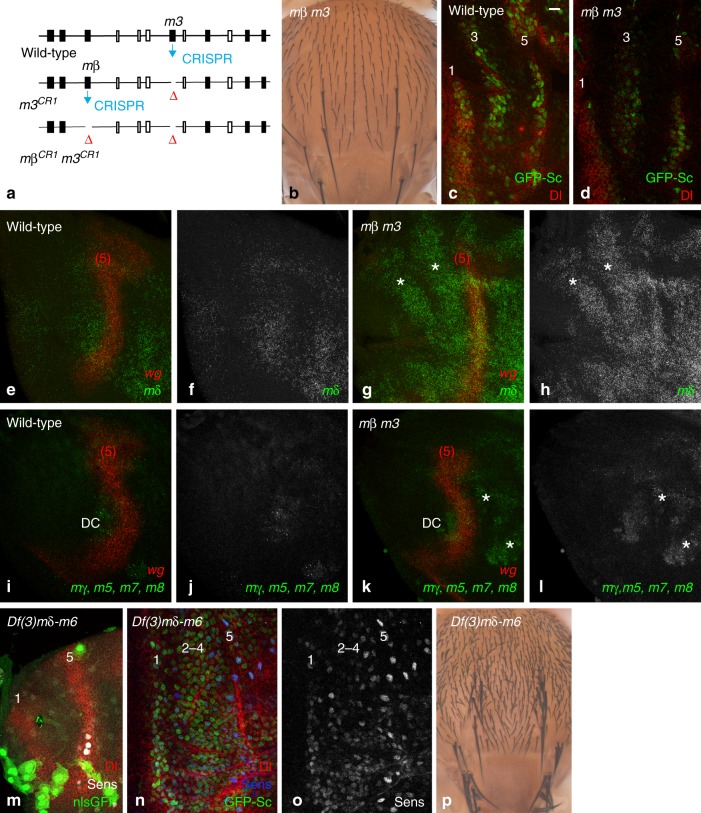
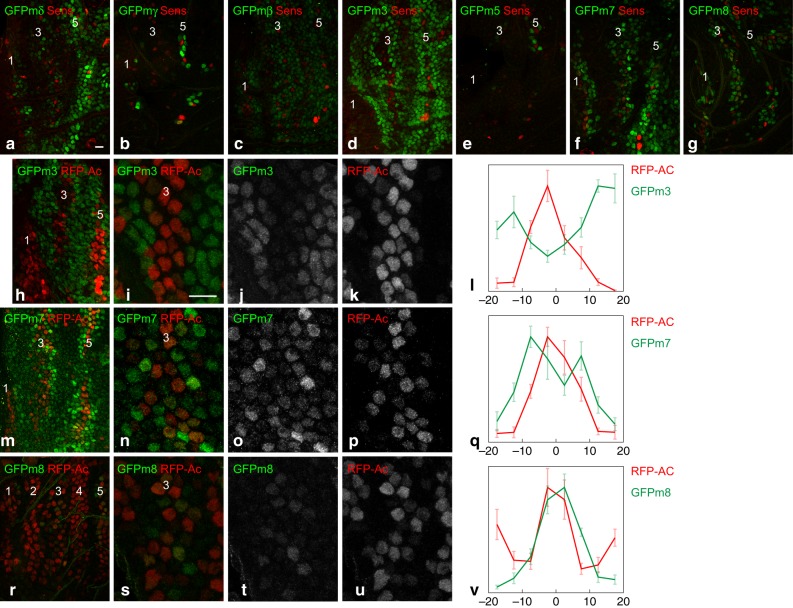
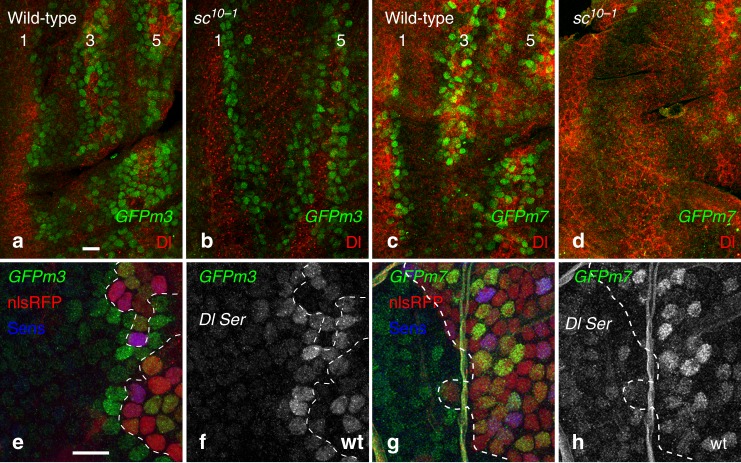
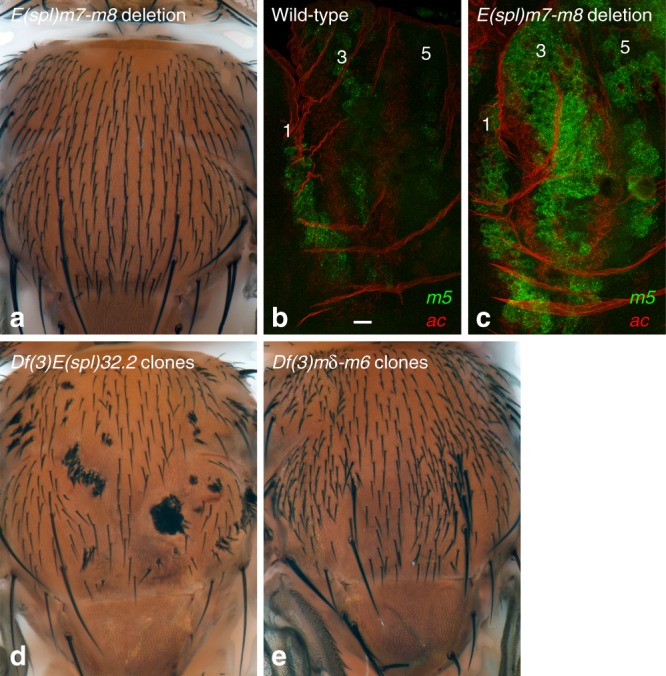
The stereotyped arrangement of sensory bristles on the adult fly thorax arises from a self-organized process, in which inhibitory Notch signaling both delimits proneural stripes and singles out sensory organ precursor cells (SOPs). A dynamic balance between proneural factors and Enhancer of split-HLH (E(spl)-HLH) Notch targets underlies patterning, but how this is regulated is unclear. Here, were identify two classes of E(spl)-HLH factors, whose expression both precedes and delimits proneural activity, and is dependent on proneural activity and required for proper SOP spacing within the stripes, respectively. These two classes are partially redundant, since a member of the second class, that is normally cross-repressed by members of the first class, can functionally compensate for their absence. The regulation of specific E(spl)-HLH genes by proneural factors amplifies the response to Notch as SOPs are being selected, contributing to patterning dynamics in the notum, and likely operates in other developmental contexts.


Conflict of interest statement

The authors declare no competing interests.

Figures

Fig. 1
Fig. 1
mib1-dependent Notch activity is required for stripe patterning. a A dorsal view of a wild-type adult fly showing the five regular rows of microchaetae (1–5) on each hemi-notum. The anterior and posterior DC macrochaetae (aDC and pDC) are located at the base of row 5. b Patterning dynamics in the notum: downstream of a bimodal gradient of Dl, a proneural-independent pattern of Notch activity (green) determines the position of the first proneural stripes (proneural activity, red). As the pattern of Notch activity evolves, two additional proneural stripes emerge and SOPs (magenta) are selected within each stripe. c, d GFPm3 (GFP, green) is expressed in two stripes of cells (yellow asterisks) flanking cells expressing high levels of Dl (red; located at the position of the future stripes 1 and 5) in 2.5 h apf wild-type nota (c). The expression of GFPm3 is strongly reduced in mib1 mutant pupae (d). e, f A m3-GFP transcriptional reporter (GFP, green) is expressed at high levels in two stripes of cells (yellow asterisks) flanking stripes 1 and 5 in 2.5 h apf wild-type nota (e). Expression of the m3-GFP transcriptional reporter is strongly reduced in mib1 mutant pupae f Sens, red, marks cells of the DC macrochaetae along stripe 5. g, h Five proneural stripes (GFP-Sc, green) are observed in wild-type 7–8 h apf pupae (g). Note that the expression of GFP-Sc is already resolved to singled-out SOPs in row 5 (Sens, magenta; Dl, red). In mib1 mutant pupae (h), a broad domain of proneural cells expressing GFP-Sc is observed in the region corresponding to stripes 2–4, whereas stripes 1 and 5 can be identified. i Adult mib1 mutant flies exhibit a disordered array of regularly spaced bristles, but no clear pattern of rows, in the DC region of the notum. Bristle density is increased. Scale bar is 10 μm (c: ch). In this and all other figures, representative images of >6 samples (>2 images per sample), from >2 experiments are shown
Fig. 2
Fig. 2
the E(spl)-C genes mediate the negative template activity of Notch. a Two FRT sites flanking the m7 and m8 genes were inserted by CRISPR-mediated HR to generate the m7/8FRT chromosome. A small E(spl)m7-m8 deletion was then generated by flp-out. b Tissue-specific knock-out of the E(spl)-C. Recombination between a FRT located within a PiggyBac element inserted into the Nf1 gene (marked by white+) and the FRT sites of the m7/8FRT chromosome (marked by RFP) produced the E(spl)-CFRT0 chromosome. Flp-mediated deletion of the white marker, leaving a single proximal FRT, and of the m7 and m8 genes, leaving a single distal FRT, produced the E(spl)-C)FRT3 chromosome which was used for tissue-specific flp-out to produce a 55 kb E(spl)-C deletion. cl Sensory organ development was studied in control (cg;+/E(spl)-CFRT3 apts>flp pupae) and deletion nota (hl; Df(3)P11/ E(spl)-CFRT3 apts>flp pupae). At 7 h apf, GFP-Sc (green) and Sens (red) were expressed in a pattern of five proneural stripes in control pupae (c, d), similarly as in wild-type pupae (Fig. 1g) whereas nearly all notum cells expressed GFP-Sc and Sens upon conditional knock-out (h, i). Thus, the E(spl)-C genes are required for the patterning of the proneural stripes. Regular rows of SOPs (e, 15 h apf) and sensory bristles (f, 24 h apf; Elav, blue, is a neuronal marker; Cut, red, marks all sensory cells; Su(H), green, marks the socket cells; g, adult notum) were seen in control flies. In contrast, too many SOPs (j, 15 h apf) produced mostly positive neurons (k, 24 h apf), hence leading to a strong bristle loss phenotype (l) upon notum-specific deletion of the E(spl)-C. These Notch-like phenotypes indicate that the E(spl)-C genes are key Notch targets for the formation of sensory organs. Scale bar is 10 μm (c: cl)
Fig. 3
Fig. 3
a complete set of E(spl)-HLH reporters. a Genomic structure of the E(spl)-C BAC. The seven E(spl)-HLH genes are shown in black, other genes appear as open boxes. The complete series of BAC transgenes encoding GFP-tagged fusion proteins, as well as the BAC transgene encoding a transcriptional reporter for the m3 gene, m3-GFP, are diagrammatically shown. A CRISPR knock-in locus with GFP-tagged m3 and a FRT site 3’ to the m3 gene is also shown. bj Expression pattern of these E(spl)-HLH reporters (GFP, green) in third instar wing imaginal discs. Both the GFPm3 BAC transgene (e) and CRISPR knock-in line (f) are shown. Scale bar is 15 μm (b: bj)
Fig. 4
Fig. 4
m3 and are expressed early in response to the bimodal gradient of Dl. GFPmδ (a) GFPmβ (b), GFPm3 (c), and GFPm7 (d) reporters (GFP, green) are detected at 2.5 h apf. GFPmβ is expressed in stripes like GFPm3. GFPmδ, and GFPm7 are weakly expressed in the non-selected cells from the DC proneural cluster. Sens (red) marked sensory cells of the future DC macrochaetae, used here as a landmark position for the future proneural stripe 5. Scale bar is 10 μm (a: ad)
Fig. 5
Fig. 5
E(spl)-HLH genes are required for stripe patterning. a A two-step CRISPR-based deletion of the m3 and ORFs to rpoduce a double mutant chromosome. b Dorsal thorax of an adult m3 mβ / Df(3)X10 fly showing no bristle patterning defect. The X10 deletion removes the mδ-m3 genes and extends beyond . c, d The early GFP-Sc proneural stripe pattern (GFP, green; Dl, red) is seen in both wild-type and m3 mβ mutant pupae at 7 h apf. eh mRNAs (smiFISH probe, green) were not detected in the notum region of wild-type 0–2 h apf pupae (e, f; wg probe, red in e; the wg stripe, indicated as (5), overlapped with proneural stripe 5). In contrast, mRNAs were detected in the notum of m3 mβ pupae in a pattern similar to GFPm3 in early wild-type pupae (asterisks in g, h; see also Fig. 4c). Higher accumulation of was also detected in more distal area, indicative of negative regulation of by m3 and/or mβ. il The , m5, m7, and m8 transcripts (mixed smiFISH probe, green) were not detected in the notum region of wild-type and m3 mβ mutant pupae at 0–2 h apf (wg, red). Higher levels of , m5, m7, and/or m8 transcripts were detected in the DC cluster and in distal parts of the notum (asterisks in k, l). m Nota comprising only cells homozygous for the Df(3L)mδ-m6 deletion, marked by the loss of nlsGFP (green) were obtained using the Minute technique (large green cells are non-epithelial macrophages). Dl expression (red; Sens, white) remained unaffected at 2.5 h apf. n, o Deletion of the the -m6 genes resulted in defective stripe patterning at 7–8 h apf. A broad domain of GFP-Sc expression (green, n) was observed over the stripes 2–4 region, whereas stripes 1 and 5 could be identified (Sens, o). This phenotype is similar to the mib1 mutant phenotype (Fig. 1h). p Adult flies harboring Df(3L)mδ-m6 mutant cells in the notum show a strongly disordered array of spaced bristles with no pattern of rows but increased bristle density. Scale bar is 10 μm (c: co)
Fig. 6
Fig. 6
Early-onset and late-onset E(spl)-HLH factors exhibit distinct accumulation patterns. ag Expression of GFP-tagged E(spl)-HLH factors (GFP, green) at 8 h apf. The early-onset factors mβ (c) and m3 (d) appeared to accumulate on the sides of the proneural stripes (Sens, red), whereas the late-onset factors mδ (a), m7 (f), m8 (g) and, to a lesser extent mγ (b) and m5 (e), appeared to be intermingled with the Sens-positive proneural stripe cells. hl GFPm3 (green) accumulated in cells with very low Ac levels (red), flanking the proneural stripe 3, as shown in the high magnification views of stripe 3 at ~7.5 h apf in ik, and the corresponding quantification of the GFP and RFP nuclear signals in l (n = 5; the mean + /− standard error of normalized intensities is plotted as a function of the distance, in μm, relative to the center of the stripe). mv GFPm7 (green; mq; ~7.5 h apf) and GFPm8 (green; rv; ~8 h apf) accumulated in proneural stripe 3 cells with low/intermediate levels of Ac (red), but not in presumptive SOPs that have high levels of Ac. Note that fewer cells express GFPm8 at the onset of proneural stripe 3, suggesting that GFPm7 may be expressed slightly earlier than GFPm8. High magnification views (mp and su) and quantifications (q, n = 7; v, n = 9) as in panels i-l. Scale bars are 10 μm (a: ah, m, r; i: ik, np, su)
Fig. 7
Fig. 7
Regulation of the late onset E(spl)-HLH genes by Ac and Sc. ad Pattern of expression of the GFPm3 (a, b) and GFPm7 (c, d) reporters (GFP, green; Dl, red) in the notum of wild-type (a, c) and sc10–1 (b, d) 7–8 h apf pupae. While the expression of GFPm3 did not depend on Ac and Sc (a, b), GFPm7 was not expressed in the absence of Ac and Sc (c, d) with the exception of a few anterior cells along stripe 5 (d). Note that the expression of Dl in stripe 3 did not depend on Ac and Sc. eh GFPm3 (GFP, green in e, f) was not expressed by Dlrev10 SerRX10 mutant cells (clone border outlined by a white dashed line; non-mutant cells express nlsRFP, red; Sens, blue) with the notable exception of the mutant receiving cells that are in direct contact with the wild-type signal sending cells (e, f). In contrast, expression of GFPm7 (GFP, green in g, h) was observed in mutant cells, indicating that expression of the m7 gene did not strictly depend on ligand-dependent Notch signaling. Clone borders (dotted line) and genotypes (Dl Ser vs. wild-type, wt) are indicated. Scale bars are 10 μm (a: ad; e: eh)
Fig. 8
Fig. 8
The m7 and m8 genes contribute to SOP selection. a Dorsal thorax of an E(spl)m7-m8/Df(3)P11 fly, lacking the m7 and m8 genes and carrying one copy of the mγ-m5 genes. An increase in bristle density (+35%) was observed. The m7 and m8 genes are required for the proper spacing of SOPs within a stripe but are dispensable for stripe patterning. b, c The expression of the m5 gene (smiFISH probe, green) was significantly upregulated in proneural stripes 1,3 and 5, at 8 h apf, in E(spl)m7-m8 mutant pupae (c) relative to wild-type controls (b; ac probe, red). d, e Adult flies with clones of cells homozygous for the E(spl)32.2 deletion, i.e., lacking all E(spl)-C genes, show patches of tufted bristles (d), whereas clones of Df(3L)mδ-m6 mutant cells display increased bristle density (e). This indicates that the m7 and m8 genes are sufficient for the singling out of SOPs. Scale bar is 10 μm (b: b, c)
Fig. 9
Fig. 9
Models. ad Simulation of a mathematical model for patterning in the notum. Cells within a stripe eventually reach one of two stable states, representing the SOP (magenta) or epidermal (green) cell fate (a). Time courses of the cell state u, representing proneural activity (c), and of the inhibitory signal s (d), which antagonizes u, are color coded according to their position within the stripe, as shown in b: cells at the center of the stripe appear in purple, whereas lateral cells are in blue. At the end of the simulation, five SOPs (magenta) have emerged at the center of the stripe (c; see their positions in a, whereas the other cells adopt an epidermal fate (green). Note that lateral cells (blue) are excluded first (low u values in c). Also, while initial signal levels, which delimit the stripe, are highest on its sides, central cells (purple) rapidly show higher levels than their lateral counterparts (d). e, f Speculative models for the temporal regulation of the E(spl)-HLH genes. In the accessibility model (e), only the central region of the E(spl)-C is accessible for binding by CSL/NICD complexes prior to Ac and Sc expression (top; green line at 0–6 h apf; non-accessible region in red); expression of Ac and Sc renders additional binding sites accessible at 6–9 h apf (bottom). In the cooperativity model (f), NICD (green dots) can only bind the cis-regulatory sequences of early-onset genes which contain high-affinity CSL binding sites (top), whereas the low-affinity CSL binding sites of the late-onset genes can only be bound by NICD upon expression of Ac and Sc (red dots) through cooperative binding (bottom)

Similar articles

Cited by

References

    1. Green JB, Sharpe J. Positional information and reaction-diffusion: two big ideas in developmental biology combine. Development. 2015;142:1203–1211. doi: 10.1242/dev.114991. - DOI - PubMed
    1. Schweisguth F, Corson F. Self-organization in pattern formation. Dev. Cell. 2019;49:659–677. doi: 10.1016/j.devcel.2019.05.019. - DOI - PubMed
    1. Held LI. Imaginal Discs: the Genetic and Cellular Logic of Pattern Formation. New York: Cambridge University Press, Cambridge; 2002.
    1. Hartenstein V, Posakony JW. Development of adult sensilla on the wing and notum of Drosophila melanogaster. Development. 1989;107:389–405. - PubMed
    1. Gho M, Bellaiche Y, Schweisguth F. Revisiting the Drosophila microchaete lineage: a novel intrinsically asymmetric cell division generates a glial cell. Development. 1999;126:3573–3584. - PubMed

Publication types

LinkOut - more resources