. 2019 Aug 2;10(1):3469.
doi: 10.1038/s41467-019-11409-0.

Class IIa HDACs regulate learning and memory through dynamic experience-dependent repression of transcription

Affiliations

Class IIa HDACs regulate learning and memory through dynamic experience-dependent repression of transcription

Yongchuan Zhu et al. Nat Commun. .

Abstract

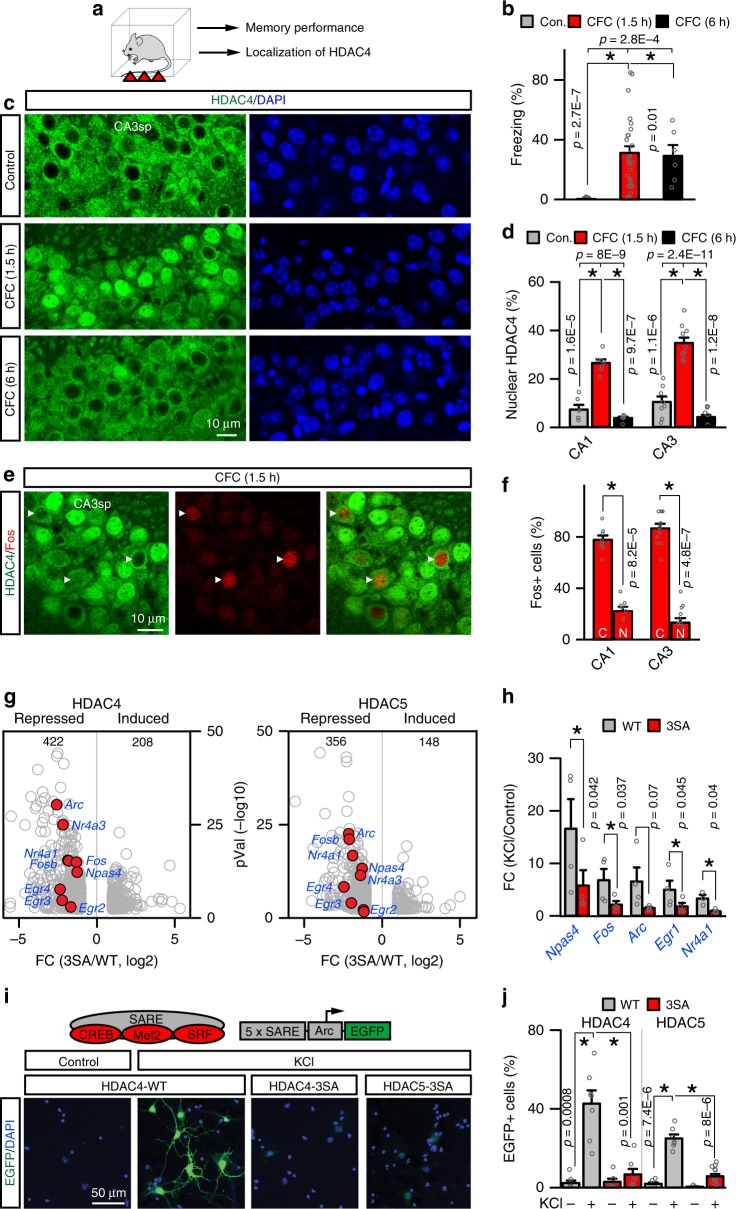
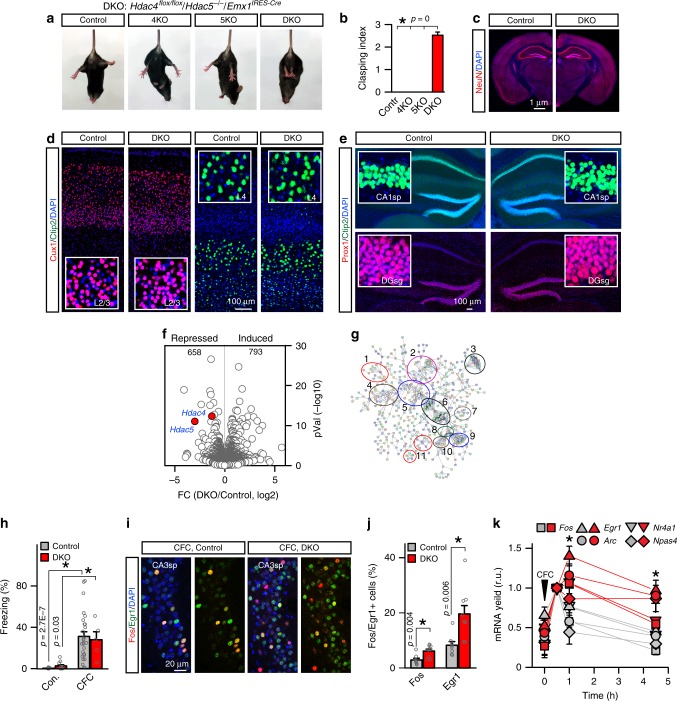
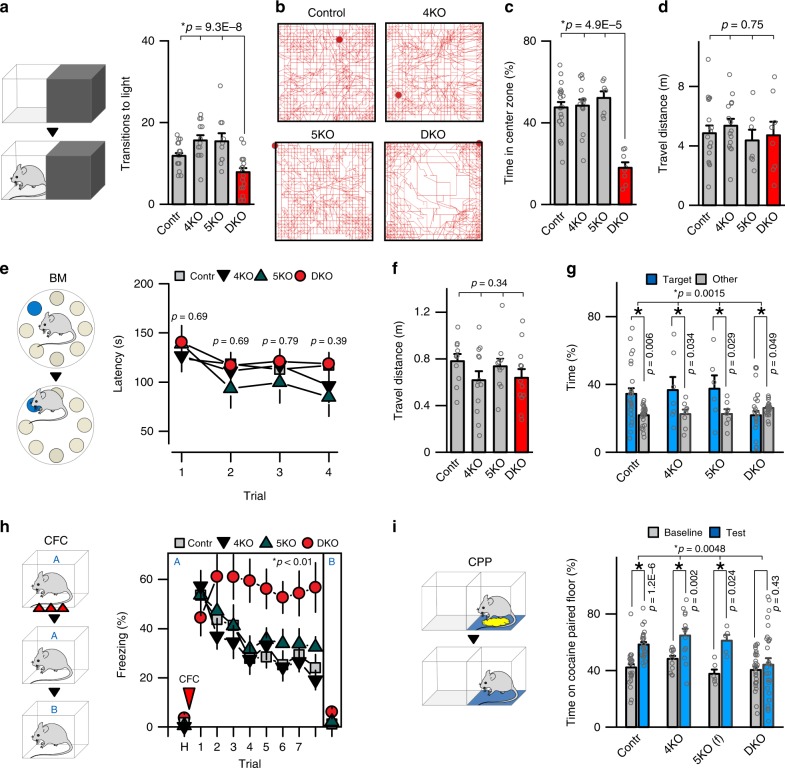
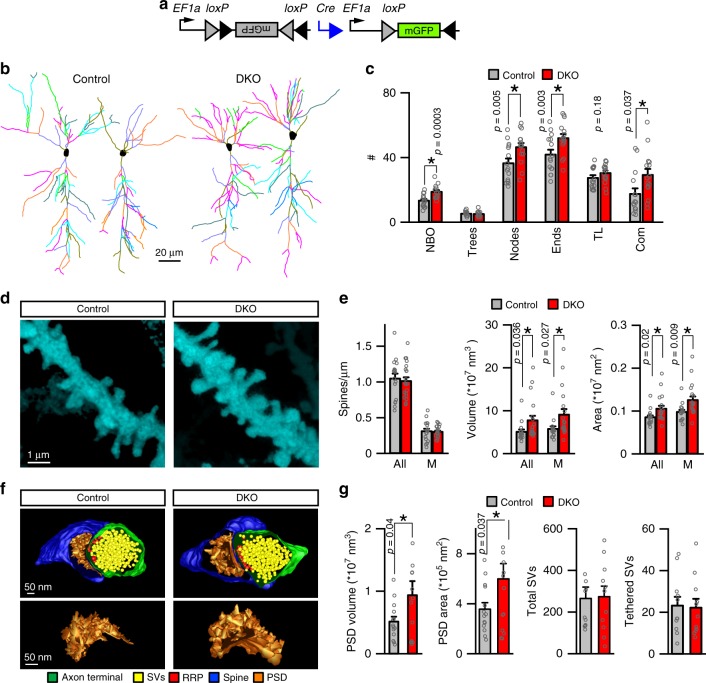
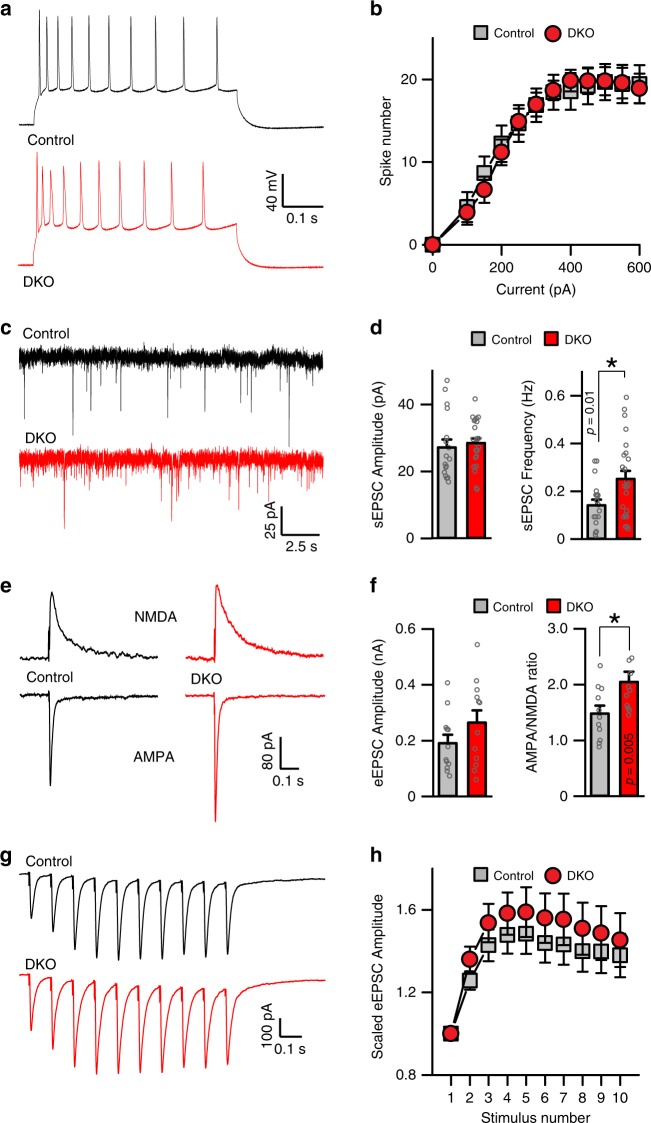
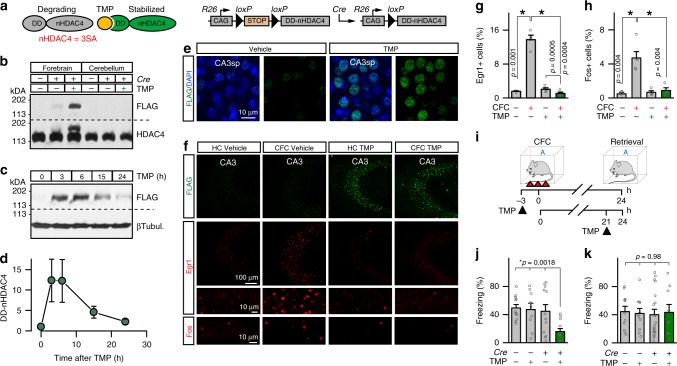
The formation of new memories requires transcription. However, the mechanisms that limit signaling of relevant gene programs in space and time for precision of information coding remain poorly understood. We found that, during learning, the cellular patterns of expression of early response genes (ERGs) are regulated by class IIa HDACs 4 and 5, transcriptional repressors that transiently enter neuronal nuclei from cytoplasm after sensory input. Mice lacking these repressors in the forebrain have abnormally broad experience-dependent expression of ERGs, altered synaptic architecture and function, elevated anxiety, and severely impaired memory. By acutely manipulating the nuclear activity of class IIa HDACs in behaving animals using a chemical-genetic technique, we further demonstrate that rapid induction of transcriptional programs is critical for memory acquisition but these programs may become dispensable when a stable memory is formed. These results provide new insights into the molecular basis of memory storage.


Conflict of interest statement

The authors declare no competing interests.

Figures

Fig. 1
Fig. 1
HDAC4 transiently enters neuronal nuclei during associative learning and represses ERGs. af Subcellular distribution of native HDAC4 in the hippocampus of wild-type p60 mice before and after contextual fear conditioning (CFC). a Experimental design. b Short-term memory performance was assessed by measuring freezing in the same context. Control, n = 11 mice; CFC (1.5 h), n = 27; CFC (6 h), n = 6. c Images of HDAC4 immunofluorescence in area CA3sp of DAPI-stained brain sections. See also Supplementary Fig. 1. d Averaged percentages of cells with nuclear HDAC4 in CA1sp and CA3sp. n = 4 mice/group (plotted data points are from individual sections). e Brain sections from fear-conditioned animals (1.5 h post CFC) were co-stained for HDAC4 and Fos. f Averaged fractions of Fos-positive cells with cytoplasmic (C) and nuclear (N) HDAC4 in indicated hippocampal subfields (1.5 h post CFC). n = 3 mice. gj Effects of recombinant class IIa HDACs on activity-dependent transcription in primary cortical cultures. Neurons were infected at 2 days in vitro (DIV2) with lentiviruses (LVs) that express wild-type HDAC4/5 cDNAs or constitutively nuclear 3SA mutants. g Transcripts were isolated at DIV7 after 30 min depolarization with KCl (50 mM) and surveyed by deep sequencing. Volcano plots of differentially expressed genes from two independent RNA-seq experiments are shown. Fold changes are represented as log2 of 3SA/WT ratio for each HDAC isoform. ERGs are marked in red. See also Supplementary Figs. 2, 3 and Data File 1. h Depolarization-induced expression of ERGs was assessed by quantitative real-time PCR. Averaged FC values from four independent experiments are plotted as KCl/Control ratio. i, j Indicated class IIa HDAC LVs were co-infected with the reporter of activity-dependent transcription, E-SARE:EGFP. i Schematic diagram of E-SARE:EGFP and confocal images of EGFP fluorescence in control and KCl-depolarized neurons at DIV7. See also Supplementary Fig. 4. j Summary graphs of reporter induction. n = 3 cultures/condition. All quantifications are represented as Mean ± SEM (error bars). *p < 0.05 (defined by ANOVA and/or t-test). Actual p-values are indicated in each graph (vertical for t-test and horizontal for ANOVA)
Fig. 2
Fig. 2
Characterization of HDAC4/5-deficient mice. a Photographs of p60 control, conditional Hdac4 knockout (KO, Hdac4flox/flox/Emx1IRES-Cre), constitutive Hdac5 KO (Hdac5−/−), and Hdac4/5 double knockout (DKO, Hdac4flox/flox/Hdac5−/−/Emx1IRES-Cre) mice subjected to tail suspension test. b Averaged leg clasping indexes. n = 20 mice/genotype. c Gross brain anatomies of p60 control and DKO mice. Coronal brain sections were stained with DAPI and the antibody to a pan-neuronal marker, NeuN. See also Supplementary Fig. 5. d, e, Sections were labeled with antibodies against layer/subtype-specific markers of excitatory neurons, Cux1, Ctip2, and Prox1. Images of the primary somatosensory cortex (d) and the hippocampus (e) are shown. Higher-magnification frames are displayed in inserts. f, g RNA-seq analysis of gene expression in the hippocampus at p60. Volcano plot (f) and the STRING network of differentially expressed transcripts (g) are shown (n = 3 mice/genotype). The following clusters are marked: (1) neurotransmitter receptors and calcium channels; (2) cytoskeleton and scaffolds; (3) protein turnover; (4) membrane trafficking; (5) calcium signaling; (6) G proteins and G protein-coupled receptors; (7) MAP kinases; (8) adenylate cyclases; (9) dopamine and hormone receptors; (10) phosphodiesterases. See also Supplementary Fig. 6 and Data Files 2 and 3. hk Expression of ERGs in the hippocampus during associative learning. h Analysis of short-term memory performance, assessed by measuring freezing in the same context 1.5 h post CFC. Control/Control, n = 11; Control/CFC, n = 27; DKO/Control, n = 11; DKO/CFC, n = 5. i Images of CA3sp of fear-conditioned control and DKO mice (1.5 h post CFC). Sections were labeled with DAPI and antibodies against Fos and Egr1. j Quantifications of Fos/Egr1-positive cells in CA3sp. n = 3 mice/genotype. k Transcripts were isolated from hippocampi at indicated time points after CFC and expression levels of various ERGs were measured by qPCR. Values from four to five mice per genotype/time point are normalized to 30 min post CFC to highlight the prolonged window of ERG expression in DKOs. *p < 0.05 (t-test). The color coding is the same as in j. All quantifications are represented as Mean ± SEM (error bars). *p < 0.05 (defined by ANOVA and/or t-test)
Fig. 3
Fig. 3
Behavior of class IIa HDAC-deficient mice. Animals of indicated genotypes were examined at p60. See also Supplementary Fig. 7 and Methods. a Analysis of anxiety-like behavior in the dark–light transfer test. Schematics of experimental setup and averaged transitions to light are shown. Control: n= 19 mice; 4KO: n = 13; 5KO: n = 10; DKO: n = 19. bd Locomotor activity in the open field setup. b Typical tracks during 30 min sessions. c Averaged times spent in the center zone. d Total travel distances. Control: n = 20; 4KO: n = 15; 5KO: n = 7; DKO: n = 8. eg Assessment of spatial memory in the Barnes maze. e Schematics of the maze and averaged latencies to escape through the tunnel in each of the four sequential daily training sessions. Control: n = 30; 4KO: n = 13; 5KO: n = 10; DKO: n = 30. f Total travel distances in the maze during training. g Memory retrieval in the probe test with escape tunnel removed. Graph shows averaged percentages of time spent in the correct (target) and other quadrants of the maze. Control: n = 30; 4KO: n = 12; 5KO: n = 11; DKO: n = 29. h Acquisition and extinction of associative fear memory. Mice were allowed to habituate (H) and then subjected to CFC in Context A. Freezing was measured on a daily basis in the same or irrelevant context (Context B). Control: n = 15; 4KO: n = 14; 5KO: n = 11; DKO: n = 11. i Conditional place preference (CPP) test. Graph shows averaged times spent on cocaine-paired floor. Control: n = 27; 4KO: n = 13; 5KO: n = 6§; DKO: n = 29. All quantifications are represented as Mean ± SEM. *p < 0.05 (defined by t-test and ANOVA). Actual p-values are indicated in each graph (vertical for t-test and horizontal for ANOVA). § No sex-related differences in behavior were observed with exception of HDAC5-deficient mice in the CPP test, where only females had preference for cocaine-paired floor
Fig. 4
Fig. 4
Morphologies of dendrites and synapses of HDAC4/5-deficient excitatory neurons. ae Pyramidal cells in the CA1 of DKO and control Emx1IRES-Cre mice were visualized by Cre-inducible expression of membrane-bound GFP from an adeno-associated virus (AAV DJ DIO-mGFP). Animals were injected with AAVs at p45 and analyzed by confocal imaging of brain sections at p60. a Schematic diagram of AAV recombination. b 3D reconstructions of dendritic trees of individual glutamatergic neurons. c Quantifications of branch orders (NBO), trees, nodes, ends, tree length (TL, μm × 100), and complexity indexes (Com, a.u. × 10,000). Averaged values are from 3 mice/15 neurons per genotype. d Pseudo-colored images of postsynaptic spines on proximal dendrites in CA1sr. e Linear densities, surface areas, and volumes of all and mushroom (M)-type spines. Control: n = 3 mice/17 neurons; DKO: n = 3/21. f, g EM tomography analysis of architectures of glutamatergic synapses in CA1sr. f Top panels: 3D reconstructions of spines, postsynaptic densities (PSDs), nerve terminals, and synaptic vesicles (SVs). Bottom panels: isolated 3D reconstructions of PSDs. g Average volumes and surface areas of PSDs, total SV pools, and numbers of vesicles tethered to active zones (RRP). Control: n = 3 mice/14 synapses; DKO: n = 3/14. All quantifications are represented as Mean ± SEM. *p < 0.05 (defined by t-test). Actual p-values are indicated in each graph
Fig. 5
Fig. 5
Physiological properties of HDAC4/5-deficient excitatory neurons. Intrinsic excitability and synaptic strength of CA1 pyramidal cells were assessed by electrophysiological whole-cell recordings from acute brain slices from p20 mice. a Sample traces of depolarization-induced action potentials monitored in current-clamp mode. b Averaged numbers of action potentials, plotted as a function of stimulus intensity. Control: n = 5 mice/18 neurons; DKO: n = 3/27. c Sample traces of spontaneous miniature excitatory postsynaptic currents (sEPSCs) recorded in voltage-clamp mode. Holding potentials were −70 mV. d Averaged sEPSC amplitudes and frequencies. Control: n = 5 mice/20 neurons; DKO: n = 5/26. e Traces of evoked AMPA (inward) and NMDA (outward) excitatory postsynaptic currents (eEPSCs) monitored at −70 and +40 mV holding potentials, respectively, in the presence of the GABA receptor blocker, Picrotoxin (50 μM). Synaptic responses were triggered by electrical stimulation of CA3 afferents in the Schaffer collateral path. f Averaged AMPA eEPSC amplitudes (left) and AMPA/NMDA ratios (right). Control: n = 3 mice/11 neurons; DKO: n = 3/11. g Sample traces of AMPA eEPSC elicited by repetitive stimulation at 10 Hz. h Averaged eEPSC amplitudes during 10 Hz trains, normalized to amplitudes of first responses. Control: n = 5 mice/22 neurons; DKO: n = 5/22. All quantifications are represented as Mean ± SEM. *p < 0.05 (t-test)
Fig. 6
Fig. 6
Acute chemical-genetic control of nuclear repression with destabilized HDAC4. a Schematics of stabilization of DD-nHDAC4 protein with TMP and Rosa26 allele for Cre-dependent expression of DD-nHDAC4 form the CAG promoter (R26floxStop-DD-nHDAC4). See also Supplementary Fig. 8a. bk DD-nHDAC4 was introduced into excitatory forebrain neurons by crossing R26floxStop-DD-nHDAC4 mice with Camk2αCre. TMP-lactate (300 μg/gm body weight) or control vehicle solutions were administered via intraperitoneal injections. b Brains were isolated at p60 3 h after drug delivery. Cortical and cerebellar protein extracts were probed by immunoblotting with antibodies against FLAG or HDAC4. c, d Time course of DD-nHDAC4 stabilization in the cortex. Immunoblot of samples isolated at different intervals after TMP injection (c) and quantifications of DD-nHDAC4 levels (d, r.u.) are shown. n = 3-4 mice/time point. e Images of DD-nHDAC4 immunofluorescence in CA3sp of vehicle and TMP-treated R26floxStop-DD-nHDAC4/Camk2αCre mice (3 h post injection). See also Supplementary Fig. 8b. fh Stabilized DD-nHDAC4 represses ERGs. R26floxStop-DD-nHDAC4/Camk2αCre mutants were given single doses of vehicle or TMP. Animals were maintained in home cages (HC) or subjected to CFC (3 h post-injection). After 1.5 h, brains were sectioned and labeled with antibodies against FLAG, Egr1, or Fos. Panels show images of the CA3 (f) and averaged densities of Erg1/Fos-positive cells in this area (g, h). See also Supplementary Fig. 8c. ik Effects of TMP-inducible nuclear repression on associative memory. p60 R26floxStop-DD-nHDAC4/Camk2αCre and Cre-negative R26floxStop-DD-nHDAC4 mice were treated with vehicle or TMP prior to CFC or prior to contextual memory retrieval, as depicted in i. j Freezing of animals that were given drugs 3 h before learning. Control + vehicle: n = 12; Control + TMP: n = 9; DD-nHDAC4 + vehicle: n = 12; DD-nHDAC4 + TMP: n = 12. k Freezing of animals that were given drugs 3 h before memory recall. Control + vehicle: n = 11; Control + TMP: n = 11; DD-nHDAC4 + vehicle: n = 19; DD-nHDAC4 + TMP: n = 9. All quantifications are represented as Mean ± SEM. *p < 0.05 (t-test and ANOVA). Actual p-values are indicated in each graph (vertical for t-test and horizontal for ANOVA)

Similar articles

Cited by

References

    1. West, A. E. & Greenberg, M. E. Neuronal activity-regulated gene transcription in synapse development and cognitive function. Cold Spring Harb. Perspect. Biol.3, a005744 (2011). - PMC - PubMed
    1. Kandel ER, Dudai Y, Mayford MR. The molecular and systems biology of memory. Cell. 2014;157:163–186. doi: 10.1016/j.cell.2014.03.001. - DOI - PubMed
    1. Reijmers LG, Perkins BL, Matsuo N, Mayford M. Localization of a stable neural correlate of associative memory. Science. 2007;317:1230–1233. doi: 10.1126/science.1143839. - DOI - PubMed
    1. Hrvatin S, et al. Single-cell analysis of experience-dependent transcriptomic states in the mouse visual cortex. Nat. Neurosci. 2018;21:120–129. doi: 10.1038/s41593-017-0029-5. - DOI - PMC - PubMed
    1. Tyssowski KM, et al. Different neuronal activity patterns induce different gene expression programs. Neuron. 2018;98:530–546 e511. doi: 10.1016/j.neuron.2018.04.001. - DOI - PMC - PubMed

Publication types