. 2019 Aug 2;9(1):11244.
doi: 10.1038/s41598-019-47745-w.

Short-term CFTR inhibition reduces islet area in C57BL/6 mice

Affiliations

Short-term CFTR inhibition reduces islet area in C57BL/6 mice

Dawood Khan et al. Sci Rep. .

Abstract

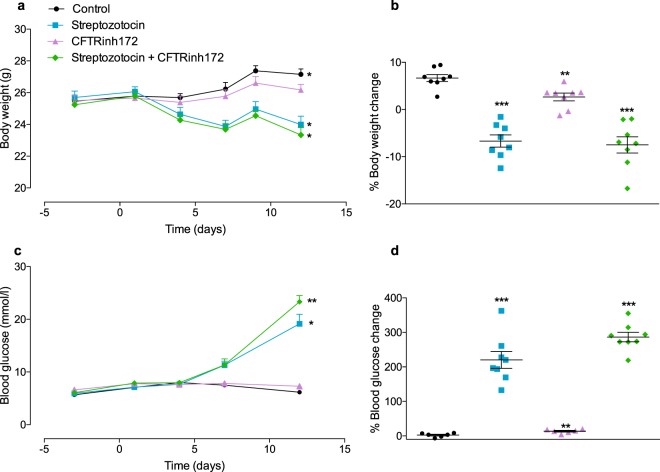
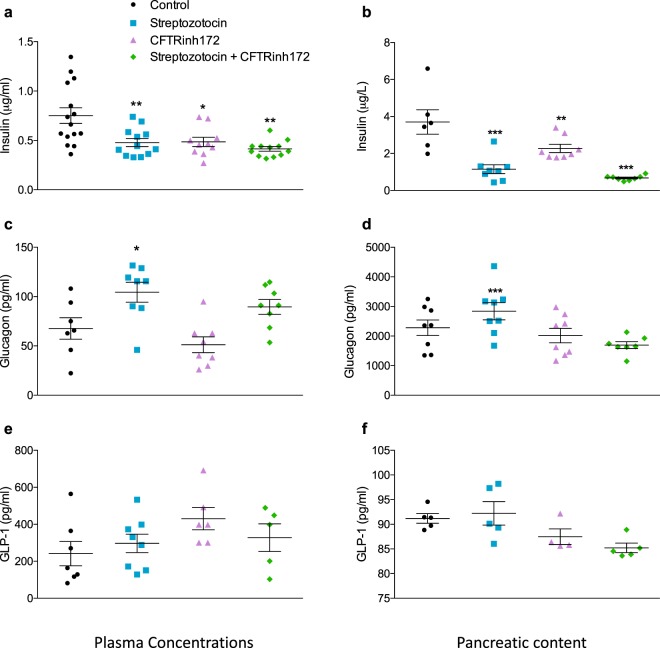
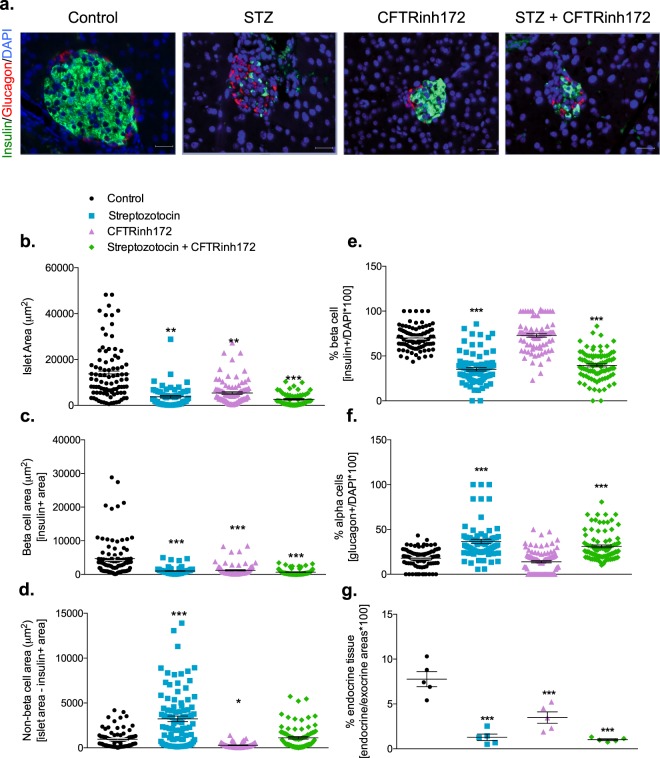
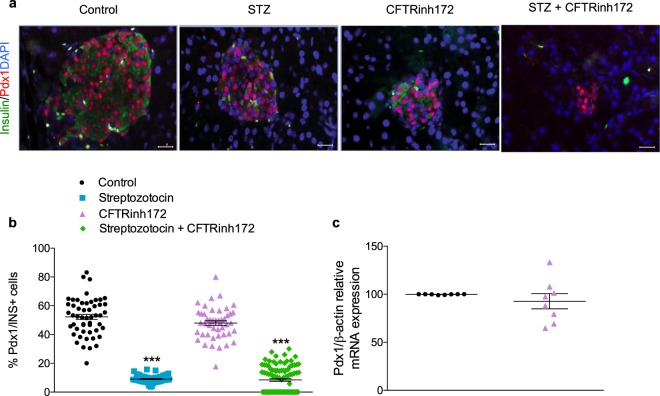
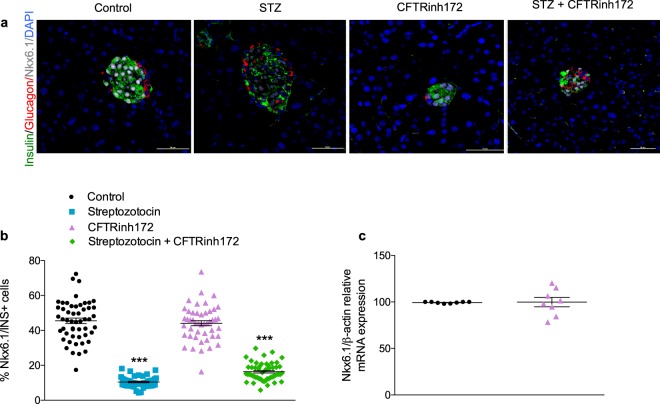
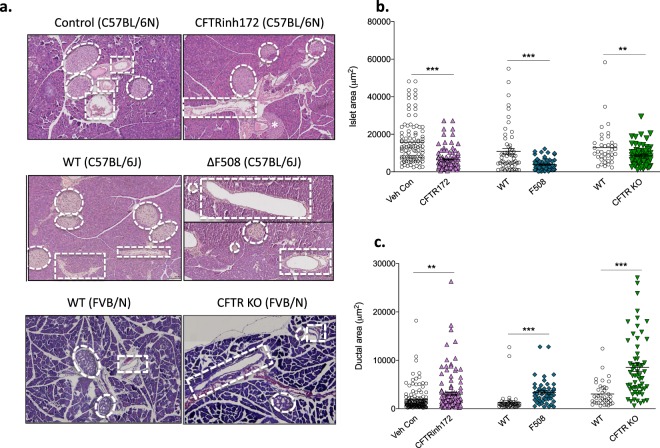
Cystic fibrosis-related diabetes (CFRD) worsens CF lung disease leading to early mortality. Loss of beta cell area, even without overt diabetes or pancreatitis is consistently observed. We investigated whether short-term CFTR inhibition was sufficient to impact islet morphology and function in otherwise healthy mice. CFTR was inhibited in C57BL/6 mice via 8-day intraperitoneal injection of CFTRinh172. Animals had a 7-day washout period before measures of hormone concentration or islet function were performed. Short-term CFTR inhibition increased blood glucose concentrations over the course of the study. However, glucose tolerance remained normal without insulin resistance. CFTR inhibition caused marked reductions in islet size and in beta cell and non-beta cell area within the islet, which resulted from loss of islet cell size rather than islet cell number. Significant reductions in plasma insulin concentrations and pancreatic insulin content were also observed in CFTR-inhibited animals. Temporary CFTR inhibition had little long-term impact on glucose-stimulated, or GLP-1 potentiated insulin secretion. CFTR inhibition has a rapid impact on islet area and insulin concentrations. However, islet cell number is maintained and insulin secretion is unaffected suggesting that early administration of therapies aimed at sustaining beta cell mass may be useful in slowing the onset of CFRD.


Conflict of interest statement

The authors declare no competing interests.

Figures

Figure 1
Figure 1
Body weight and blood glucose concentrations. Mice were treated with vehicle control, streptozotocin, CFTRinh172, or a combination of the two and (a) body weight over the duration of the study (Days -3, 1, 4, 7, 9 and 12), (b) percentage change in body weight from the beginning to the end of the study (Day -3 to Day 12), (c) blood glucose concentrations over the duration of the study (Days -3, 1, 4, 7 and 12), and (d) percentage change in blood glucose concentrations from the beginning to the end of the study (Day -3 to Day 12) were measured. Data are presented as mean ± SEM (n = 7–8 mice for all experiments). (a,c) *p < 0.05 compared with values at Day -3 (t test). (b,d) **p < 0.01, ***p < 0.001 compared to control animals (One-way ANOVA).
Figure 2
Figure 2
Glucose tolerance. Mice were treated with vehicle control, streptozotocin, CFTRinh172, or a combination of the two. Intraperitoneal glucose tolerance tests were undertaken on study Day 12 (a) Blood glucose concentrations and (c) plasma insulin concentrations were assessed immediately before and 15, 30, 60 and 90 minutes after intraperitoneal administration of glucose (18 mmol/kg body weight). Respective areas under the curve for (b) blood glucose and (d) plasma insulin AUCs are also shown. Data are presented as mean ± SEM (n = 5–7 mice for all experiments). ***p < 0.001 compared to control animals (One-way ANOVA).
Figure 3
Figure 3
Islet hormone concentrations. Peripheral plasma concentrations of (a) insulin (n = 10–15), (c) glucagon (n = 6–8), and (e) GLP-1 (n = 5–8) were assessed on Day 12 of the study. Additionally, the pancreatic content of (b) insulin (n = 6–8), (d) glucagon (n = 7–8), and (f) GLP-1 (n = 5) were assessed in protein extracted from pancreatic tissue. All observations were made in mice fasted for 2 hours. Data are presented as mean ± SEM for a given number of mice (n) as indicated above. *p < 0.05, **p < 0.01 and ***p < 0.001 compared to control animals (One-way ANOVA).
Figure 4
Figure 4
Islet size and composition. (a) Representative images of pancreatic islets from mice treated with vehicle control, streptozotocin, CFTRinh172, or a combination of the two and stained for insulin (green), glucagon (red), and the nuclear stain DAPI (blue). (b) Islet area (µm2), (c) beta cell area [insulin positive area] (µm2), (d) non-beta cell area [non-insulin positive area] (µm2), (e) beta cell number as a percentage of total islet cells [insulin positive cells/DAPI count] and (f) alpha cell number as a percentage of total islet cells [glucagon positive cells/DAPI count]. Data are presented as mean ± SEM (n = 5 mice) and calculated from two sections of tissue per animal taken at least 200 µm apart. A minimum of 100 islets were counted from a total of 5 animals (at least 20 islets per animal). Each data point on the graphs represents one islet. **p < 0.01 and ***p < 0.001 compared to controls animals (One-way ANOVA).
Figure 5
Figure 5
Pdx-1 expression. (a) Representative images of pancreatic islets from mice treated with vehicle control, streptozotocin, CFTRinh172, or a combination of the two and stained for insulin (green), Pdx-1 (red), and the nuclear stain DAPI (blue). (b) Number of Pdx-1 positive cells as a percentage of beta cells (insulin positive cells). Data are presented as mean ± SEM (n = 5 mice). A minimum of 50 islets were counted from a total of 5 animals (at least 10 islets per animal). Each data point on the graphs represents one islet. ***p < 0.001 compared to control animals (One-way ANOVA). (c) Relative PDX1 mRNA expression in the isolated islets of control animals and those treated with CFTRinh172 alone. Data are presented as mean ± SEM (n = 8).
Figure 6
Figure 6
Nkx6.1 expression. (a) Representative images of pancreatic islets from mice treated with vehicle control, streptozotocin, CFTRinh172, or a combination of the two and stained for insulin (green), glucagon (red), Nkx6.1 (grey), and the nuclear stain DAPI (blue). (b) Number of Nkx6.1 positive cells as a percentage of beta cells (insulin positive cells). Data are presented as mean ± SEM (n = 5 mice). A minimum of 50 islets were counted from a total of 5 animals (at least 10 islets per animal). Each data point on the graphs represents one islet. ***p < 0.001 compared to control animals (One-way ANOVA). (c) Relative NKX6-1 mRNA expression in the isolated islets of control and CFTR-inhibited mice. Data are presented as mean ± SEM (n = 8).
Figure 7
Figure 7
Glucose stimulated insulin secretion. Islets were isolated from animals treated with vehicle control or CFTRinh172 and exposed to 1.1 mM glucose, or 16.7 mM glucose ± 10 nM GLP-1 for 1 h. (a) Static insulin release was measured by ELISA with *p < 0.05, **p < 0.01 and ***p < 0.001 compared to either 1.1 mM or 16.7 mM glucose as indicated in the Figure (one-way ANOVA). (b) Data was adjusted for pancreatic insulin content under basal (1.1 mM) glucose conditions with ***p < 0.001 compared to corresponding control animals (t test). Data are presented as mean ± SEM (n = 8–10 for all experiments).
Figure 8
Figure 8
Pancreatic morphology. Representative H&E stained sections of the (a) pancreas of CFTRinh172-treated mice and vehicle controls (both n = 5), transgenic ΔF508 mice and wild-type controls (both n = 3), CFTR KO mice (n = 3) and wild-type controls (n = 2). Islets are denoted by dashed white circles with pancreatic ducts identified by dashed rectangles. (b) Islet area and (c) pancreatic ductal area have been quantified. Values represent mean ± SEM calculated from two sections of tissue per animal taken at least 200 µm apart. A minimum of 20 data points (at least 10 per section) were collected for each animal. Each data point on the graphs represents one islet/duct. **p < 0.01 and ***p < 0.001 compared to corresponding control/wild type animals (t test). Please note that the representative image of the pancreas shown for the ΔF508 mice is a composite. The complete image is presented in Fig. S6, ESM.

References

    1. Brennan A, Geddes D, Gyi K, Baker E. Clinical importance of cystic fibrosis-related diabetes. J. Cyst. Fibros. 2004;3:209–222. doi: 10.1016/j.jcf.2004.08.001. - DOI - PubMed
    1. Li C, Naren AP. Analysis of CFTR interactome in the macromolecular complexes. Methods Mol, Biol. 2011;741:255–270. doi: 10.1007/978-1-61779-117-8_17. - DOI - PMC - PubMed
    1. Blackman SM, et al. Genetic modifiers of cystic fibrosis-related diabetes. Diabetes. 2013;62:3627–3635. doi: 10.2337/db13-0510. - DOI - PMC - PubMed
    1. Moran A, et al. Cystic fibrosis-related diabetes: current trends in prevalence, incidence, and mortality. Diabetes Care. 2009;32:1626–1631. doi: 10.2337/dc09-0586. - DOI - PMC - PubMed
    1. Edlund A, Esguerra JL, Wendt A, Flodström-Tullberg M, Eliasson L. CFTR and anoctamin 1 (ANO1) contribute to cAMP amplified exocytosis and insulin secretion in human and murine pancreatic beta-cells. BMC Med. 2014;12:87. doi: 10.1186/1741-7015-12-87. - DOI - PMC - PubMed

Publication types

MeSH terms

Substances