. 2019 Aug 2;9(1):11286.
doi: 10.1038/s41598-019-47802-4.

A QSP Model for Predicting Clinical Responses to Monotherapy, Combination and Sequential Therapy Following CTLA-4, PD-1, and PD-L1 Checkpoint Blockade

Affiliations

A QSP Model for Predicting Clinical Responses to Monotherapy, Combination and Sequential Therapy Following CTLA-4, PD-1, and PD-L1 Checkpoint Blockade

Oleg Milberg et al. Sci Rep. .

Abstract

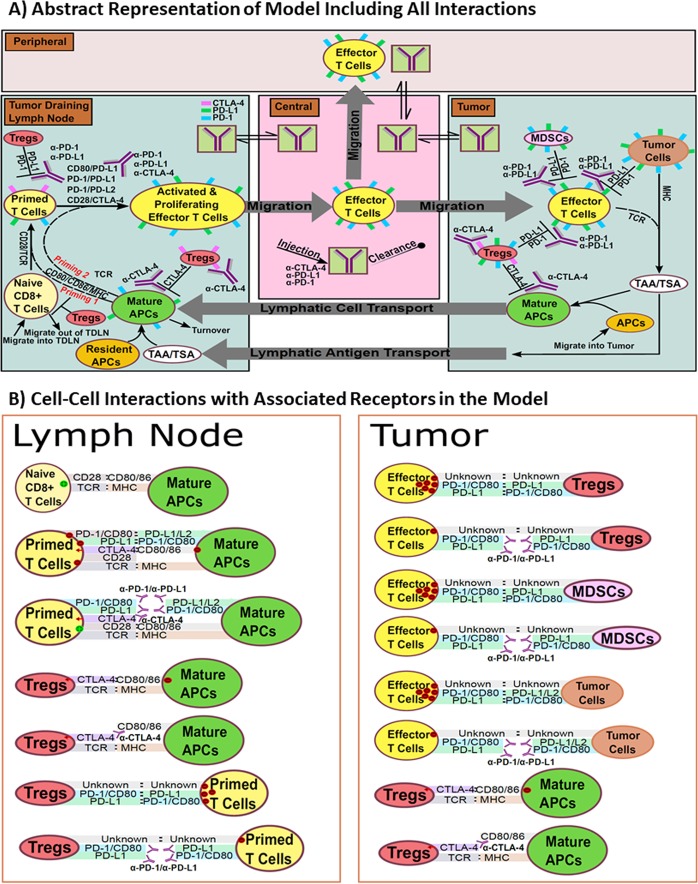
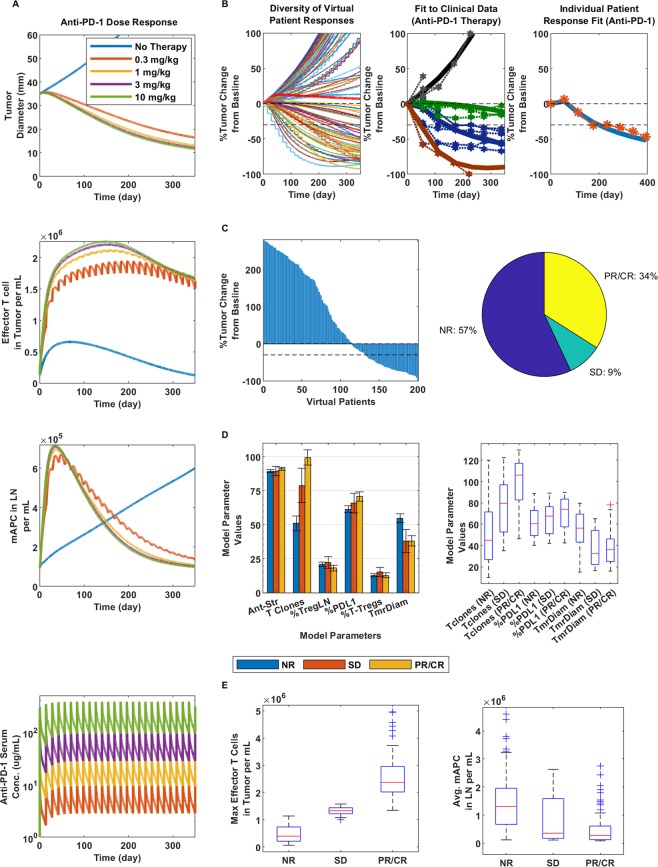
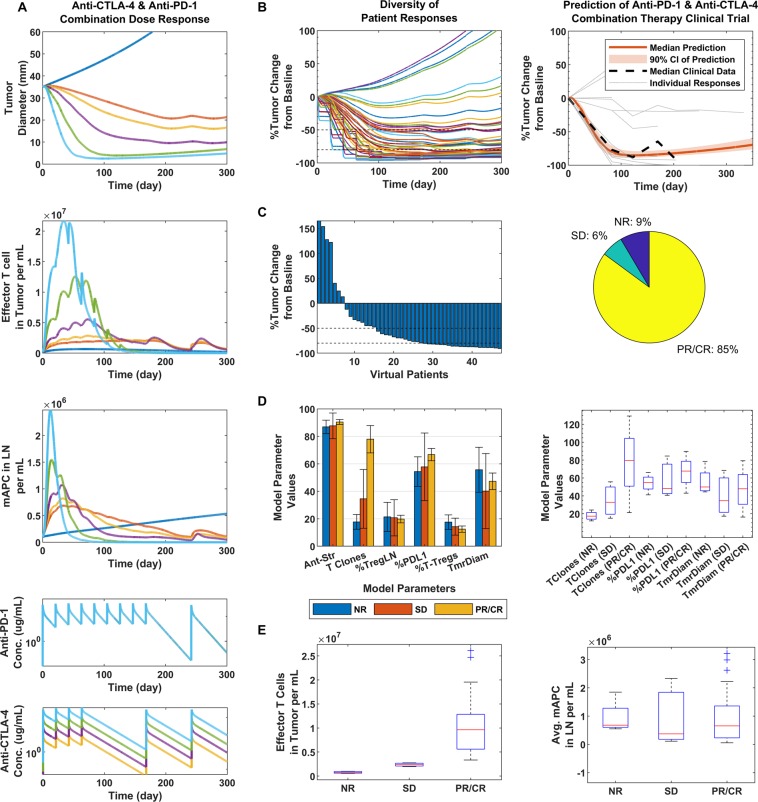
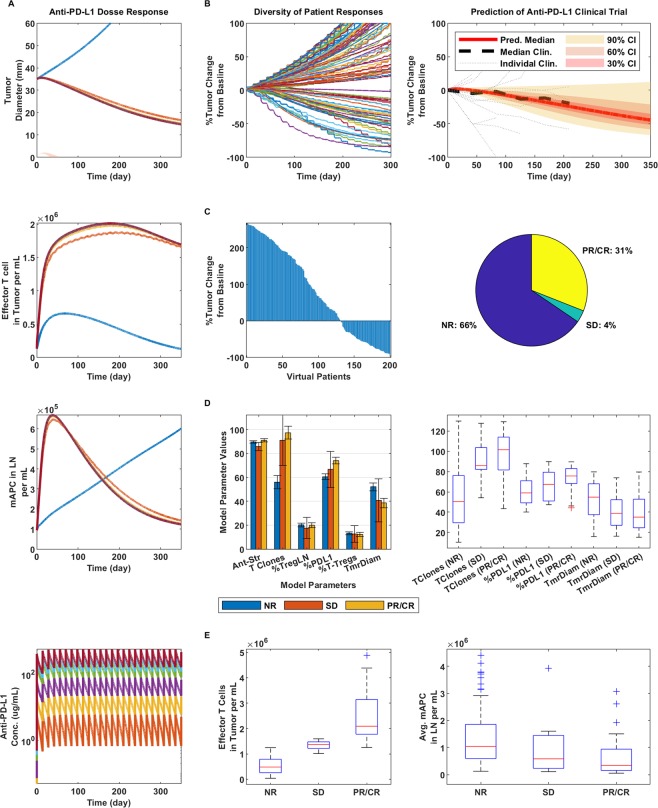
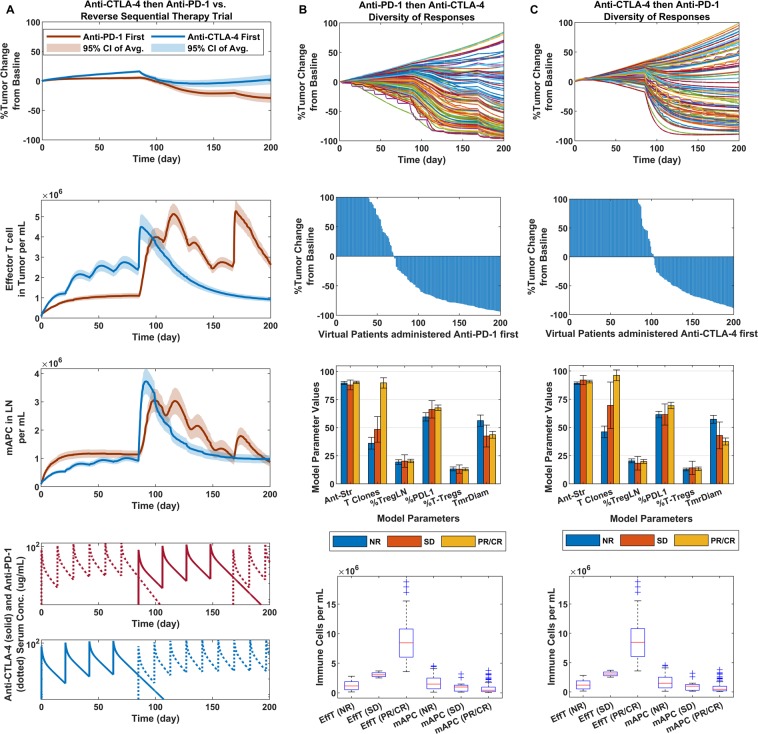
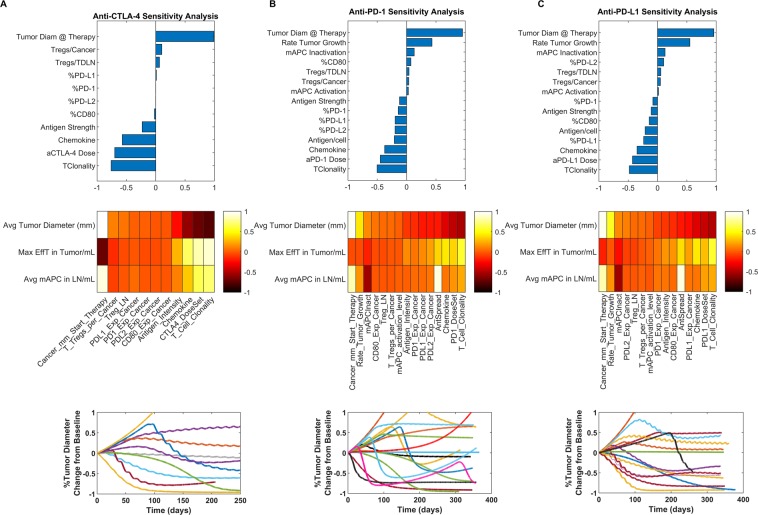
Over the past decade, several immunotherapies have been approved for the treatment of melanoma. The most prominent of these are the immune checkpoint inhibitors, which are antibodies that block the inhibitory effects on the immune system by checkpoint receptors, such as CTLA-4, PD-1 and PD-L1. Preclinically, blocking these receptors has led to increased activation and proliferation of effector cells following stimulation and antigen recognition, and subsequently, more effective elimination of cancer cells. Translation from preclinical to clinical outcomes in solid tumors has shown the existence of a wide diversity of individual patient responses, linked to several patient-specific parameters. We developed a quantitative systems pharmacology (QSP) model that looks at the mentioned checkpoint blockade therapies administered as mono-, combo- and sequential therapies, to show how different combinations of specific patient parameters defined within physiological ranges distinguish different types of virtual patient responders to these therapies for melanoma. Further validation by fitting and subsequent simulations of virtual clinical trials mimicking actual patient trials demonstrated that the model can capture a wide variety of tumor dynamics that are observed in the clinic and can predict median clinical responses. Our aim here is to present a QSP model for combination immunotherapy specific to melanoma.


Conflict of interest statement

The authors declare no competing interests.

Figures

Figure 1
Figure 1
Diagram of model. (A) Compartments, and their associated cellular-molecular interactions and distributions are shown. The entire model represents the system of a single VP for each model run given a set of parameters. (B) All checkpoint and associated antibody interactions linked to each cell type in the model.
Figure 2
Figure 2
Dose response and clinical validation of anti-PD-1 monotherapy. (A) From top to bottom: Tumor response to anti-PD-1 therapy at doses of 0.3, 1, 3 and 10 mg/kg as represented by the colors in the bottom figure in ascending order; the blue line indicates no therapy (top figure). Then, effector T cell density in the tumor (second from the top), mAPC density in the lymph nodes (third from the top) and finally, the PK of anti-PD-1 at the given doses. For all following figures, 3 mg/kg anti-PD-1 was used, following the same regimen. (B) Diversity of tumor response (left), fitting to pooled means patient response data (center) and individual patient fit (right); all at 3 mg/kg anti-PD-1. (C) Waterfall plot of VPs (left) and pie chart (right) with percent of virtual non-responders (NR), stable disease (SD) and partial or complete responders (PR/CR). (D) Bar graph comparison of parameters varied in model for each responder type (left) and box plots of significant differentiators (right). (E) Max effector T cell density in the tumor (left) and average mAPC density in the lymph nodes (right) for each responder category.
Figure 3
Figure 3
Dose response and clinical validation of anti-PD-1/anti-CTLA-4 combination-therapy. (A) From top to bottom: Tumor response to combination therapy at doses of 0.3, 1, 3 and 10 mg/kg of anti-CTLA-4, as represented by the colors in the bottom figure in ascending order and 3 mg/kg for anti-PD-1 was used for all simulations; the blue line indicates no therapy (top figure), and orange indicates only anti-PD-1. Then, effector T cell density in the tumor (second from the top), mAPC density in the lymph nodes (third from the top) and finally, the PK of anti-PD-1 and lastly, anti-CTLA-4 at the given doses. For all following figures, 1 mg/kg anti-PD-1 and 3 mg/kg anti-CTLA-4 were used, following the same regimen. (B) Diversity of tumor response (left), prediction of median clinical response data (right). (C) Waterfall plot of VPs (left) and pie chart (right) with percent of virtual non-responders (NR), stable disease (SD) and partial or complete responders (PR/CR). (D) Bar graph comparison parameters varied in model for each responder type (left) and box plots of significant differentiators (right). (E) Max effector T cell density in the tumor (left) and average mAPC density in the lymph nodes (right) for each responder category.
Figure 4
Figure 4
Dose response and clinical validation of anti-PD-L1 monotherapy. (A) From top to bottom: Tumor response to anti-PD-L1 therapy at doses of 0.3, 1, 3, 10, 15 and 20 mg/kg as represented by the colors in the bottom figure in ascending order; the blue line indicates no therapy (top figure). Then, effector T cell density in the tumor (second from the top), mAPC density in the lymph nodes (third from the top) and finally, the PK of anti-PD-L1 at the given doses. For all following figures, 20 mg/kg anti-PD-L1 was used, following the same regimen. (B) Diversity of tumor response (left), prediction of median clinical response data (right). (C) Waterfall plot of VPs (left) and pie chart (right) with percent of virtual non-responders (NR), stable disease (SD) and partial or complete responders (PR/CR). (D) Bar graph comparison parameters varied in model for each responder type (left) and box plots of significant differentiators (right). (E) Max effector T cell density in the tumor (left) and average mAPC density in the lymph nodes (right) for each responder category.
Figure 5
Figure 5
Sequential therapy of anti-PD-1 and anti-CTLA-4. (A) From top to bottom: Tumor response to sequential therapy with dosing as listed in phase II CheckMate 064 trial (NCT01783938) with regimens shown in bottom two figures. Following response (top), effector T cell density in the tumor (second from the top), mAPC density in the lymph nodes (third from the top) and finally, the PK of anti-PD-1 first regimen and lastly, anti-CTLA-4 first regimen. (B) Anti-PD-1 therapy first: Comparison of variability in responses (top), waterfall plots of responders in virtual trial (second from top), Bar graph comparison parameters varied in model for each responder type (third from top), and boxplots of Max effector T cell density in the tumor and average mAPC density in the lymph nodes (bottom) for each responder category: virtual non-responders (NR), stable disease (SD) and partial or complete responders (CR/PR). (C) Same as (B), except for anti-CTLA-4 therapy administered first.
Figure 6
Figure 6
Sensitivity analysis showing (A) anti-CTL-4, (B) anti-PD-1, and (C) anti-PD-L1 sensitivities relative to average tumor diameter (top row); in heatmap form to average tumor diameter, max effector T cell density in tumor and average mAPC density in the lymph nodes (second row); and representations of diversity in types of responses with variation in sensitivity analysis parameters, respectively for each column.

References

    1. McCarthy EF. The toxins of William B. Coley and the treatment of bone and soft-tissue sarcomas. Iowa Orthop J. 2006;26:154–8. - PMC - PubMed
    1. Topalian SL, Weiner GJ, Pardoll DM. Cancer immunotherapy comes of age. J Clin Oncol. 2011;29(36):4828–36. - PMC - PubMed
    1. Schreiber RD, Old LJ, Smyth MJ. Cancer immunoediting: integrating immunity’s roles in cancer suppression and promotion. Science. 2011;331(6024):1565–70. - PubMed
    1. Kim R, Emi M, Tanabe K. Cancer immunoediting from immune surveillance to immune escape. Immunology. 2007;121(1):1–14. - PMC - PubMed
    1. Martincorena I, Campbell PJ. Somatic mutation in cancer and normal cells. Science. 2015;349(6255):1483–9. - PubMed

Publication types

MeSH terms