. 2019 Aug 2;9(1):11239.
doi: 10.1038/s41598-019-47519-4.

Keratin 17 identifies the most lethal molecular subtype of pancreatic cancer

Affiliations

Keratin 17 identifies the most lethal molecular subtype of pancreatic cancer

Lucia Roa-Peña et al. Sci Rep. .

Abstract

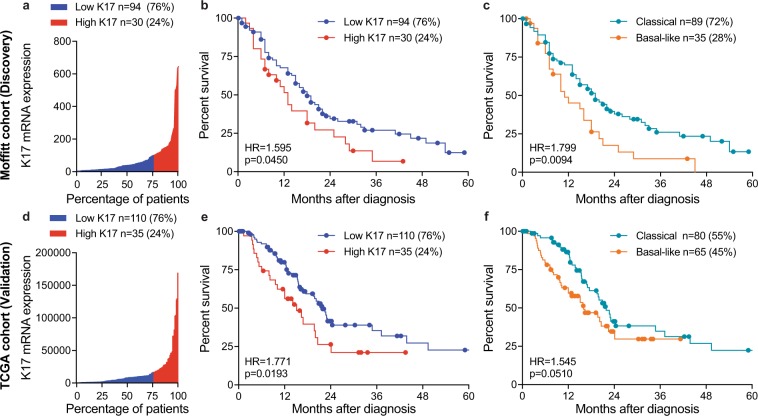
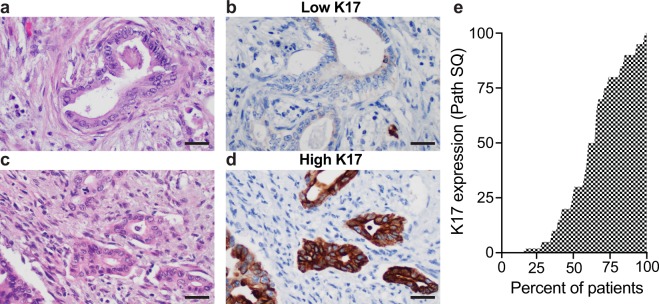
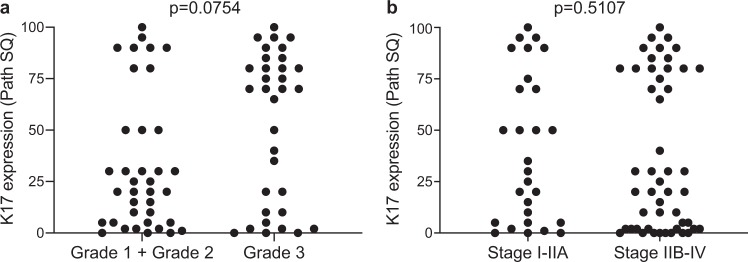
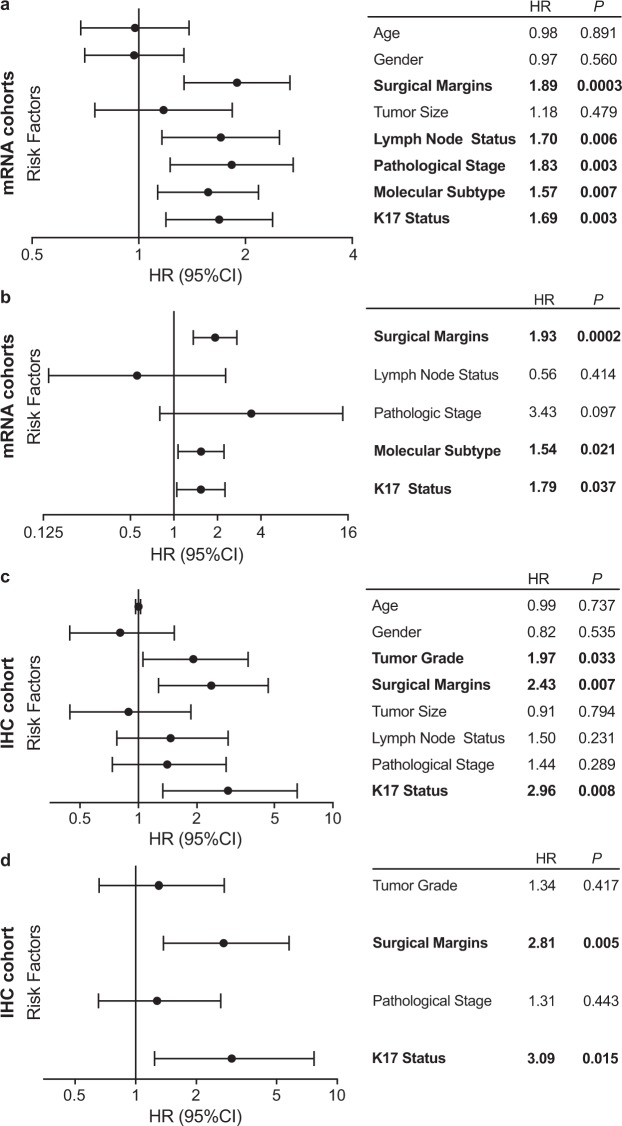
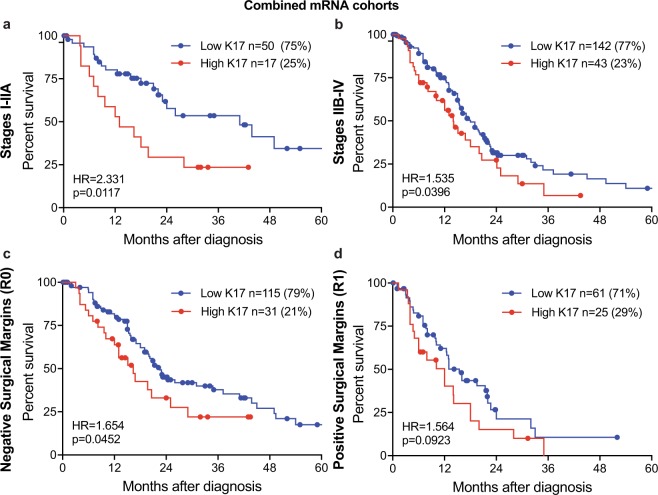
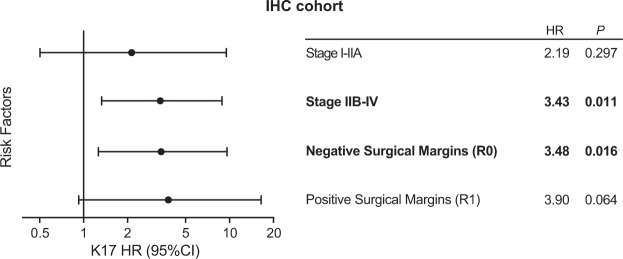
Although the overall five-year survival of patients with pancreatic ductal adenocarcinoma (PDAC) is dismal, there are survival differences between cases with clinically and pathologically indistinguishable characteristics, suggesting that there are uncharacterized properties that drive tumor progression. Recent mRNA sequencing studies reported gene-expression signatures that define PDAC molecular subtypes that correlate with differences in survival. We previously identified Keratin 17 (K17) as a negative prognostic biomarker in other cancer types. Here, we set out to determine if K17 is as accurate as molecular subtyping of PDAC to identify patients with the shortest survival. K17 mRNA was analyzed in two independent PDAC cohorts for discovery (n = 124) and validation (n = 145). Immunohistochemical localization and scoring of K17 immunohistochemistry (IHC) was performed in a third independent cohort (n = 74). Kaplan-Meier and Cox proportional-hazard regression models were analyzed to determine cancer specific survival differences in low vs. high mRNA K17 expressing cases. We established that K17 expression in PDACs defines the most aggressive form of the disease. By using Cox proportional hazard ratio, we found that increased expression of K17 at the IHC level is also associated with decreased survival of PDAC patients. Additionally, within PDACs of advanced stage and negative surgical margins, K17 at both mRNA and IHC level is sufficient to identify the subgroup with the shortest survival. These results identify K17 as a novel negative prognostic biomarker that could inform patient management decisions.


Conflict of interest statement

L.F. Escobar-Hoyos and K.R. Shroyer are consultants for KDx Diagnostics Inc. and OncoGenesis Inc.

Figures

Figure 1
Figure 1
K17 mRNA is as accurate as molecular subtyping to predict prognosis of PDAC. (a) Water plot depicts K17 mRNA expression levels in Moffitt et al. cohort. 76th percentile defined the cut-off to predict outcome by maximum likelihood fit of a Cox proportional hazard model, 76% of PDAC cases were found to be low K17 (blue) while 24% of cases were classified as high K17 (red). K17 mRNA ranged from 3.559 to 645.377 absolute fluorescence reads. (b) Kaplan-Meier curve depicting the overall survival for K17 of resected PDAC primary tumors from Moffitt et al. cohort. Cox proportional model was used for analysis. Hazard ratios (HR) and p-values are shown. (c) Kaplan-Meier curve of overall survival analysis for mRNA molecular subtypes of resected PDAC primary tumors from Moffitt et al. cohort. For analysis, Cox proportional model was used. Hazard ratios (HR) and p-values are shown. (d) Water plot depicts K17 mRNA expression levels in The Cancer Genome Atlas (TCGA) cohort. 76th percentile defined the best cut-off to predict outcome by the maximum likelihood fit of a Cox proportional hazard model, 76% of PDAC cases where found to be low-K17 (blue) while 24% of cases were classified as high-K17 (red). K17 mRNA ranged from 75.39 to 170,437.66 RSEM reads. (e) Kaplan-Meier curve depicting the overall survival for K17 of resected PDAC primary tumors from TCGA cohort. Cox proportional model was used for analysis. Hazard ratios (HR) and p-values are shown. (f) Kaplan-Meier curve of overall survival analysis for mRNA molecular subtypes of resected PDAC primary tumors from TCGA cohort. Cox proportional model was used for analysis. Hazard ratios (HR) and p-values are shown.
Figure 2
Figure 2
K17 immunohistochemistry in PDAC cases. (ad) Representative images from two PDAC cases with similar histologic grade and immunohistochemical stains. Hematoxylin and eosin stained sections (a,c) and corresponding sections processed for K17 IHC (b,d). Note similar histologic features of low versus high-K17 expression. Scale bar = 20 μm. (e) Water plot depicts K17 IHC score levels in the IHC cohort.
Figure 3
Figure 3
K17 IHC expression is independent of the histologic grade and tumor stage. (a) Graph illustrating K17 IHC expression for each case within the same grade category (grade 1 + grade 2 vs grade 3). Path SQ score ranges from 0 to 100% in both categories. P-value was calculated using the Mann Whitney test. (b) Graph showing expression of K17 IHC for each case within the same tumor stage category (stage I-IIA vs stage IIB-IV). Path SQ score ranges from 0 to 100% in both categories. P-value was calculated using the Mann Whitney test.
Figure 4
Figure 4
K17 is an independent negative prognostic biomarker, at both the mRNA and IHC (protein) levels. (a) Forest plot showing the univariate analysis using Cox proportional hazards regression for K17 mRNA as a binary variable and other PDAC risk factors from combined mRNA cohorts (Moffitt et al. and The Cancer Genome Atlas [TCGA]). Surgical margin status, lymph node status, pathologic stage, molecular subtype and K17 status were all negative prognostic markers with significant p-values. (b) Forest plot showing the multivariate analysis from K17 mRNA as a binary variable and other risk factors, from combined mRNA cohorts. Surgical margins, molecular subtype and K17 showed significant p-values. (c) Forest plot showing the univariate analysis using Cox proportional hazards regression for K17 as a continuous variable and other PDAC risk factors from the IHC cohort. Tumor grade, surgical margins and K17 showed significant p-values. (d) Forest plot showing the multivariate analysis from K17 as a continuous variable and other risk factors, from IHC cohort. K17 and surgical margins show significant p-values.
Figure 5
Figure 5
K17 predicts survival based on stage and surgical margins at the mRNA level. (a–d) Kaplan–Meier curves depicting the overall survival of the combined mRNA cohorts (Moffitt et al. and The Cancer Genome Atlas [TCGA]) integrating K17 status and tumor stage (a: stage I-IIA, b: stage IIB-IV) and surgical margins (c: negative margins, d: positive margins). P-values were calculated using the log-rank test. Hazard ratios (HR) and p-values are shown.
Figure 6
Figure 6
K17 provides additional prognostic value in advance stage and negative margin status groups at the protein level. Forest plot showing interaction of K17 IHC status and tumor stage and surgical margins. Hazard ratios (HR) and p-values are shown. Each HR is computed in subsets of the data.

References

    1. Paniccia A, et al. Characteristics of 10-Year Survivors of Pancreatic Ductal Adenocarcinoma. JAMA Surg. 2015;150:701–710. doi: 10.1001/jamasurg.2015.0668. - DOI - PubMed
    1. Kamarajah SK, Burns WR, Frankel TL, Cho CS, Nathan H. Validation of the American Joint Commission on Cancer (AJCC) 8th Edition Staging System for Patients with Pancreatic Adenocarcinoma: A Surveillance, Epidemiology and End Results (SEER) Analysis. Ann Surg Oncol. 2017;24:2023–2030. doi: 10.1245/s10434-017-5810-x. - DOI - PubMed
    1. Brennan MF, Kattan MW, Klimstra D, Conlon K. Prognostic nomogram for patients undergoing resection for adenocarcinoma of the pancreas. Ann Surg. 2004;240:293–298. doi: 10.1097/01.sla.0000133125.85489.07. - DOI - PMC - PubMed
    1. Witkiewicz AK, et al. Whole-exome sequencing of pancreatic cancer defines genetic diversity and therapeutic targets. Nat Commun. 2015;6:6744. doi: 10.1038/ncomms7744. - DOI - PMC - PubMed
    1. Biankin AV, et al. Pancreatic cancer genomes reveal aberrations in axon guidance pathway genes. Nature. 2012;491:399–405. doi: 10.1038/nature11547. - DOI - PMC - PubMed

Publication types

MeSH terms