. 2019 Aug;37(8):925-936.
doi: 10.1038/s41587-019-0206-z. Epub 2019 Aug 2.

Massively parallel single-cell chromatin landscapes of human immune cell development and intratumoral T cell exhaustion

Affiliations

Massively parallel single-cell chromatin landscapes of human immune cell development and intratumoral T cell exhaustion

Ansuman T Satpathy et al. Nat Biotechnol. 2019 Aug.

Abstract

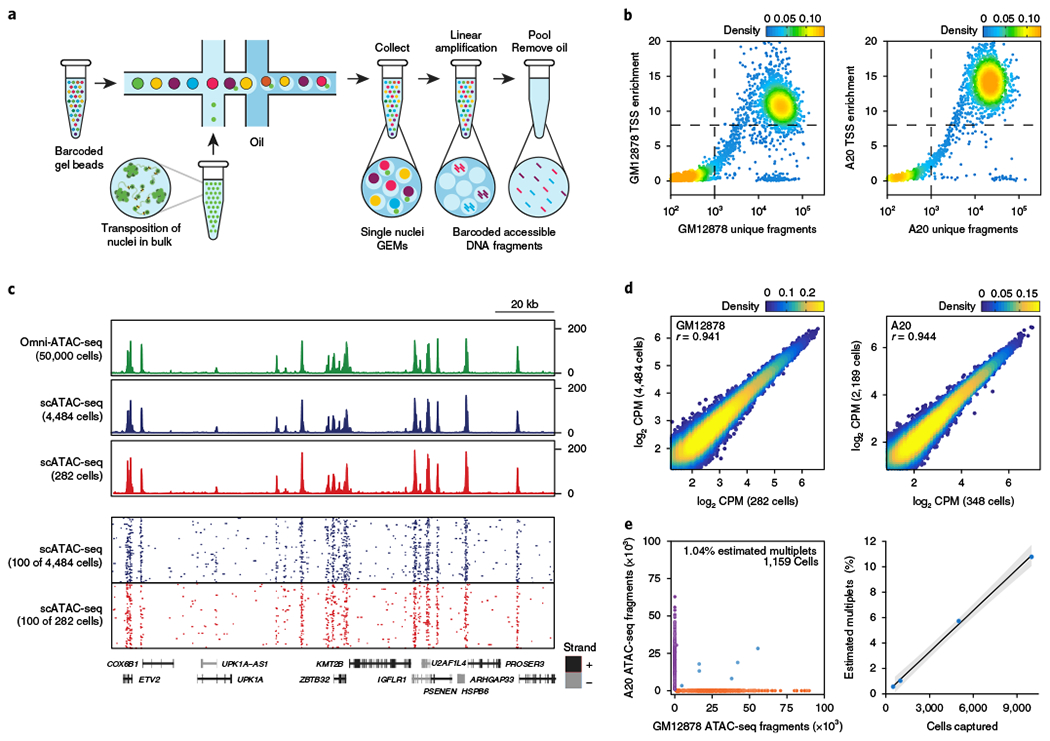
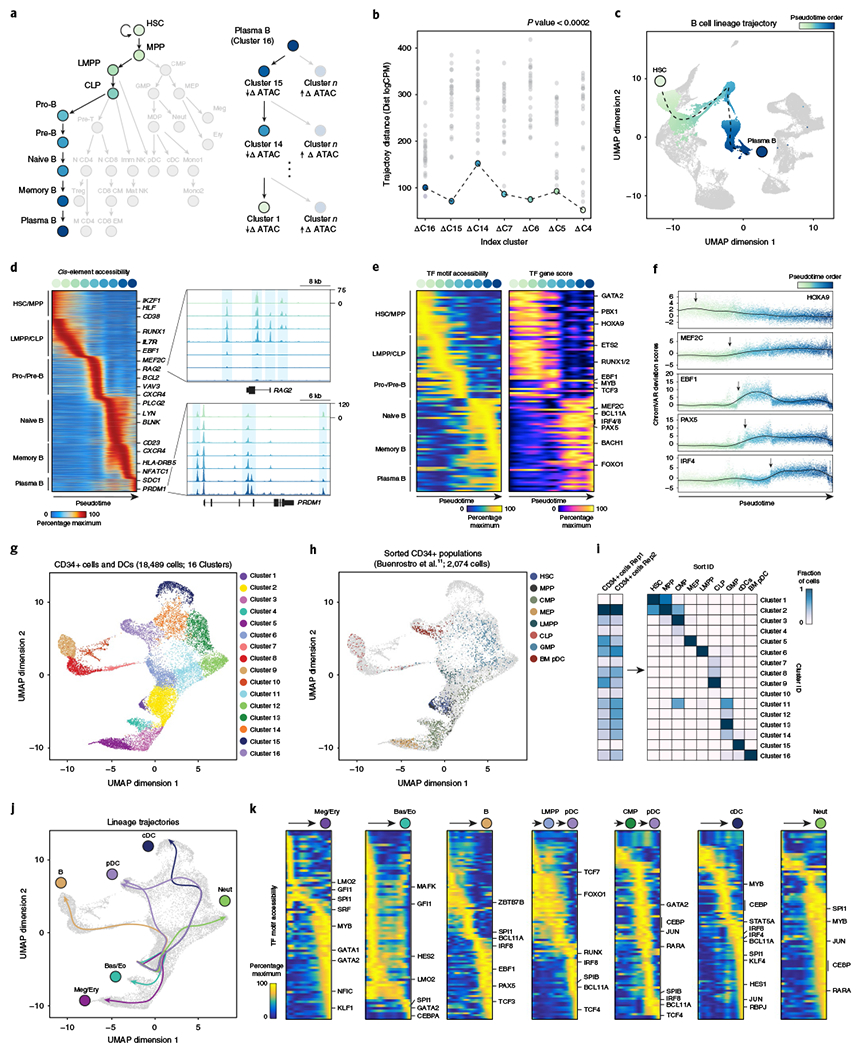
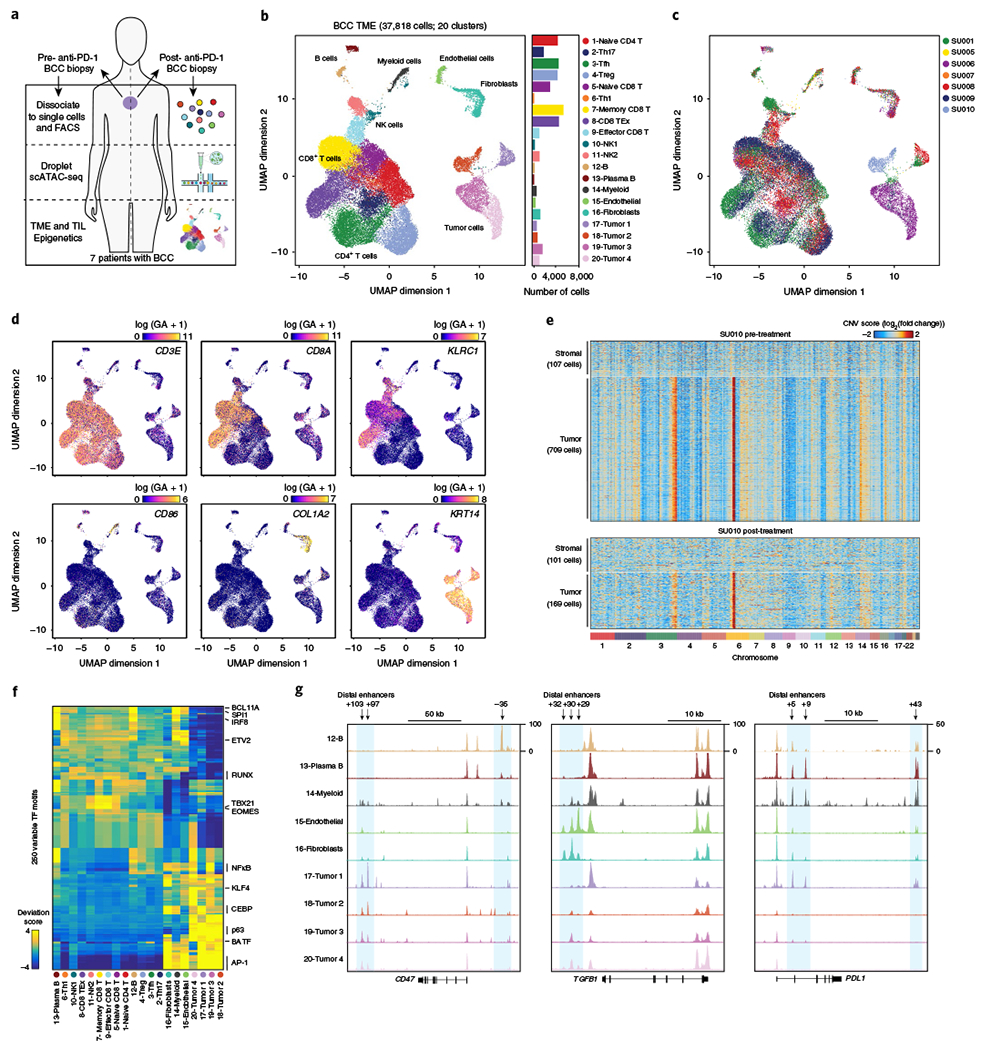
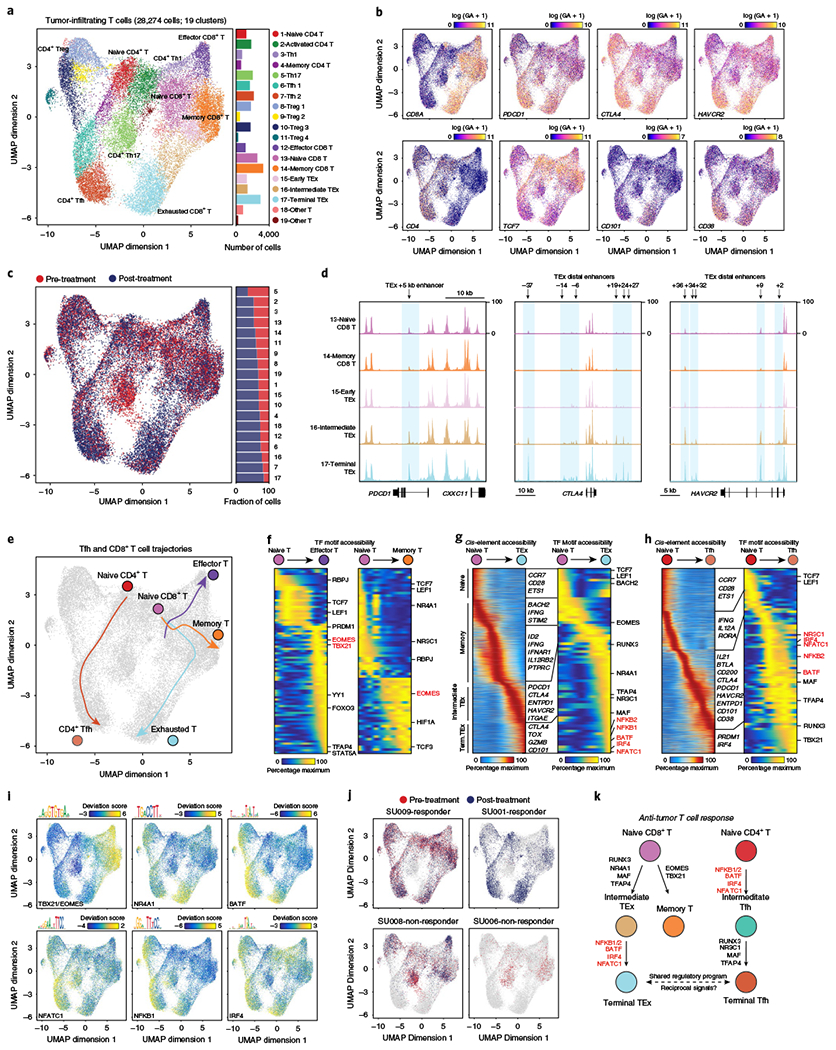
Understanding complex tissues requires single-cell deconstruction of gene regulation with precision and scale. Here, we assess the performance of a massively parallel droplet-based method for mapping transposase-accessible chromatin in single cells using sequencing (scATAC-seq). We apply scATAC-seq to obtain chromatin profiles of more than 200,000 single cells in human blood and basal cell carcinoma. In blood, application of scATAC-seq enables marker-free identification of cell type-specific cis- and trans-regulatory elements, mapping of disease-associated enhancer activity and reconstruction of trajectories of cellular differentiation. In basal cell carcinoma, application of scATAC-seq reveals regulatory networks in malignant, stromal and immune cells in the tumor microenvironment. Analysis of scATAC-seq profiles from serial tumor biopsies before and after programmed cell death protein 1 blockade identifies chromatin regulators of therapy-responsive T cell subsets and reveals a shared regulatory program that governs intratumoral CD8+ T cell exhaustion and CD4+ T follicular helper cell development. We anticipate that scATAC-seq will enable the unbiased discovery of gene regulatory factors across diverse biological systems.


Conflict of interest statement

Competing interests

H.Y.C. is a cofounder of Accent Therapeutics and Epinomics and is an adviser to 10x Genomics and Spring Discovery. W.J.G. is a cofounder of Epinomics and an adviser to 10x Genomics, Guardant Health and Centrillion. A.T.S. is an advisor to Immunai. F.M., G.P.M., B.N.O., P.S., J.C.B., D.J., C.M.N., J.W., L.W., Y.Y., P.G.G. and G.Y.Z. are employees of 10x Genomics. A.L.S.C. was an advisory board member and clinical investigator for studies sponsored by Merck, Regeneron, Novartis, Galderma and Genentech Roche. Stanford University holds patents on ATAC-seq, on which P.G., W.J.G. and H.Y.C. are named as inventors.

Figures

Fig. 1 |
Fig. 1 |. Massively parallel scATAC-seq in droplets.
a, Schematic of scATAC-seq in droplets. b, ATAC-seq data quality control filters in human (GM12878) and mouse (A20) B cells at 5,000 cell loading. Shown are the number of unique ATAC-seq nuclear fragments in each single cell (each dot) compared with TSS enrichment of all fragments in that cell. Dashed lines represent the filters for high-quality single-cell data (1,000 unique nuclear fragments and TSS score greater than or equal to 8). Density is given in arbitrary units. Data are representative of four independent experiments. c, Genome tracks showing the comparison of aggregate scATAC-seq profiles with bulk Omni-ATAC-seq profiles from GM12878 B lymphoblasts (top panel). scATAC-seq profiles were obtained from 2 independent mixing experiments, in which either 4,484 (from 10,000 cell loading) or 282 (from 500 cell loading) cells were assayed, as indicated. The bottom panel shows accessibility profiles of 100 random single GM12878 cells from each experiment. Each pixel represents a 100-bp region. d, One-to-one plots of log-normalized reads in ATAC-seq peaks in aggregate scATAC-seq profiles (n = 100,000 ATAC-seq peaks, Pearson correlation). Aggregate profiles in GM12878 (left) and A20 (right) cells are derived from two individual mixing experiments as in b, in which the indicated numbers of cells were assayed. ATAC-seq peaks were identified in Omni-ATAC-seq profiles from 50,000 cells. e, Human (GM12878)/mouse (A20) cell mixing experiment showing proportion of single-cell libraries with both mouse and human ATAC-seq fragments (left). The right panel shows proportion of mouse/human multiplets detected when cell-loading concentration was varied (n = 4 biologically independent experiments). The center line indicates linear fit, and shaded lines indicate 95% confidence interval.
Fig. 2 |
Fig. 2 |. Single-cell chromatin accessibility of human hematopoiesis.
a, Schematic of progenitor and end-stage cell types in human hematopoiesis. MPP, multipotent progenitor; LMPP, lymphoid-primed multipotent progenitor; CLP, common lymphoid progenitor; MEP, megakaryocyte-erythroid progenitor; BMP, basophil-mast cell progenitor; N CD4, naïve CD4 T cell; N CD8, naïve CD8 T cell; M CD4, memory CD4 T cell; CD8 CM, CD8 central memory T cell; CD8 EM, CD8 effector memory T cell; Imm NK, immature natural killer cell; Mat NK, mature natural killer cell; Neut, neutrophil; Meg, megakaryocyte; Ery, erythrocyte; Eos, eosinophil; Baso, basophil. Lightly shaded cells were not sampled in the current study. b, UMAP projection of 63,882 scATAC-seq profiles of bone marrow and peripheral blood immune cell types. Dots represent individual cells, and colors indicate cluster identity (labeled on the right). Bar plot indicates the number of scATAC-seq profiles in each cluster of cells. Cells include those generated in this study (61,806) and cells from a previous study (2,076). c, Heatmap of Z-scores of 116,713 cis-regulatory elements in scATAC-seq clusters derived from b. Gene labels indicate the nearest gene to each regulatory element. d, Single-cell chromatin accessibility in the IRF8 locus. Each box shows scATAC-seq profiles from 100 representative single cells from each cluster. Each pixel represents a 200-bp region. The top genome track shows the aggregate accessibility profile from all cells combined. e, UMAP projection colored by log-normalized gene scores demonstrating the accessibility of cis-regulatory elements linked (computed from linked accessibility of distal peaks to peaks at gene promoters using Cicero) to the indicated gene. Gene scores are calculated as log2(GA*1000000 + 1), which we refer to as log2(GA + 1). For example, the top left plot demonstrates the accessibility score for cis-elements linked to the promoter of the hematopoietic progenitor gene CD34. f, Example TF footprints of GATA2 and EBF1 with motifs in the indicated scATAC-seq clusters. The Tn5 insertion bias track is shown below. g, Heatmap representation of ATAC-seq chromVAR bias-corrected deviations in the 250 most variable TFs across all scATAC-seq clusters. Single-cell cluster identities are indicated at the top of the plot. h, UMAP projection of scATAC-seq profiles colored by chromVAR TF motif bias-corrected deviations for the indicated factors.
Fig. 3 |
Fig. 3 |. Epigenomic differentiation trajectories of human immune cell types.
a, Differentiation trajectory of HSCs to terminal plasma B cells (left). Reverse reconstruction of B cell differentiation trajectory using scATAC-seq profiles (right; see Methods). Differences between the aggregate plasma B cell scATAC-seq profile and all other clusters are calculated. Trajectory is tested against a nearest-neighbor approach; the cluster with the most similarity (lowest trajectory distance) to the cluster of interest is identified as the immediate precursor cluster. b, Trajectory distance calculations for the terminal plasma B cell cluster (cluster 16). Dots represent comparisons between the cluster of interest (labeled at the bottom) and every cluster not previously identified. P < 0.0002 calculated as one-sided empirical P value from 5,000 random simulations of trajectory ordering. c, Pseudotime representation of plasma B cell differentiation from HSCs. The dashed line represents a double-spline fitted trajectory across pseudotime. d, Pseudotime heatmap ordering of the top 10,000 variable cis-regulatory elements across B cell differentiation (left). Zoom-in genome tracks show representation of behavior of cis-elements accessible early (top) and late in B cell differentiation (bottom). e, Pseudotime heatmap ordering of chromVAR TF motif bias-corrected deviations across B cell differentiation (left). TF motifs are filtered for genes that are highly active (defined as the average percentile between total gene score and variability) that also demonstrate similarly dynamic gene scores across differentiation (R > 0.35 and FDR < 0.001 across 1,000 incremental groups). Heatmap of TF gene scores is shown on the right. f, chromVAR bias-corrected deviation scores for the indicated TFs across B cell pseudotime. Each dot represents the deviation score in an individual pseudotime-ordered scATAC-seq profile. The line represents the smoothed fit across pseudotime and chromVAR deviation scores. g, Subclustering UMAP projection of 18,489 CD34+ bone marrow progenitors and DCs (cells within clusters 1–6 and 8–11 from full hematopoiesis). scATAC-seq profiles are colored by cluster identity, as labeled on the right. h, UMAP projection of progenitor populations; highlighted are the sorted progenitor populations from Buenrostro et al.. Grayed out are the cells assayed in this study. CMPs (green dots) were sorted as lineageCD34+CD38+CD10CD45RACD123mid, and GMPs (light blue dots) were sorted as lineageCD34+CD38+CD10CD45RA+CD123mid. i, Confusion matrix of sorted progenitor populations showing the proportion of each population in clusters defined in g. j, Lineage trajectories for the indicated cell types, calculated as described in a. Lines represent double-spline fitted trajectories across pseudotime. k, Pseudotime heatmap ordering of chromVAR TF motif bias-corrected deviations in the indicated lineage trajectory. TF motifs are filtered for genes as described in e.
Fig. 4 |
Fig. 4 |. Single-cell regulatory landscape of the BCC TME.
a, Schematic of analysis of BCC samples. b, UMAP projection of 37,818 scATAC-seq profiles of BCC TME cell types. Dots represent individual cells, and colors indicate cluster identity (labeled on the right). Bar plot indicates the number of cells in each cluster of cells. T cell clusters showed high CD3E, CD8A and CD4 gene scores; NK cell clusters: high KLRC1 and NCR1 gene scores; B cells and plasma cells: high CD19 and SDC1 gene scores, respectively; myeloid cells: high CD86, CSF1R and FLT3 gene scores; stromal endothelial cells and fibroblasts: high CD31 and COL1A2 gene scores, respectively; and tumor cell clusters: high KRT14 gene score. c, UMAP projection colored by patient of origin, as indicated on the right. d, UMAP projection colored by log-normalized gene scores demonstrating the accessibility of cis-regulatory elements linked (using Cicero) to the indicated gene. e, Estimated copy-number variation (log2(fold change) to GC-matched background) from scATAC-seq data. Stromal cells include endothelial cells and fibroblasts. f, Heatmap representation of ATAC-seq chromVAR bias-corrected deviations in the 250 most variable TFs across all scATAC-seq clusters. Cluster identities are indicated at the bottom of the plot. g, Genome tracks of aggregate scATAC-seq data, clustered as indicated in b. Arrows indicate the position and distance (in kb) of distal enhancers in each gene locus.
Fig. 5 |
Fig. 5 |. Epigenomic regulators of T cell exhaustion after PD-1 blockade.
a, Subclustering UMAP projection of 28,274 tumor-infiltrating T cells (clusters 1–9 from TME UMAP). scATAC-seq profiles are colored by cluster identity, as labeled on the right. For CD8+ T cells, naïve T cells showed high CCR7 and TCF7 gene scores; effector T cells: high EOMES and IFNG gene scores; memory T cells: high EOMES gene score, but low effector gene scores; and exhausted T cells: high gene scores for inhibitory receptors PDCD1, CTLA4 and HAVCR2, and T cell dysfunction genes, CD101 and CD38. For CD4+ T cells, Tregs showed high FOXP3 and CTLA4 gene scores; Th1 cells: high IFNG and TBX21 gene scores; Th17 cells: high IL17A and CTSH gene scores; and Tfh cells: high CXCR5, IL21 and BTLA gene scores. Bar plot indicates the number of cells in each cluster of cells. b, UMAP projection colored by log-normalized gene scores demonstrating the accessibility of cis-regulatory elements linked (using Cicero) to the indicated gene. c, UMAP projection of tumor-infiltrating T cells colored by pre- and post-PD-1 blockade samples. d, Genome tracks of aggregate scATAC-seq data, clustered as indicated in a. Arrows indicate the position and distance (in kb) of intragenic or distal enhancers in each gene locus. e, Lineage trajectories of Tfh and CD8+ T cell states. Lines represent double-spline fitted trajectories across pseudotime. f, Pseudotime heatmap ordering of chromVAR TF motif bias-corrected deviations in effector and memory CD8+ T lineage trajectory. TF motifs are filtered for genes that are highly active (defined as the average percentile between total TF activity and variability > 0.75) that also demonstrate similarly dynamic gene scores across differentiation (R > 0.35 and FDR < 0.001 across 1,000 incremental groups). Heatmap of TF gene scores is shown on the right. g, Pseudotime heatmap ordering of cis-regulatory elements (left) and chromVAR TF motif bias-corrected deviations (right) in the CD8+ TEx lineage trajectory. h, Pseudotime heatmap ordering of cis-regulatory elements (left) and chromVAR TF motif bias-corrected deviations (right) in the CD4+ Tfh lineage trajectory. i, UMAP projection of scATAC-seq profiles colored by chromVAR TF motif bias-corrected deviations for the indicated factors. j, UMAP projection of tumor-infiltrating T cells colored by pre- and post-PD-1 in representative individual responder and nonresponder patients. k, Schematic of regulatory modules controlling TEx and Tfh differentiation.

References

    1. Roadmap Epigenomics Consortium. Integrative analysis of 111 reference human epigenomes. Nature 518, 317–330 (2015). - PMC - PubMed
    1. Buenrostro JD, Giresi PG, Zaba LC, Chang HY & Greenleaf WJ Transposition of native chromatin for fast and sensitive epigenomic profiling of open chromatin, DNA-binding proteins and nucleosome position. Nat. Methods 10, 1213–1218 (2013). - PMC - PubMed
    1. Schep AN et al. Structured nucleosome fingerprints enable high-resolution mapping of chromatin architecture within regulatory regions. Genome Res. 25, 1757–1770 (2015). - PMC - PubMed
    1. Schep AN, Wu B, Buenrostro JD & Greenleaf WJ chromVAR: inferring transcription-factor-associated accessibility from single-cell epigenomic data. Nat. Methods 14, 975–978 (2017). - PMC - PubMed
    1. Corces MR et al. An improved ATAC-seq protocol reduces background and enables interrogation of frozen tissues. Nat. Methods 14, 959–962 (2017). - PMC - PubMed

Publication types