Review
. 2019 Oct 5:715:144005.
doi: 10.1016/j.gene.2019.144005. Epub 2019 Jul 31.

Structure, regulation, and (patho-)physiological functions of the stress-induced protein kinase CK1 delta (CSNK1D)

Affiliations
Review

Structure, regulation, and (patho-)physiological functions of the stress-induced protein kinase CK1 delta (CSNK1D)

Pengfei Xu et al. Gene. .

Abstract

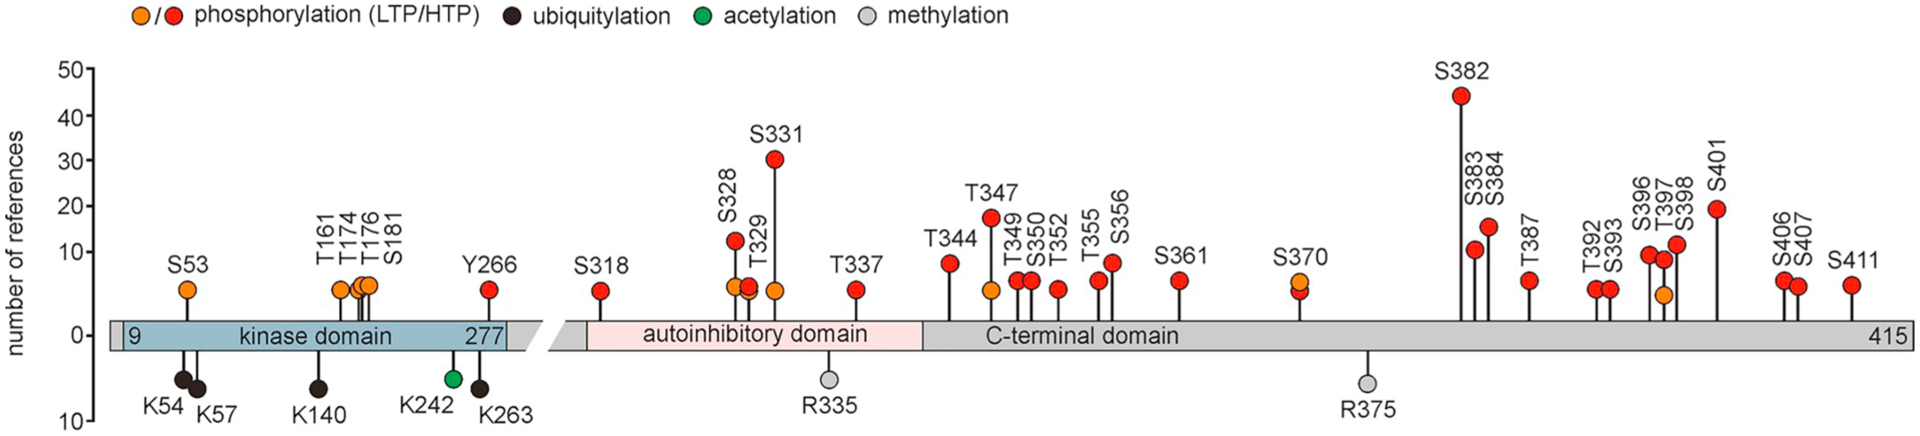
Members of the highly conserved pleiotropic CK1 family of serine/threonine-specific kinases are tightly regulated in the cell and play crucial regulatory roles in multiple cellular processes from protozoa to human. Since their dysregulation as well as mutations within their coding regions contribute to the development of various different pathologies, including cancer and neurodegenerative diseases, they have become interesting new drug targets within the last decade. However, to develop optimized CK1 isoform-specific therapeutics in personalized therapy concepts, a detailed knowledge of the regulation and functions of the different CK1 isoforms, their various splice variants and orthologs is mandatory. In this review we will focus on the stress-induced CK1 isoform delta (CK1δ), thereby addressing its regulation, physiological functions, the consequences of its deregulation for the development and progression of diseases, and its potential as therapeutic drug target.

Keywords: CSNK1D; Cancer; Casein kinase 1; Hedgehog pathway; N; P; Phosphorylation; R; S; Site-specific phosphorylation; Small molecule inhibitor; Stress-induced kinase; Wnt signaling pathway; p53.


Figures

Fig. 1.
Fig. 1.
Comparison of the amino acid sequences of three different CK1δ sequences in human, rat, and mouse. The alignment presented in (A) is followed by a display of the conserved regions, the quality, the consensus sequence as well as the occupancy of the alignment. The conservation as well as the quality is displayed with a color code ranging from yellow (highly conserved, good quality) to brown (poorly conserved, poor quality) (B). Alignments presented in panels A and B are shown starting from amino acid 372. The sequences are also displayed in a phylogenetic tree, indicating the relationship between the various CK1δ variants. The alignments as well as the phylogenic tree were generated using the alignment information from the Clustal Omega algorithm (Madeira et al., 2019) (C). TV, transcription variant.
Fig. 2.
Fig. 2.
Exon structure of the three transcription variants of CK1δ in humans. The stop codon position of each variant is marked with the asterisk. The information of TV1, TV2, and TV3 can be found using the data bank NCBI (GI: 13097702, 16041786, and 1393428169). Bp, base pairs; TV transcription variant.
Fig. 3.
Fig. 3.
Predicted RNA folding structure of the polyadenylation motif and the flanking regions of TV1 and TV2 on exon 10 (A) as well as TV3 on exon 11 (B). The minimum free energy values for TV1/TV2 and TV3 are −28.70 kcal/mol and −16.03 kcal/mol, respectively. This might indicate that TV1 and TV2 are less polyadenylated compared to TV3 based on the observation that stable secondary structures decrease the polyadenylation of the specific site (Klasens et al., 1998).
Fig. 4.
Fig. 4.
Three-dimensional structure of human CK1δ. Representation of the three-dimensional structure of human CK1δ. The structure of the N-lobe mainly consists of β-sheet strands while the larger C-terminal lobe is mainly composed by α-helices and loop structures. Structural elements are labeled according to Xu et al. (1995). Domains and residues of functional importance are labeled accordingly. Within loop L-89 the DFG motif is located with its aspartate residue being crucial for kinase activity and enzymatic function. Identification of a tungstate binding domain, indicated by W1, led to the identification of a recognition motif for the binding of phosphorylated substrates. The position of the catalytic loop (L-67) is marked with the asterisk (Xu et al., 1995; Longenecker et al., 1996). The figure was created by using CK1δ crystallization data deposited in the protein data bank (PDB) with ID 6GZM (Minzel et al., 2018).
Fig. 5.
Fig. 5.
Detailed representation of secondary structure, functional domains, and functional amino acid residues in the kinase domain of human CK1δ. Localization of structural elements building the CK1δ kinase domain is shown for α-helices, β-sheets, turns, and loop-structures. Nomenclature of elements is indicated as first published by Xu et al. (1995). Structures not described in the initial publication are shown in grey. Domains of functional importance are marked with red boxes while amino acid residues involved in ATP binding or substrate recognition are marked with yellow or green background, respectively. Because human CK1δ TV1, 2, and 3 are fully conserved in the N-terminal domain and the kinase domain, the depicted protein sequence is representative for all three variants. Unfortunately, data regarding three-dimensional structure of the C-terminal domain is not available. CLS, centrosome localization signal; KHD, kinesin homology domain; NLS, nuclear localization signal; TV, transcription variant.
Fig. 6.
Fig. 6.
Posttranslational modification of human CK1δ. Identified posttranslational modifications of CK1δ TV1 are indicated at their reported positions. Because most modifications have been reported for the C-terminal domain, this domain is depictured in a stretched presentation compared to the kinase domain. In the case of phosphorylation the distinction is made between reports of low-throughput studies and high-throughput studies. The figure was created based on information provided for CK1δ by PhosphoSitePlus® (Hornbeck et al., 2015). HTP, high-throughput studies, LTP, low-throughput studies, TV, transcription variant.
Fig. 7.
Fig. 7.
The three transcription variants of CK1δ show significant differences in their kinetic parameters and their (auto-)phosphorylation status. Catalytical (CAT) enzyme activity [nmol/min/mg] was used as readout after having performed in vitro kinase reactions using radioactively labeled ATP to identify the amount of phosphorylated α-casein (A) and β-catenin (GST-β-catenin1–181) (B) of the three identified CK1δ TVs. Statistically significant differences between the whole curves of the TVs were tested by a Kruskal-Wallis test using an uncorrected Fisher’s LSD test as follow-up. * indicates p ≤ 0.05, ** indicates p ≤ 0.01, and *** indicates p < 0.001. (C) Analysis of the phosphorylation status of the different CK1δ transcription variants after autophosphorylation by two dimensional phosphopeptide analysis. The phosphopeptide analysis of TV3 clearly shows differences in major and minor phosphopeptides compared to the phosphopeptide maps of TV1 and TV2. Phosphopeptides A-E are present in all three CK1δ transcription variants, whereas phosphopeptides L, K, J, and M were only observed for TV1. Phosphopeptides O and N are only present in TV3. Figure panels in (C) showing phosphopeptide maps of CK1δ TV1 and TV2 are a derivative of “Fig. 2” published in Bischof et al. (2012), used under CC BY 4.0 (http://creativecommons.org/licenses/by/4.0/). CAT, catalytical; TV, transcription variant.
Fig. 8.
Fig. 8.
Expression trend frequency of different cancer types. Frequencies of patients following each expression trend for CK1δ are presented for all relevant cancer types. For each patient, log2 fold-change (log2FC) values greater than zero were considered to follow an over-expression trend, less than zero to follow an under-expression trend. Patients with log2FC = 0 were excluded from the dataset. Note that all patients are included in this graphic, irrespective of statistical significance of the trend. Data is based on the BioXpress online tool (Wan et al., 2015; Dingerdissen et al., 2018).

Similar articles

Cited by

References

    1. Abarca C, Albrecht U, Spanagel R, 2002. Cocaine sensitization and reward are under the influence of circadian genes and rhythm. Proc. Natl. Acad. Sci. U. S. A 99 (13), 9026–9030. - PMC - PubMed
    1. Agostinis P, Pinna LA, Meggio F, Marin O, Goris J, Vandenheede JR, Merlevede W, 1989. A synthetic peptide substrate specific for casein kinase I. FEBS Lett. 259 (1), 75–78. - PubMed
    1. Albornoz A, Yanez JM, Foerster C, Aguirre C, Pereiro L, Burzio V, Moraga M, Reyes AE, Antonelli M, 2007. The CK1 gene family: expression patterning in zebrafish development. Biol. Res 40 (2), 251–266. - PubMed
    1. Allocco JJ, Donald R, Zhong T, Lee A, Tang YS, Hendrickson RC, Liberator P, Nare B, 2006. Inhibitors of casein kinase 1 block the growth of Leishmania major promastigotes in vitro. Int. J. Parasitol 36 (12), 1249–1259. - PubMed
    1. Alquezar C, Salado IG, de la Encarnacion A, Perez DI, Moreno F, Gil C, de Munain AL, Martinez A, Martin-Requero A, 2016. Targeting TDP-43 phosphorylation by casein kinase-1delta inhibitors: a novel strategy for the treatment of frontotemporal dementia. Mol. Neurodegener 11 (1), 36. - PMC - PubMed

MeSH terms