Review
. 2019 Nov:63:1-11.
doi: 10.1016/j.mri.2019.07.017. Epub 2019 Jul 31.

Functional MRI and resting state connectivity in white matter - a mini-review

Affiliations
Review

Functional MRI and resting state connectivity in white matter - a mini-review

John C Gore et al. Magn Reson Imaging. 2019 Nov.

Abstract

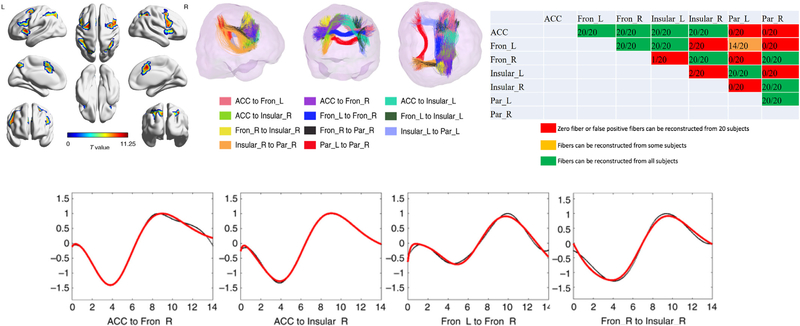
Functional MRI (fMRI) signals are robustly detectable in white matter (WM) but they have been largely ignored in the fMRI literature. Their nature, interpretation, and relevance as potential indicators of brain function remain under explored and even controversial. Blood oxygenation level dependent (BOLD) contrast has for over 25 years been exploited for detecting localized neural activity in the cortex using fMRI. While BOLD signals have been reliably detected in grey matter (GM) in a very large number of studies, such signals have rarely been reported from WM. However, it is clear from our own and other studies that although BOLD effects are weaker in WM, using appropriate detection and analysis methods they are robustly detectable both in response to stimuli and in a resting state. BOLD fluctuations in a resting state exhibit similar temporal and spectral profiles in both GM and WM, and their relative low frequency (0.01-0.1 Hz) signal powers are comparable. They also vary with baseline neural activity e.g. as induced by different levels of anesthesia, and alter in response to a stimulus. In previous work we reported that BOLD signals in WM in a resting state exhibit anisotropic temporal correlations with neighboring voxels. On the basis of these findings, we derived functional correlation tensors that quantify the correlational anisotropy in WM BOLD signals. We found that, along many WM tracts, the directional preferences of these functional correlation tensors in a resting state are grossly consistent with those revealed by diffusion tensors, and that external stimuli tend to enhance visualization of specific and relevant fiber pathways. These findings support the proposition that variations in WM BOLD signals represent tract-specific responses to neural activity. We have more recently shown that sensory stimulations induce explicit BOLD responses along parts of the projection fiber pathways, and that task-related BOLD changes in WM occur synchronously with the temporal pattern of stimuli. WM tracts also show a transient signal response following short stimuli analogous to but different from the hemodynamic response function (HRF) characteristic of GM. Thus there is converging and compelling evidence that WM exhibits both resting state fluctuations and stimulus-evoked BOLD signals very similar (albeit weaker) to those in GM. A number of studies from other laboratories have also reported reliable observations of WM activations. Detection of BOLD signals in WM has been enhanced by using specialized tasks or modified data analysis methods. In this mini-review we report summaries of some of our recent studies that provide evidence that BOLD signals in WM are related to brain functional activity and deserve greater attention by the neuroimaging community.


Figures

Fig. 1.
Fig. 1.
BOLD responses to a hypercapnia challenge in GM (left) and WM (right) on a normal human subject performed at 3 T. Effect in WM is lower than that of GM and takes longer to develop.
Fig. 2.
Fig. 2.
Variations of fractional power of low frequency fluctuations in BOLD signals with echo time in GM (red) and WM (blue). Reproduced with permission from [2]. (For interpretation of the references to color in this figure legend, the reader is referred to the web version of this article.)
Fig. 3.
Fig. 3.
Identification of language areas based on seed points in left Broca’s area using resting state fMRI. Reproduced with permission from [17].
Fig. 4.
Fig. 4.
Distributions of temporal correlations to seed points in left optic radiation (left) and corpus callosum (right) for two normal subjects. The correlations are clearly strongest in the tracts of the optic radiations when the seed point is in the left optic radiation. Voxels in the corpus callosum of both hemispheres tend to show much higher temporal correlations to the seed in right corpus callosum than the vast majority of other WM voxels. This finding suggests that analysis of signals within segmented tracts may increase detection of BOLD signals. Reproduced from [1]; use permitted under the Creative Commons Attribution License CC BY 4.0. https://creativecommons.org/licenses/by/4.0/
Fig. 5.
Fig. 5.
The top row was obtained without any diffusion weighting, using only correlations in resting state fluctuations - functional correlation tensors, at four different TEs. The bottom row shows functional correlation tensors constructed from M0 and R2* images, diffusion tensors and a derived FA map. Reproduced with permission from [2].
Fig. 6.
Fig. 6.
Spatio-temporal functional correlation tensors (FCTs) and diffusion tensors in the genu and splenium of the corpus callosum and the cingulum. From left to right columns are T1-weighted images, FCTs in the boxed region of the left column, and diffusion tensors in the same region. Top to bottom rows are the genu and splenium of the corpus callosum and the cingulum respectively. The pathways formed by the FCTs were grossly consistent with those revealed by diffusion tensors (red arrows). Reproduced with permission from [2]. (For interpretation of the references to color in this figure legend, the reader is referred to the web version of this article.)
Fig. 7.
Fig. 7.
Temporal variations of BOLD signals in S1, along the WM tract connecting thalamus and S1, along the tract connecting thalamus and pons, and background, averaged across twelve subjects. Red: task blocks. Blue: BOLD responses. Reproduced with permission from [4]. (For interpretation of the references to color in this figure legend, the reader is referred to the web version of this article.)
Fig. 8.
Fig. 8.
Time series of BOLD signals (top and middle rows) and their Fourier spectrua (bottom rows) in response to a simple alternating visual stimulus. Reproduced with permission from [5].
Fig. 9.
Fig. 9.
Distributions of the magnitude at the stimulus frequency in BOLD signals in WM and GM in response to a simple alternating visual stimulus. The MSF is thresholded at 0.4 MMSF for both WM and GM. Reproduced with permission from [5].
Fig. 10.
Fig. 10.
Top Left: Cortical areas activated by event-related Stroop test detected using standard GLM. Top middle: Major tracts traced between ROIs in activation map using DTI. Top right: Matrix of 7 regions identified along with indicators (colors) of regions between which WM fibers could be tracked in 20 subjects. Lower: the time courses averaged over multiple epochs of BOLD signals in 4 WM tracts from 20 subjects. Red line shows fit to double gamma variate function. Control WM tracts showed no significant changes and flat responses. Reproduced from [6]; use permitted under the Creative Commons Attribution License CC BY 4.0. https://creativecommons.org/licenses/by/4.0/ (For interpretation of the references to color in this figure legend, the reader is referred to the web version of this article.)
Fig. 11.
Fig. 11.
Variation of BOLD signal with flicker frequency. Upper left shows BOLD responses to flickering checker board (average of 12 subjects) in visual cortex. Upper right shows signal variation in WM and GM at different block presentation frequencies. Lower shows relative time series of signal changes in WM for different frequencies.
Fig. 12.
Fig. 12.
Matrix of temporal correlations between BOLD signals in WM bundles (vertical axis) and GM regions (horizontal axis) averaged over 12 young adults. The data were thresholded at mean CC > 0.3. Reproduced from [8] (PNAS authors need not obtain permission for using their original figures or tables in their future works).
Fig. 13.
Fig. 13.
Matrix of correlations>0.3 for 48 WM bundles (vertical axis) vs 68 cortical regions (horizontal axis) averaged over 172 young adults.

References

    1. Ding Z, Newton AT, Xu R, Anderson AW, Morgan VL, Gore JC. Spatio-temporal correlation tensors reveal functional structure in human brain. PLoS One 2013;8:e82107. - PMC - PubMed
    1. Ding Z, Xu R, Bailey SK, Wu T-L, Morgan VL, Cutting LE, et al. Visualizing functional pathways in the human brain using correlation tensors and magnetic resonance imaging. Magn Reson Imaging 2016;34:8–17. 10.1016/j.mri.2015.10.003. - DOI - PMC - PubMed
    1. Schilling KG, Gao Y, Li M, Wu T-L, Blaber J, Landman BA, et al. Functional tractography of white matter by high angular resolution functional-correlation imaging (HARFI). Magn Reson Med 2019;81:2011–24. 10.1002/mrm.27512. - DOI - PMC - PubMed
    1. Wu X, Yang Z, Bailey SK, Zhou J, Cutting LE, Gore JC, et al. Functional connectivity and activity of white matter in somatosensory pathways under tactile stimulations. Neuroimage 2017;152:371–80. 10.1016/j.neuroimage.2017.02.074. - DOI - PMC - PubMed
    1. Huang Y, Bailey SK, Wang P, Cutting LE, Gore JC, Ding Z. Voxel-wise detection of functional networks in white matter. Neuroimage 2018;183:544–52. 10.1016/j.neuroimage.2018.08.049. - DOI - PMC - PubMed

Publication types