. 2019:24:101947.
doi: 10.1016/j.nicl.2019.101947. Epub 2019 Jul 19.

The impact of ischemic stroke on connectivity gradients

Affiliations

The impact of ischemic stroke on connectivity gradients

Şeyma Bayrak et al. Neuroimage Clin. 2019.

Abstract

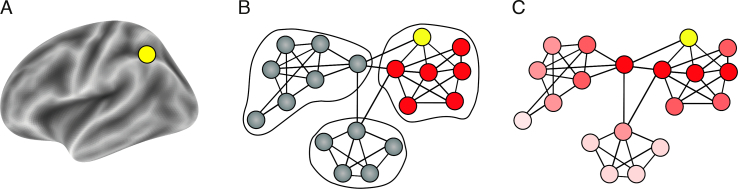
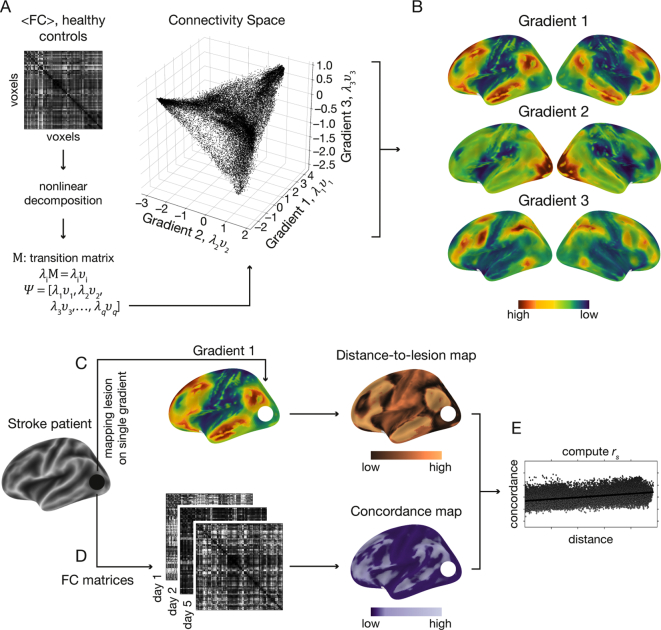
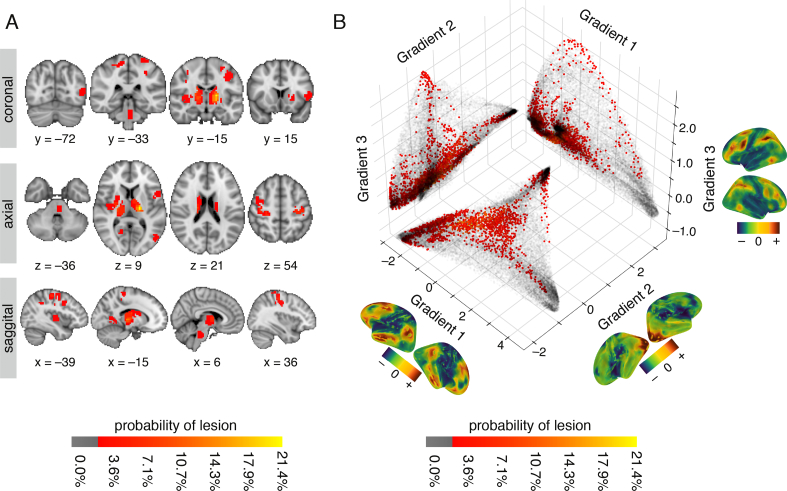
The functional organization of the brain can be represented as a low-dimensional space that reflects its macroscale hierarchy. The dimensions of this space, described as connectivity gradients, capture the similarity of areas' connections along a continuous space. Studying how pathological perturbations with known effects on functional connectivity affect these connectivity gradients provides support for their biological relevance. Previous work has shown that localized lesions cause widespread functional connectivity alterations in structurally intact areas, affecting a network of interconnected regions. By using acute stroke as a model of the effects of focal lesions on the connectome, we apply the connectivity gradient framework to depict how functional reorganization occurs throughout the brain, unrestricted by traditional definitions of functional network boundaries. We define a three-dimensional connectivity space template based on functional connectivity data from healthy controls. By projecting lesion locations into this space, we demonstrate that ischemic strokes result in dimension-specific alterations in functional connectivity over the first week after symptom onset. Specifically, changes in functional connectivity were captured along connectivity Gradients 1 and 3. The degree of functional connectivity change was associated with the distance from the lesion along these connectivity gradients (a measure of functional similarity) regardless of the anatomical distance from the lesion. Together, these results provide support for the biological validity of connectivity gradients and suggest a novel framework to characterize connectivity alterations after stroke.

Keywords: Connectivity gradients; Connectome; Diaschisis; Diffusion embedding; Intrinsic functional connectivity; Resting-state fMRI.


Conflict of interest statement

J. B. F. has received consulting, lecture, and advisory board fees from BioClinica, Cerevast, Artemida, Brainomix, Merck and Lundbeck. J.B·F., A.K.K., and K.V. are the co-inventors of European Patent application 17179320.01-1906.

Figures

Fig. 1
Fig. 1
Two complementary views on brain organization and the corresponding representation of distal effects of focal lesions. (A) A focal lesion (yellow node) on the brain anatomical surface. (B) A schematic description of discrete network parcellation superimposed on a functional connectivity graph-space with nodes and edges. Using this approach to study the effects of focal lesions (yellow node) restricts us to singular networks and assigns connector hubs to one network only. Additionally, distal effects of the lesion are assumed to be equally disruptive for all nodes in the affected network (red nodes). (C) Representing functional connectivity in a continuous manner without sharply defined borders using connectivity gradients. The lesioned node affects all other nodes in the system as a function of the distance from the lesion in connectivity space (dark red to light red). Using this approach does not assume sharp boundaries between functional networks and provides a more realistic model of distant effects of localized lesions.
Fig. 2
Fig. 2
A schematic description of the analysis steps. (A) Averaged functional connectivity matrix () based on the resting-state fMRI data of 28 healthy subjects. As an alternative to parcellation approaches, the functional connectivity matrix was decomposed into a low dimensional representation using the diffusion embedding algorithm. The scatter plot shows the first 3 eigenvectors (i.e., gradients) used for further analysis: Gradient 1 (x-axis), 2 (y-axis) and 3 (z-axis). Values on each axis depict the embedding values. Voxels are arranged along each dimension based on the similarity of their connectivity pattern, with voxels sharing similar connectivity patterns sharing similar embedding values. (B) Embedding values along single gradients are overlaid on the brain surface to visualize the dissociation they capture. Along Gradient 1, transmodal areas (default-mode network, red) share similar embedding values. At the other extreme of Gradient 1, unimodal sensory areas (blue) share similar embedding values. Gradient 1 therefore represents a dissociation between transmodal and unimodal areas on its two extremes. Gradient 2 depicts the dissociation between the visual network (red), and sensorimotor networks (green-blue). Gradient 3 depicts the dissociation between attention/memory networks (red) and default-mode network as well as sensorimotor network (green-blue). (C) Individual lesions were delineated and located along gradients. An example of a lesion located in the left occipital lobe is shown here (black circle). The distance from each voxel and the lesioned site was computed to create a voxelwise map reflecting the similarity of each voxel's connectivity pattern with that of the lesion for each gradient (“distance-to-lesion” map). This was done by subtracting the embedding values between each voxel and the mean embedding value of the lesioned voxels. Voxels with lower values on the distance map (dark copper) share similar functional connectivity patterns with the lesioned site as characterized in healthy controls. (D) Voxelwise functional connectivity matrices (FC matrices) were computed for the three-consecutive resting-state fMRI scans following stroke onset. Concordance was used to quantify changes in functional connectivity patterns over time. Lower concordance values (dark purple) reflect a larger change in functional connectivity patterns over time. (E) For each gradient and each individual patient, Spearman's rank correlation coefficient (rs) was used to test the relationship between the voxel's connectivity similarity with the lesion and degree of change in functional connectivity over time. The lesioned voxels were excluded from this analysis to capture indirect, rather than local, effects of the lesion. A positive correlation reflects a larger change in functional connectivity over time for voxels that were closer to the lesion site along the corresponding connectivity gradient.
Fig. 3
Fig. 3
Lesion location across patients shown in anatomical space and along connectivity gradients (A) Anatomical lesion distribution in individual stroke patients (n = 28) projected onto an MNI brain. The red-to-yellow color bar indicates the percentage of patients with lesions in that voxel. (B) Location of lesions projected onto the first three connectivity gradients. The three connectivity gradients represent a low-dimensional description of the whole-brain connectivity matrix obtained using healthy controls' data (n = 28). Corresponding spatial maps of each connectivity gradient are projected on brain surface mesh near respective axes. Colors represent positive (sienna) and negative (dark blue) embedding values, in accordance with values along the axes. Along each gradient, voxels that share similar connectivity patterns are situated close to one another and have similar embedding values. Grey scatter plots depict a two-dimensional connectivity space created as a combination of any two given gradients. Lesion location along each gradient is projected onto the two-dimensional space as an alternative approach to anatomical lesion mapping. The red-to-yellow color bars indicates the percentage of patients with lesions in that voxel. Lesioned voxels are mostly clustered around the edges of the connectivity gradients such that they affect sensorimotor areas and ventral and dorsal areas associated with attention.
Fig. 4
Fig. 4
The relationship between voxelwise similarity to the connectivity patterns of lesioned areas and the degree of changes in functional connectivity in non-lesioned voxels over time. (A) Correlation values between distance-to-lesion and concordance (y-axis) are shown for individual patients and the three connectivity gradients (x-axis). The spatial map of each connectivity gradient is shown below the respective location on the x-axis. Correlations were significantly positive for Gradient 1 (P = .0027, W = 71.0, one-tailed Wilcoxon signed-rank test) and Gradient 3 (P = .0001, W = 35.0), but not for Gradient 2 (P = .76, W = 189.0). The more similar a voxel's connectivity pattern is to that of lesioned voxels on connectivity Gradients 1 and 3, the more pronounced its functional connectivity changes over time. (B) Continuous connectivity gradients and corresponding seven canonical resting-state networks (Thomas Yeo et al., 2011). Voxels are situated based on their embedding values along Gradient 1 (x-axis) and 3 (y-axis) and colored according to their network assignment. Gradient 1 captures the dissociation between the default-mode network (DMN) and the sensorimotor networks on its two edges, while Gradient 3 captures the dissociation between dorsal attention/fronto-parietal networks and sensorimotor/DMN networks on its two edges. Lesion distributions along connectivity gradients are overlaid on the individual gradient axes. Lesions overlap most frequently with the lowest ends of Gradients 1 and 3.

References

    1. Aerts H., Fias W., Caeyenberghs K., Marinazzo D. Brain networks under attack: robustness properties and the impact of lesions. Brain. 2016;139:3063–3083. - PubMed
    1. Alstott J., Breakspear M., Hagmann P., Cammoun L., Sporns O. Modeling the impact of lesions in the human brain. PLoS Comput. Biol. 2009;5 - PMC - PubMed
    1. Andrews R.J. Transhemispheric diaschisis. A review and comment. Stroke. 1991;22:943–949. - PubMed
    1. Antonenko D., Schubert F., Bohm F., Ittermann B., Aydin S., Hayek D., Grittner U., Flöel A. tDCS-induced modulation of GABA levels and resting-state functional connectivity in older adults. J. Neurosci. 2017;37:4065–4073. - PMC - PubMed
    1. Atasoy S., Donnelly I., Pearson J. Human brain networks function in connectome-specific harmonic waves. Nat. Commun. 2016;7:1–10. - PMC - PubMed

Publication types