. 2019 Oct:91:103144.
doi: 10.1016/j.bioorg.2019.103144. Epub 2019 Jul 24.

Lysosome imaging in cancer cells by pyrene-benzothiazolium dyes: An alternative imaging approach for LAMP-1 expression based visualization methods to avoid background interference

Affiliations

Lysosome imaging in cancer cells by pyrene-benzothiazolium dyes: An alternative imaging approach for LAMP-1 expression based visualization methods to avoid background interference

Chathura S Abeywickrama et al. Bioorg Chem. 2019 Oct.

Abstract

A series of pyrene-benzothiazolium dyes (1a-1d) were experimentally investigated to study their internalization mechanism into cellular lysosomes as well as their potential imaging applications for live cell imaging. The lysosome selectivity of the probes was further compared by using fluorescently tagged lysosome associated membrane protein-1 (LAMP-1) expression-dependent visualization in both normal (COS-7, HEK293) and cancer (A549, Huh 7.5) cell lines. These probes were successfully employed as reliable lysosome markers in tumor cell models, thus providing an attractive alternative to LAMP-1 expression-dependent visualization methods. One advantage of these probes is the elimination of significant background fluorescence arising from fluorescently tagged protein expression on the cell surface when cells were transfected with LAMP-1 expression plasmids. Probes exhibited remarkable ability to stain cellular lysosomes for long-term experiments (up to 24 h) and the highly lipophilic nature of the probe design allowed their accumulation in hydrophobic regions of the cellular lysosomes. Experimental evidences indicated that the probes are likely to be internalized into lysosomes via endocytosis and accumulated in the hydrophobic regions of the lysosomes rather than in the acidic lysosomal lumen. These probes also demonstrated significant stability and lysosome staining for fixed cell imaging applications as well. Lastly, the benzothiazolium moiety of the probes was identified as the key component for lysosome selectivity.


Conflict of interest statement

Competing Interests

Authors declare no competing interests.

Figures

Figure 1.
Figure 1.
Absorbance and emission spectra of 1b (1 x 10⁻⁵ M) in different solvents at room temperature. Probes were excited at 500 nm to obtain emission spectra.
Figure 2.
Figure 2.
Fluorescence confocal microscopy images of COS-7 cells incubated with probe 1b (500 nM) for 30 minutes under different co-localization methods. Images a – i represents LysoTracker® Green DND-26 (70 nm, a), probe 1b (b,e,h), CellLight® lysosome-GFP expression (d), mTuquoise-Lysosome-20 expression (g) and respective overlapped images (c,f,i). Probe 1b was excited with a 561 nm laser and Lysotracker® Green and CellLight® Lysosome-GFP were excited with a 488 nm laser line. mTurquoise-Lysosome-20 expression was visualized by a 454 nm laser. All images were obtained at 63x oil magnification.
Figure 3.
Figure 3.
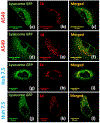
Fluorescence confocal microscopy images of CellLight® Lysosome-GFP transfected A549 and Huh 7.5 cells incubated for 30 minutes with probe 1b and 1d (500 nM). Images a,d,h and j shows fluorescence microscope images of CellLight®Lysosome-GFP expression, images b and h represents images of probe 1b and Images e and k represents images of probe 1d. Images c,f,l, and l represents overlapped figures for 1b (c,i) and 1d (f,l)with Lysosome-GFP. Probe 1b and 1d were excited with a 561 nm laser and Lysosome-GFP was excited with 488 nm laser line. All images were obtained at 63x oil magnification.
Figure 4.
Figure 4.
Fluorescent confocal microscopy images of transfected A549 cells stained with probe 1b (500 nM) for 30 minutes at 63x magnification using an oil objective. Images (a) – (c) represents GFP-C1-PLCδ-PH transfected COS-7 cells (plasma membrane) and images (d) – (f) represents Turquoise-H2A-10 transfected cells (nucleus). Images from left to right represents the confocal imaging of GFP-C1-PLCδ-PH expression (a), Turquoise-H2A-10 expression (d), Probe 1b (b,e) and overlapped images (c,f). Probes 1b was excited with 561 nm laser line, GFP-C1-PLCδ-PH was excited with 488 nm laser line and pm Turquoise-H2A-10 was excited with 454 nm laser line.
Figure 5.
Figure 5.
(a). Fluorescence confocal microscopy images of A549 cells (live) incubated with probe 1b (500 nM) for 30 min. (b). Fluorescence confocal microscopy images of A549 cells (fixed) incubated with probe 1b (500 nM) for 30 min. Figures (c) to (e) represents fluorescence confocal microscopy images of mTurquoise-H2A-10 transfected A549 cells (fixed) incubated with probe 1b (500 nM) for 30 min. Figures in the bottom row (from left to right) represents, mTurquoise-H2A-10 expression (c), probe 1b staining (d), and composite image (e). Probe 1b was excited with a 561 nm laser and pm Turquoise-H2A-10 was excited with 454 nm laser line. All images were obtained at 63x oil magnification.
Figure 6.
Figure 6.
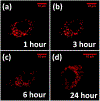
Fluorescence confocal microscopy images of A549 cells incubated with 1b (500 nM) for a 1 hr. – 24 hr period. Images were obtained at different time intervals including (a) 1 hour, (2) 3 hour, (c) 6 hour, and (d) 24 hour. Probe 1b was excited with 561 nm laser line.
Figure 7.
Figure 7.
Schematic representation of the possible mechanism how probes 1 localized in to cellular lysosomes via endocytosis.
Figure 8.
Figure 8.
Fluorescence emission of 1d (1 x 10⁻⁵ M) in different aqueous and hydrophobic environments at room temperature.
Figure 9.
Figure 9.
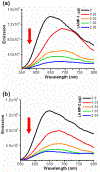
Fluorescence spectra obtained for prone 1d (1 x 10⁻⁵ M) in PBS buffer (PH 7.4) upon spectrometric titration of 5% LAMP-1 (a), 5% LAMP-2 (b), and 5% HAS (c) at room temperature. Figure (d) represents the variation of the normalized fluorescence intensity for all 3 spectrometric protein titrations. Probe 1d was excited at 510 nm.
Figure 9.
Figure 9.
Fluorescence spectra obtained for prone 1d (1 x 10⁻⁵ M) in PBS buffer (PH 7.4) upon spectrometric titration of 5% LAMP-1 (a), 5% LAMP-2 (b), and 5% HAS (c) at room temperature. Figure (d) represents the variation of the normalized fluorescence intensity for all 3 spectrometric protein titrations. Probe 1d was excited at 510 nm.
Figure 10.
Figure 10.
Confocal microscope images obtained for COS-7 cells upon incubation with probe 1d (500 nM) for 30 minutes in the absence (a - c) and presence (d – i) of the endocytosis inhibitors Pitstop® 2 (25 μM, d – f) and Dyansore® (80 μM, g - i). Probe 1d was excited with a 561 nm laser. The scale bar is 25 μm.
Scheme 1.
Scheme 1.
Brief comparison of current lysosome probes designs vs pyrene-based probes 1.

References

    1. Yapici NB, Bi Y, Li P, Chen X, Yan X, Mandalapu SR, Faucett M, Jockusch S, Ju J, Gibson KM, Highly stable and sensitive fluorescent probes (LysoProbes) for lysosomal labeling and tracking, Sci. Rep 5 (2015) 1–8. - PMC - PubMed
    1. Parkinson-Lawrence EJ, Shandala T, Prodoehl M, Plew R, Borlace GN, Brooks DA, Lysosomal storage disease: revealing lysosomal function and physiology, Physiology. 25 (2010)102–115. - PubMed
    1. Kirkegaard T, Jäättelä M, Lysosomal involvement in cell death and cancer, Biochim. Biophys. Acta - Mol. Cell Res 1793 (2009) 746–754. - PubMed
    1. Maes H, Agostinis P, Autophagy and mitophagy interplay in melanoma progression, Mitochondrion. (2014) 58–68. - PubMed
    1. Honscheid P, Datta K, Muders MH, Autophagy: detection, regulation and its role in cancer and therapy response, Int J Radiat Biol. 90 (2014) 628–635. - PubMed

Publication types