Review
. 2019 Jan 15:139:16-31.
doi: 10.1016/j.addr.2018.06.022. Epub 2018 Jul 3.

Molecular imaging of β-cells: diabetes and beyond

Affiliations
Review

Molecular imaging of β-cells: diabetes and beyond

Weijun Wei et al. Adv Drug Deliv Rev. .

Abstract

Since diabetes is becoming a global epidemic, there is a great need to develop early β-cell specific diagnostic techniques for this disorder. There are two types of diabetes (i.e., type 1 diabetes mellitus (T1DM) and type 2 diabetes mellitus (T2DM)). In T1DM, the destruction of pancreatic β-cells leads to reduced insulin production or even absolute insulin deficiency, which consequently results in hyperglycemia. Actually, a central issue in the pathophysiology of all types of diabetes is the relative reduction of β-cell mass (BCM) and/or impairment of the function of individual β-cells. In the past two decades, scientists have been trying to develop imaging techniques for noninvasive measurement of the viability and mass of pancreatic β-cells. Despite intense scientific efforts, only two tracers for positron emission tomography (PET) and one contrast agent for magnetic resonance (MR) imaging are currently under clinical evaluation. β-cell specific imaging probes may also allow us to precisely and specifically visualize transplanted β-cells and to improve transplantation outcomes, as transplantation of pancreatic islets has shown promise in treating T1DM. In addition, some of these probes can be applied to the preoperative detection of hidden insulinomas as well. In the present review, we primarily summarize potential tracers under development for imaging β-cells with a focus on tracers for PET, SPECT, MRI, and optical imaging. We will discuss the advantages and limitations of the various imaging probes and extend an outlook on future developments in the field.

Keywords: Diabetes; Magnetic resonance imaging (MRI); Molecular imaging; Optical imaging; Positron emission tomography (PET); Single-photon emission computed tomography (SPECT); Theranostics; β-Cells.


Figures

Fig. 1
Fig. 1
Noninvasive molecular imaging of β-cells. Abbreviations: VDCC, voltage-dependent Ca2+ channel; GLUT, glucose transporter; 18F-FDG, 18F-fluorodeoxyglucose; DA, dopamine; VMAT2, vesicular monoamine transporter-2; DTBZ, dihydrotetrabenazine; Trp, tryptophan; 5-HTP, 5-hydroxytryptophan; LAT, L-type amino acid transporter; GLP-1R, glucagon-like peptide 1 receptor.
Fig. 2
Fig. 2
Representative manganese-, VMAT2- and GLP-1R-based PET tracers and corresponding in vivo imaging results. (A) 52Mn2+-PET imaging in healthy ICR mice (left) and STZ-induced type 1 diabetic mice (right). Note that STZ-diabetic ICR mice showed clearly reduced 52Mn2+ uptake in the pancreas (B) Coronal PET images acquired at 1 h after 52Mn2+ administration in C57BL/6J control mice (left) and ob/ob prediabetic mice (right). 52Mn2+ accumulation in the pancreas of ob/ob mice was significantly higher than that in the wild-type C57BL/6J mice, indicating that application of 52Mn2+-PET imaging may precisely detect diabetes even in the early compensation phase. The pancreas (P) is demarcated by white dashed contours. (C) While 18F-FP-(+)-DTBZ PET imaging acquired for healthy control subject showed high uptake of the tracer in the pancreas (left), the corresponding pancreas uptake was reduced in patients with type 1 diabetes (right). Concentration of radioactivity normalized by standardized uptake value (SUV) was significantly lower in the pancreas of patients with T1DM (10.7 ± 2.6, n = 7) than that in the control subjects (17.2 ± 4.0, n = 9). (D) Biodistribution performed 60 and 80 min after intravenous administration of 68Ga-DO3A-exendin-4. Results showed that uptake in rats with STZ-induced diabetes decreased by more than 80% at both time points compared with that in healthy controls. Asterisks indicate statistical significance. (E) 68Ga-DO3A-exendin-4 scanning showed pancreatic uptake in diabetic pigs. Competition with unmodified exendin-4 in excess abolished the pancreatic tracer uptake (right), indicating that the tracer uptake is GLP-1R mediated. Although GLP-1R specific, 68Ga-DO3A-exendin-4 may not be the most optimal β-cell imaging probe. The pancreas was indicated by an arrow. Adapted with permission from [26,45,105,108].
Fig. 3
Fig. 3
Representative optical imaging probes specific for β-cells. (A) PET imaging using the bimodal imaging (PET/fluorescence) probe 64Cu-E4-Fl successfully detected GLP-1R positive 916-1 insulinoma in a female nude mouse (left). 64Cu-E4-Fl was specific to GLP-1R because blocking studies with unmodified peptide substantially reduced tracer uptake (right). The tumor is indicated by a yellow arrow. (B) H&E, NIR, and phosphor autoradiography images of a resected pancreatic slide. As fluorescently labeled sarcophagine 5 was conjugated with 64Cu in the 64Cu-E4-Fl probe, excellent correlation of both imaging modalities with regard to islet visualization was observed. PAMAM-rhodamine-X-glibenclamide conjugates (probe C) showed specific binding to SUR1 positive MIN6 cells (C), primary β-cells obtained from murine pancreas (D) and human islets (E). (F) After in vivo injection of probe C, both murine islet vessels (single arrows) and β-cells (double arrows) were labeled. Images are merged after staining with DAPI (blue), insulin (green), glucagon (turquoise) and probe C (red). Scale bar = 10 μm. (For interpretation of the references to colour in this figure legend, the reader is referred to the web version of this article.) Adapted with permission from [165,170].
Fig. 4
Fig. 4
MR images of intrahepatically transplanted syngeneic and allogeneic islets. (A) MR images of rat liver infused with FIONs-labeled syngeneic pancreatic islets at 4 d and 150 d after transplantation. The hypointense spots which represented labeled islets lasted for up to 150 d after transplantation. (B) H&E staining showed the normal structure of transplanted pancreatic islets in liver. (C) Prussian blue staining showed the presence of FIONs in islet β cells. (D) MR images of rat liver infused with FIONs-labeled allogeneic pancreatic islets immediately and 15 d after transplantation. The number of dark hypointense spots in the T2 MR image rapidly decreased after transplantation, indicating allograft rejection following the transplantation. (E) Immunohistochemical examination revealed iron in the islets 3 d after transplantation. (F) Clearance of the FIONs and infiltration of macrophages into the islets were observed. Adapted with permission from [212].
Fig. 5
Fig. 5
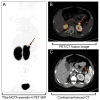
Value of 68Ga-NOTA-exendin-4 in the preoperative localization of insulinoma. Maximum-intensity-projection PET image (A) and axial PET/CT fusion image (B) obtained from a 10-y-old boy 1 h after injection of 48.1 MBq of 68Ga-NOTA-exendin-4. Red arrow showed intense uptake in the body of the pancreas (SUVmax, 27.1) and a mass near the spleen without obvious radiotracer concentration. (C) Arterial-phase contrast-enhanced CT image from same patient further showed an enhanced insulinoma (red arrow) and intrapancreatic accessory spleen (red arrowhead), both of which were subsequently confirmed by pathological examination. (For interpretation of the references to colour in this figure legend, the reader is referred to the web version of this article.) Adapted with permission from [28].

References

    1. Zhang P, Zhang X, Brown J, Vistisen D, Sicree R, Shaw J, Nichols G. Global healthcare expenditure on diabetes for 2010 and 2030. Diabetes Res Clin Pract. 2010;87:293–301. - PubMed
    1. Dabelea D, Mayer-Davis EJ, Saydah S, Imperatore G, Linder B, Divers J, Bell R, Badaru A, Talton JW, Crume T, Liese AD, Merchant AT, Lawrence JM, Reynolds K, Dolan L, Liu LL, Hamman RF S.f.D.i.Y. Study. Prevalence of type 1 and type 2 diabetes among children and adolescents from 2001 to 2009. JAMA. 2014;311:1778–1786. - PMC - PubMed
    1. W.H. Organization. Global Report on Diabetes. World Health Organization; 2016.
    1. Whiting DR, Guariguata L, Weil C, Shaw J. IDF diabetes atlas: global estimates of the prevalence of diabetes for 2011 and 2030. Diabetes Res Clin Pract. 2011;94:311–321. - PubMed
    1. A. American Diabetes. 2. Classification and diagnosis of diabetes: standards of medical Care in diabetes-2018. Diabetes Care. 2018;41:S13–S27. - PubMed

Publication types

MeSH terms