. 2019 Sep 3;30(3):447-461.e5.
doi: 10.1016/j.cmet.2019.07.004. Epub 2019 Aug 1.

Fatty Acid Metabolites Combine with Reduced β Oxidation to Activate Th17 Inflammation in Human Type 2 Diabetes

Affiliations

Fatty Acid Metabolites Combine with Reduced β Oxidation to Activate Th17 Inflammation in Human Type 2 Diabetes

Dequina A Nicholas et al. Cell Metab. .

Abstract

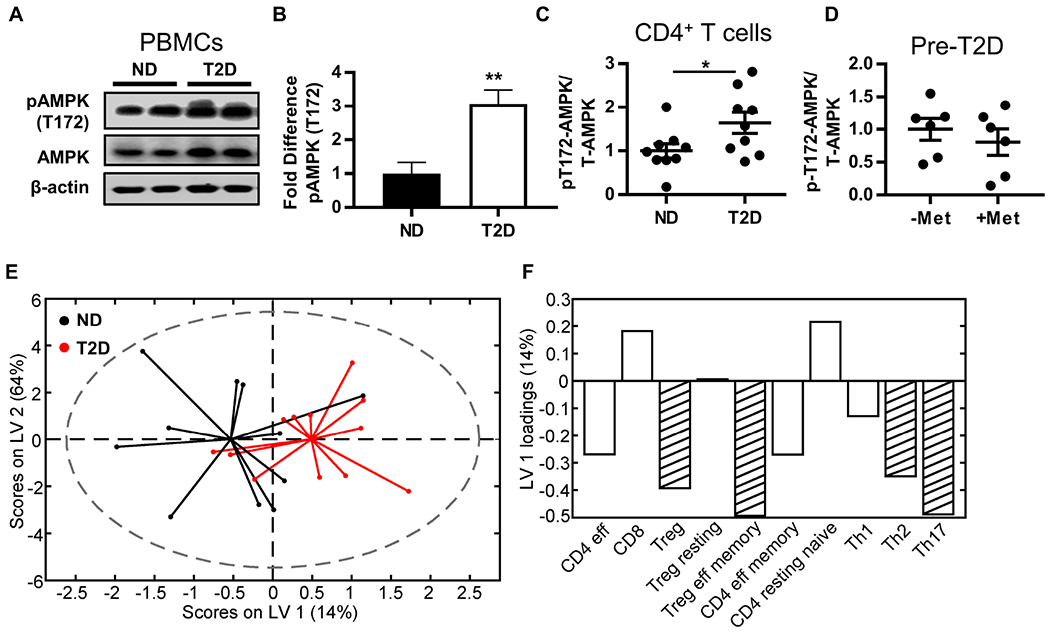
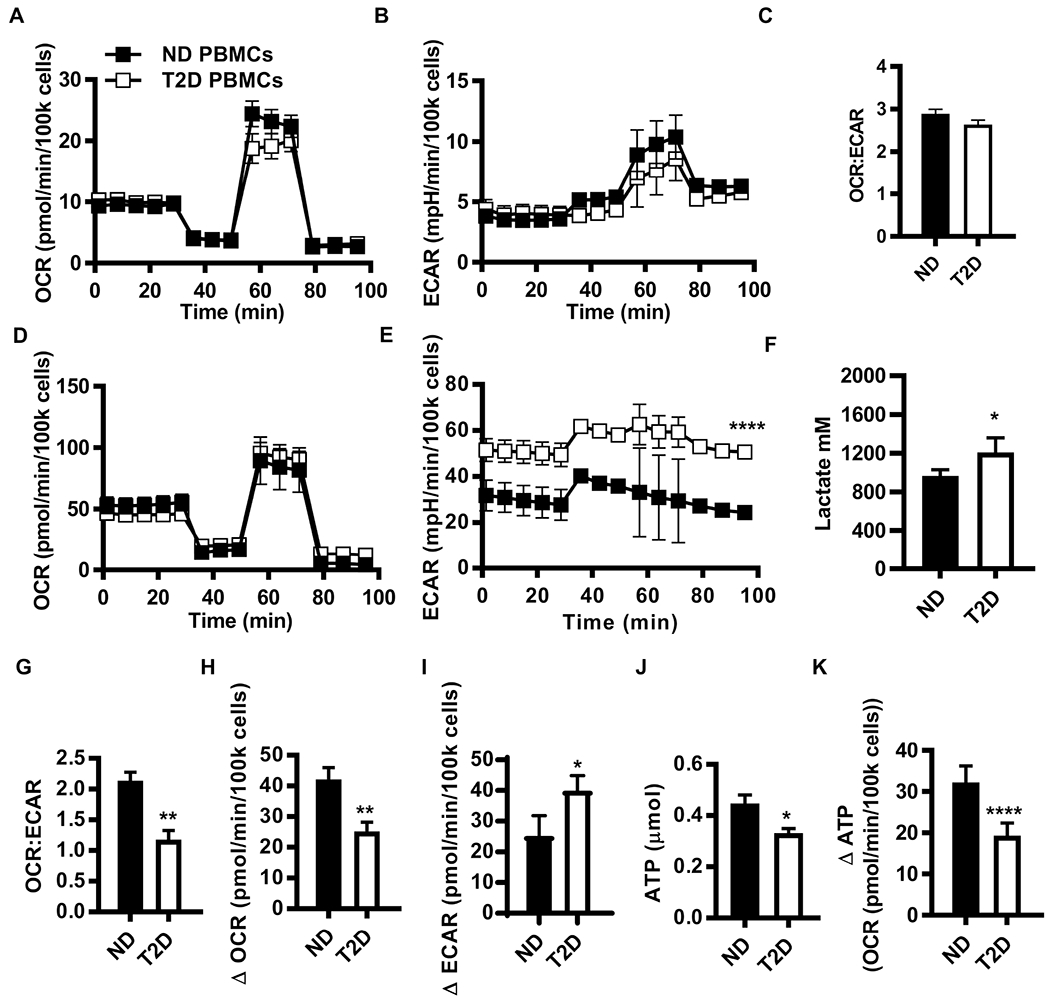
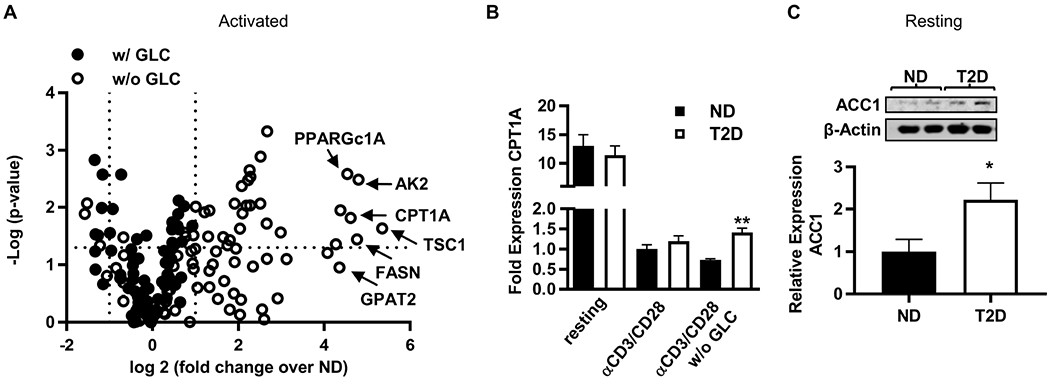
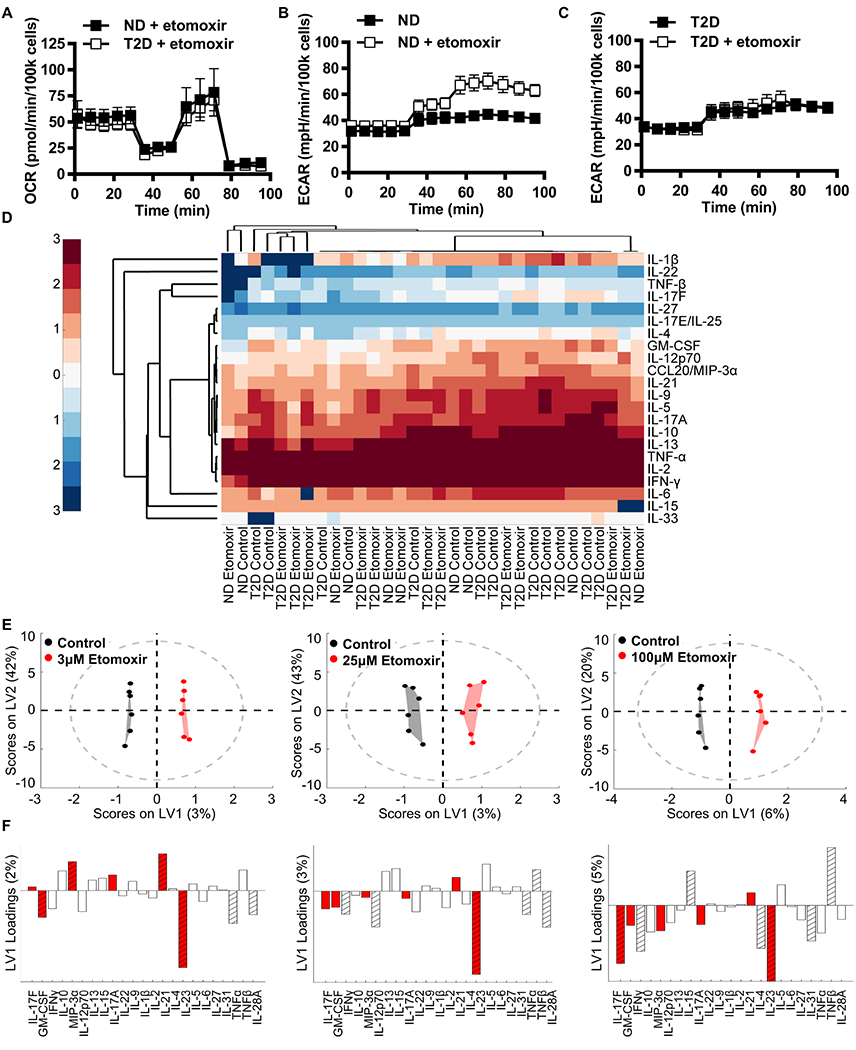
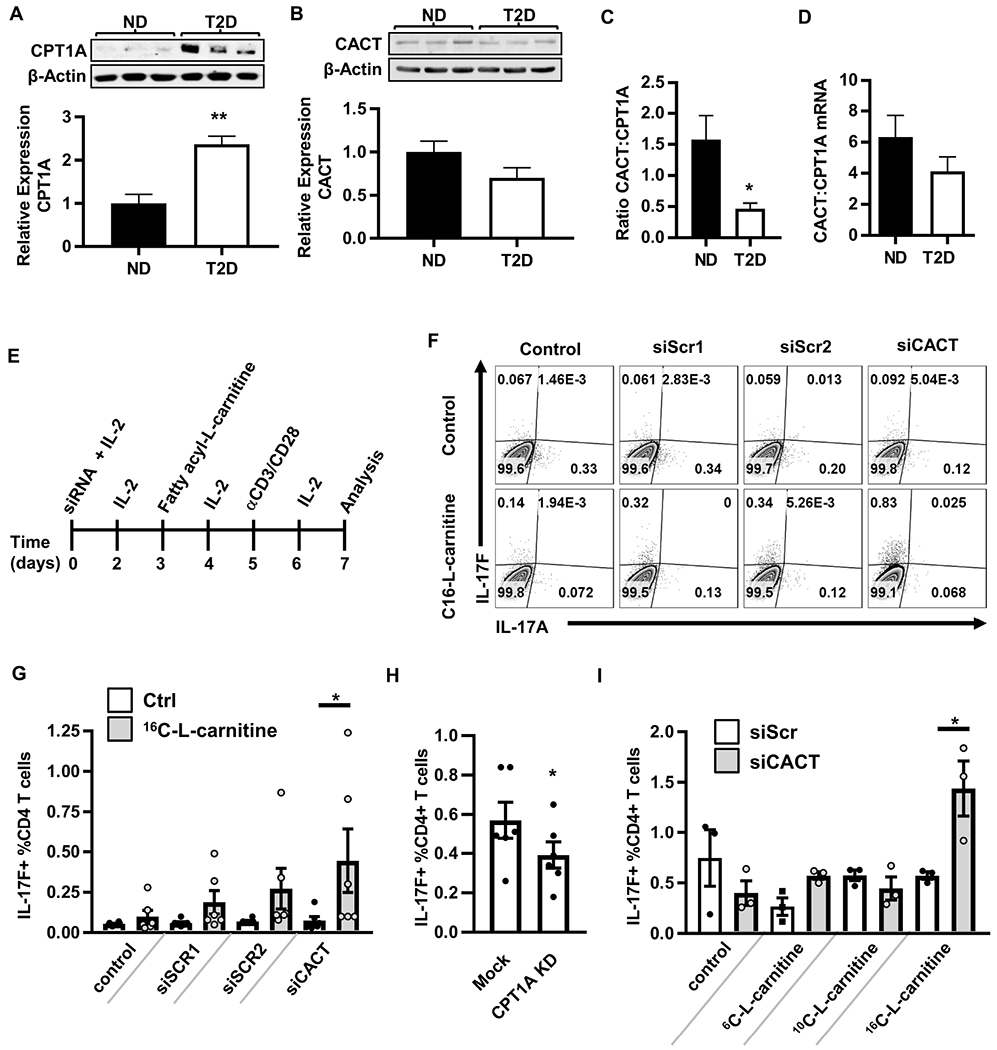
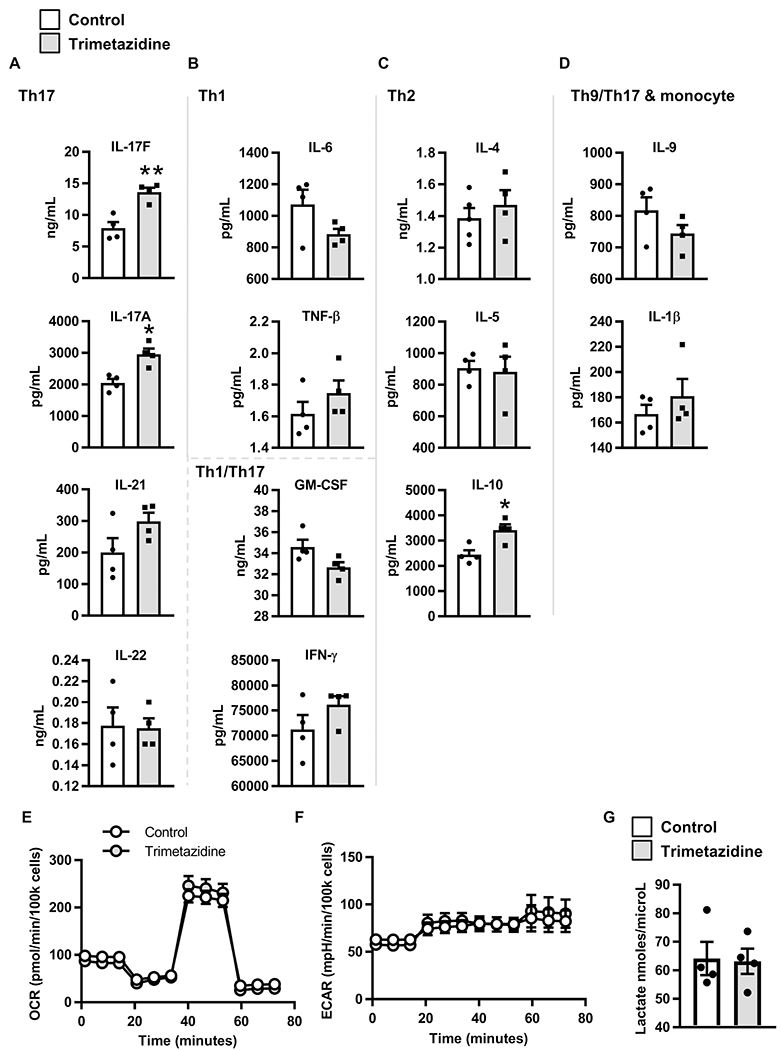
Mechanisms that regulate metabolites and downstream energy generation are key determinants of T cell cytokine production, but the processes underlying the Th17 profile that predicts the metabolic status of people with obesity are untested. Th17 function requires fatty acid uptake, and our new data show that blockade of CPT1A inhibits Th17-associated cytokine production by cells from people with type 2 diabetes (T2D). A low CACT:CPT1A ratio in immune cells from T2D subjects indicates altered mitochondrial function and coincides with the preference of these cells to generate ATP through glycolysis rather than fatty acid oxidation. However, glycolysis was not critical for Th17 cytokines. Instead, β oxidation blockade or CACT knockdown in T cells from lean subjects to mimic characteristics of T2D causes cells to utilize 16C-fatty acylcarnitine to support Th17 cytokines. These data show long-chain acylcarnitine combines with compromised β oxidation to promote disease-predictive inflammation in human T2D.

Keywords: fatty acid oxidation; glycolysis; immunometabolism; metaflammation.


Conflict of interest statement

Competing Financial Interests: The authors declare they have no competing financial interests.

Competing Interests: The authors have no competing interests relevant to the work.

Figures

Figure 1.
Figure 1.. Metabolic regulators differentiated PBMCs and CD4+ T cells from T2D and non-T2D (ND) subjects.
(A,B) Western blot quantification of pAMPK (T172) in resting PBMCs (ND, N=6; T2D, N=5) and (C) resting CD4+ T cells (N=9). (D) Western blot quantification of pAMPK in CD4+ T cells from pre-diabetes (pre-T2D) subjects who did or did not take metformin (1000mg/day). Differences were determined by two-tailed student’s t test with significance accepted at p < 0.05. (E,F) Orthogonalized partial least squares discriminant analysis model of mitochondrial mass measured by mitotracker green in PBMC cell subsets (Fig. S2). (E) Biplot from partial least squares discriminant analysis model shows that mitochondrial mass in PBMC cell populations distinguished ND (black) from T2D (red) PBMCs with 52% cross-validated prediction accuracy (approximately one standard deviation greater than the mean of 100 random models, or 68% confidence). (F) Loadings on latent variable 1 (orthogonalized) indicated lower mitochondrial mass in T2D as compared to ND in most immune cell populations. Stripes highlight cell populations with above average contribution to the difference in mitochondrial mass between T2D and ND as determined by variable importance in projection (VIP) scores > 1. See also Figure S1–S2 and Tables S1–S2.
Figure 2.
Figure 2.. PBMCs from subjects with T2D preferentially metabolize by glycolysis compared to PBMCs from ND subjects.
(A) OCR, (B) ECAR, and (C) OCR:ECAR ratio from mito stress test extracellular flux profiles for resting PBMCs from ND (N=17) and T2D (N=12) subjects. (D) OCR and (E) ECAR mito stress test extracellular flux profiles for 40 hr αCD3/αCD28-stimulated PBMCs from ND (N=10) and T2D (N=11) subjects. Differences are determined by repeated measures ANOVA with significance accepted at p < 0.05. (F) Lactate in conditioned media from ND (N=5) and T2D (N=6) PBMCs after 40 hr αCD3/αCD28 stimulation. (G) The OCR:ECAR ratio for 40 hr αCD3/αCD28 stimulated PBMCs. The absolute difference in basal OCR (H) and ECAR (I) between resting PBMCs (A,B) and 40 hr αCD3/αCD28-stimulated PBMCs (ND, N=10; T2D, N=11). (J) Direct measurement of ATP production by bioluminescence in resting ND (N=7) and T2D (N=6) PBMCs. (K) Fold change in ATP production due to 40 hr αCD3/CD28 activation of PBMCs. Differences are determined by two-tailed student’s t test with significance accepted at p < 0.05. See also Fig. S3 and Table S1.
Figure 3.
Figure 3.. Glucose uniquely decreased anti-inflammatory cytokine production in T2D.
PBMCs were stimulated with αCD3/αCD28 in media +/− glucose and pyruvate for 40 hr. The conditioned media was assayed for cytokine concentration by multiplex. (A) Heat map indicated cytokine secretion under glucose deprivation conditions. Control-subtracted cytokine concentrations were mean-centered and variance-scaled. Color bar represents Z-score. (B) Orthogonalized partial least squares discriminant analysis model distinguished cytokine profiles from ND (black) from T2D (red) cells under glucose deprivation conditions with 72% cross-validated prediction accuracy (greater than one standard deviation from the mean of 100 random models, or 71% confidence). (C) Orthogonalized partial least squares discriminant analysis model discriminated cytokine profiles produced by PBMCs from (left) ND subjects stimulated under glucose deprivation (red) or control (black) conditions with 90% cross-validated prediction accuracy (greater than one standard deviation from the mean of 100 random models, or 89% confidence), or (right) PBMCs from T2D with 73% prediction accuracy (greater than one standard deviation from the mean of 100 random models, or 90% confidence). (D) Loadings on latent variable 1 (orthogonalized) for ND (left) and T2D (right) models in panel C. Bars below midline show decreased cytokine production under 0 compared to 11 mM glucose media. Bars above midline show higher cytokine production under 0 compared to 11 mM glucose media. Cytokines with above average contribution to differences between control and glucose deprivation profiles as determined by variable importance in projection (VIP) score > 1 are striped. See also Figure S4 and S5.
Figure 4.
Figure 4.. Lipid metabolism distinguished T2D PBMCs from ND PBMCs.
(A) Volcano plot demonstrating the fold change of mRNA expression from T2D PBMCs (N=4) relative to ND PBMCs (N=4) stimulated with αCD3/αCD28 for 40 hr with (filled circles) or without (open circles) glucose/pyruvate (GLC). (B) Fold change in CPT1A mRNA from 40 hr cultured PBMCs (N=4; conditions as indicated) quantified by qRT-PCR. (C) Western blot quantification of ACC1 in resting PBMCs (ND, N=6; T2D, N=5). Differences were determined by two-tailed student’s t test with significance accepted at p < 0.05. Panels B and C show mean +/− SEM. See also Figure S5 and Tables S3,S4.
Figure 5.
Figure 5.. CPT1A activity supported Th17-associated cytokines prduction by PBMCs.
(A) OCR profiles from a mito stress test of ND and T2D PBMCs stimulated with αCD3/αCD28 under glucose deprivation +/− 100μM etomoxir for 40 hr (N=4). (B,C) ECAR profiles from a mito stress test of ND and T2D PBMCs stimulated as in panel A (N=4). (D) Conditioned media from cells in panels A-C were assayed for cytokine concentration by multiplex. Heat map clustergram (univariate analysis) of log10 cytokine concentrations in ND and T2D control or etomoxir-treated PBMCs as listed on the X axis. (E) Orthogonalized PLSDA model distinguishes cytokine secretion in control (black) from 3μM, 25μM, and 100μM etomoxir-treated (red) PBMCs in blended ND and T2D outcomes with 75%, 58.3% and 83.3% cross-validated prediction accuracy respectively (>1 SD from the mean of 100 random models, 80.5%, 68.8%, and 95.1% confidence respectively) (N=6). (F) Partial least squares discriminant analysis loadings on latent variable 1 (orthogonalized) indicated cytokines secreted at higher or lower concentrations (bars above or below the horizontal line, respectively) upon stimulation with etomoxir at the concentration indicated immediately above (panel E). Cytokines with above average contribution to discrimination between control and etomoxir treatment as determined by variable importance in projection (VIP) score > 1 are highlighted with stripes. Th17 cytokines are highlighted by red bars. See also Figure S4 and Figure S6.
Figure 6.
Figure 6.. Recapitulating mitochondrial changes characteristic of T2D in PBMCs from lean/normoglycemic subjects increases Th17/IL-17F+ cell frequencies.
(A,B) Representative Western blots and quantification of CPT1A (ND, N=4; T2D, N=3) and CACT (ND, N=7; T2D, N=5) in resting PBMCs. The average ratio of CACT to CPT1A protein (ND, N=5, T2D, N=3) (C) and mRNA (D) in ND (N=10) and T2D (N=11) PBMCs. (E) Experimental design. IL-2 is added to enhance cell survival. (F) Representative flow plots of cells treated with (left to right) vehicle control alone, each of two scrambled siRNA controls (1&2), or CACT-specific siRNA. Bottom row shows cells treated with 16C-L-carnitine alone (leftmost plot) or in addition to siRNA indicated at top of panel. (G) Percentages of IL-17F+CD4+ T cells +/− siCACT and +/− 16C-L-carnitine. (H) Percentages of IL-17F+CD4+ T cells +/− CPT1A knockdown by RNP-delivered CRISPR or mock CRISPR controls. Each dot shows results from one blood sample, with mean and SEM indicated. (I) Percentages of IL-17F+CD4+ T cells +/− siCACT and +/− 6C, 10C, or 16C-L-carnitine. Differences are determined by unpaired two-tailed student’s t test (A-D), repeated measures two-way ANOVA (G,I), or paired two-tailed student’s t test (H) with significance accepted at p < 0.05. N=3-6 for Panels G-I. See also Figure S7.
Figure 7.
Figure 7.. Inhibiting fatty acid oxidation increases secretion of Th17 cytokines.
PBMCs from lean subjects (N=4) were stimulated with αCD3/CD28 in media +/− trimetazidine for 40 hr. The conditioned media was assayed for cytokine concentration by multiplex. Concentration of (A) Th17 cytokines, (B) Th1 cytokines and pleiotropic Th1/Th17 cytokines, (C) Th2 cytokines, and (D) additional cytokines are expressed at mean +/− SEM. Data was analyzed by paired student’s t test and significance was accepted at p < 0.05. (E) OCR and (F) ECAR mito stress test extracellular flux profiles for 40 hr αCD3/CD28 stimulated PBMCs from lean subjects (N=4) +/− trimetazidine. (G) Lactate in conditioned media from lean PBMCs (N=4) after 40 hr αCD3/CD28 stimulation +/− trimetazidine.

Comment in

  • Glucose isn't always to blame.
    Morris A. Morris A. Nat Rev Endocrinol. 2019 Oct;15(10):564. doi: 10.1038/s41574-019-0252-0. Nat Rev Endocrinol. 2019. PMID: 31417193 No abstract available.

References

    1. Agilent Technologies, I. (2017). Agilent Seahorse XF Mito Fuel Flex Test Kit User Manual. (Wilmington, DE: ).
    1. Blagih J, Coulombe F, Vincent EE, Dupuy F, Galicia-Vazquez G, Yurchenko E, Raissi TC, van der Windt GJ, Viollet B, Pearce EL, et al. (2015). The energy sensor AMPK regulates T cell metabolic adaptation and effector responses in vivo. Immunity 42, 41–54. - PubMed
    1. Brand K (1985). Glutamine and glucose metabolism during thymocyte proliferation. Pathways of glutamine and glutamate metabolism. Biochem J 228, 353–361. - PMC - PubMed
    1. Brand K, Williams JF, and Weidemann MJ (1984). Glucose and glutamine metabolism in rat thymocytes. Biochem J 221, 471–475. - PMC - PubMed
    1. Cameron AR, Logie L, Patel K, Erhardt S, Bacon S, Middleton P, Harthill J, Forteath C, Coats JT, Kerr C, et al. (2018). Metformin selectively targets redox control of complex I energy transduction. Redox Biol 14, 187–197. - PMC - PubMed

Publication types

MeSH terms

LinkOut - more resources