. 2019 Oct 23;104(2):290-304.e8.
doi: 10.1016/j.neuron.2019.07.004. Epub 2019 Aug 1.

Inhibition of Axon Regeneration by Liquid-like TIAR-2 Granules

Affiliations

Inhibition of Axon Regeneration by Liquid-like TIAR-2 Granules

Matthew G Andrusiak et al. Neuron. .

Abstract

Phase separation into liquid-like compartments is an emerging property of proteins containing prion-like domains (PrLDs), yet the in vivo roles of phase separation remain poorly understood. TIA proteins contain a C-terminal PrLD, and mutations in the PrLD are associated with several diseases. Here, we show that the C. elegans TIAR-2/TIA protein functions cell autonomously to inhibit axon regeneration. TIAR-2 undergoes liquid-liquid phase separation in vitro and forms granules with liquid-like properties in vivo. Axon injury induces a transient increase in TIAR-2 granule number. The PrLD is necessary and sufficient for granule formation and inhibiting regeneration. Tyrosine residues within the PrLD are important for granule formation and inhibition of regeneration. TIAR-2 is also serine phosphorylated in vivo. Non-phosphorylatable TIAR-2 variants do not form granules and are unable to inhibit axon regeneration. Our data demonstrate an in vivo function for phase-separated TIAR-2 and identify features critical for its function in axon regeneration.

Keywords: C. elegans; LLPS; RNA granule; RNA-binding protein; TIA1; axon injury; axon regeneration; liquid-liquid phase separation; prion-like domain; stress granule; tiar-2.


Conflict of interest statement

Declaration of Interests

The authors declare no competing interest.

Figures
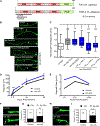
Figure 1:
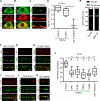
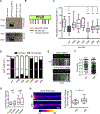
Figure 1:. tiar-2 is an intrinsic inhibitor of axon regeneration
A) C. elegans TIAR-2(Q9U2F5) has high sequence identity with human TIA1(P31483). TIA proteins consist of three RNA-recognition motifs (RRM) and a C-terminal prion-like domain (PrLD). The PrLD was determined using the Prion-Like Amino Acid Composition (PLAAC) algorithm (Lancaster et al., 2014). Percent identity was calculated for full-length proteins using Clustal Omega (http://www.ebi.ac.uk/Tools/msa/clustalo/). tiar-2 deletion alleles (ju1401 and tm2923) are indicated below TIAR-2. B) Representative confocal images of PLM axon regrowth 24 h post-axotomy in animals expressing zdIs5 [Pmec-4-GFP]. Genotypes in the top three images are as indicated, and those in the bottom three are in a tiar-2(tm2923) background with the transgenes indicated. Arrows indicate the site of axon injury. Scale bar, 10 μm. C) Quantification of PLM axon regrowth 24 h post-axotomy, normalized to same-day controls, is shown as a box and whisker plot. Number indicates animals analyzed. One-way ANOVA with Tukey’s post-hoc test; *P < 0.05; **P < 0.01; ***P<0.001; ns, not significant. D) PLM regrowth length over 48 h post-axotomy. Data points show mean ± SEM. Number of animals analyzed for 3, 6, 24 and 48 h: control (16, 28, 18, 16) and tiar-2(0) (18, 28, 17, 17). One-way ANOVA with Tukey’s post hoc test; **P < 0.01; ***P < 0.001 E) Axon regrowth rate of PLM neurons at the indicated intervals following axotomy. F) Representative confocal images of PLM axons 3 h post-axotomy. Arrow marks filopodia in tiar-2(0). Scale bar, 2 μm. G) Quantification of axons with filopodia (Filo) as %, 3 h post-axotomy. Number indicates animals analyzed. Fisher’s exact test; **P < 0.01. H) Representative confocal images of PLM axons 6 h post-axotomy. Asterisks marks growth cone in tiar-2(0). Scale bar, 2 μm. I) Quantification of axons with growth cones (GC) as %, 6 h post-axotomy. Number indicates animals analyzed. Fisher’s exact test; ***P < 0.001.
Figure 2.
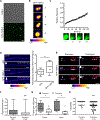
Figure 2.. TIAR-2 forms granules in vivo and overexpression of TIAR-2 inhibits axon regeneration
A) Left: Representative confocal images of GFP-TIAR-2 expression from a single-copy insertion transgene [juSi306] in a PLM axon. Asterisks (*) denote granules; Scale bar, 3 μm. Right: Graph shows quantification of PLM axons containing granules as %, Number indicates neurons scored. Fisher’s exact test; ***P < 0.001. B) Axon regrowth of PLM neurons 24 h post-axotomy, normalized to same-day tiar-2(0) animals, shown as a box and whisker plot. Number indicates animals analyzed. One-way ANOVA with Tukey’s post-hoc test; **P < 0.01; ***P < 0.001. C) Left: Representative confocal images show that GFP-TIAR-1[juEx7943] in mechanosensory neurons does not form granules, when expressed at similar levels as GFP-TIAR-2[juIs542]. Right: Graph shows quantification of PLM axons containing granules. Number indicates neurons scored. Fisher’s exact test; ***P < 0.001. D) Quantification of PLM axon regrowth 24 h post-axotomy, normalized to same-day controls, shown as a box and whisker plot. Number indicates animals analyzed. One-way ANOVA with Tukey’s post-hoc test; ***P<0.001; ns, not significant.
Figure 3.
Figure 3.. TIAR-2 granules in neurons are likely heterogenous
A) Representative confocal images showing mKate2-TIAR-2[juEx8008] granules colocalizes with GFP-TIAR-2[juIs542] granules in the PLM cell body. Scale 2 μm. B) Representative confocal images showing mKate2-TIAR-2[juEx8008] granules partially colocalize with GTBP-1-GFP[ax2053] granules in the PLM cell body. Scale 2 μm. C) Representative confocal images showing GFP-RAB-3[jsIs821] does not colocalize with tagRFP-Cox8A[jsIs1073] granules in the PLM cell body. Scale 2 μm. D) Quantification of colocalization for mKate2-TIAR-2 and GTBP-1-GFP, shown as a box and whisker plot. One-way ANOVA with Tukey’s post-hoc test; ***P<0.001; ns, not significant. E) Graph shows quantification of PLM axons containing GFP-TIAR-2[juIs542] granules in control and gtbp-1(0) backgrounds. Number indicates neurons scored. F) Representative confocal images showing GFP-TIAR-2[juIs542] granules colocalize with mKate2-TIAR-2[juEx8008]. Scale 2 μm. G) Representative confocal images showing GFP-TIAR-2[juIs542] granules do not colocalize with granules of mKate2-AIN-1[juEx7948] in the PLM axon. Scale 2 μm. H) Representative confocal images showing GFP-TIAR-2[juIs542] granules do not colocalize with the synaptic vesicle marker tagRFP-RAB-3[jsIs1263] in the PLM axon. Scale 2 μm. I) Representative confocal images showing GFP-TIAR-2[juIs542] granules do not colocalize with the active zone marker tagRFP-ELKS[jsIs1075] in the PLM axon Scale 2 μm. J) Representative confocal images showing GFP-TIAR-2[juIs542] granules do not colocalize with the mitochondrial marker tagRFP-Cox8A[jsIs1073] in the PLM axon. Scale 2 μm. K) Representative confocal images showing GFP-RAB-3[jsIs821], a synaptic vesicle marker, displays minimal colocalization with tagRFP-Cox8A[jsIs1073], a mitochondrial marker, in the PLM cell body. Scale 2 μm. L) Quantification of colocalization for the above red and green fluorescent tagged proteins, shown as a box and whisker plot. One-way ANOVA with Tukey’s post-hoc test; ***P<0.001; ns, not significant.
Figure 4.
Figure 4.. TIAR-2 undergoes liquid-liquid phase separation in vitro and forms granules with liquid-like features in vivo which change dynamics and increase in number following injury
A) Representative confocal images showing purified TIAR-2 and GFP-TIAR-2 liquid droplets, with 5 μg/μl purified protein supplemented with 10% PEG at room temperature. Scale bar, 2 μm. B) Representative confocal images showing purified GFP-TIAR-2 liquid droplets fusing. Images were pseudo-colored using the ‘Fire’ lookup table in FIJI. Scale bar, 5 μm. C) Relative fluorescence recovery (Y-axis) after photobleaching of purified GFP-TIAR-2 at the times indicated in the X-axis quantified using ZEN software and graphed with Prism V5.01. Representative images of GFP-TIAR-2 before and after photobleaching are shown below. D) Left: Representative confocal images show GFP[juSi10] and GFP-TIAR-2[juSi306] in PLM axons before and after axotomy. Images were pseudo-colored using the ‘Fire’ lookup table in FIJI. Arrow indicates the site of axon injury. Scale bar, 5 μm. Right: Quantification of GFP [juSi10] and GFP-TIAR-2[juSi306] granules 15min following axotomy, shown as a box and whisker plot. Number indicates animals analyzed. Student’s t-test, *P < 0.05. E) Representative spinning-disc confocal images of GFP-TIAR-2 [juIs542] in a PLM axon before and immediately after axotomy. Images were pseudo-colored using the ‘Fire’ lookup table in FIJI. White arrowhead marks granules undergoing a fusion event, whereas red arrowheads indicate granules undergoing fission, white arrows mark the site of axotomy. Scale bar, 2 μm. F) Quantification of net displacement of GFP-TIAR-2[juIs542] granules before and after axotomy, shown as a box and whisker plot. Number is granules analyzed, from 5 animals. Mann-Whitney U-Test, ***P<0.001. G) Quantification of GFP-TIAR-2[juIs542] granule fission and fusion events before and after axotomy, shown as box and whisker plot. Number indicates animals analyzed. Student’s T-test, *P < 0.05. H) Quantification of circularity of GFP-TIAR-2[juIs542] granules before and 15 min following axotomy, shown as a dot plot. Number is the number of granules analyzed, from 7 animals. Mann-Whitney U Test, ***P < 0.001.
Figure 5:
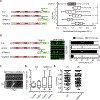
Figure 5:. The PrLD of TIAR-2 is necessary and sufficient for function in axon regeneration and for granule formation
A) Left: Schematics show GFP-TIAR-2 truncation mutants. Right: Quantification of the effects of TIAR-2 variants on axon regrowth using single-copy expression transgenes in a tiar-2(0) background, shown as a box and whisker plot. Number indicates animals analyzed. One-way ANOVA with Tukey’s post-hoc test; *P < 0.05; **P < 0.01. B) Left: Schematics of GFP-TIAR-2 truncation mutants. Middle: Representative confocal images of corresponding GFP-TIAR-2 expressed from multi-copy transgenes in PLM axons. Asterisks (*) denotes granules, Scale bar, 5 μm. Right: Quantification of PLM axons containing granules as %, Number indicates neurons scored. Fisher’s exact test; ***P < 0.001. C) Representative spinning disc confocal image (top) and kymograph (bottom) of GFP-TIAR-2 (ΔRRM1–3) in a PLM axon. Kymograph depicts 17 s of spinning disc imaging over 10 μm of axon. D) Quantification of GFP-TIAR-2(ΔRRM1–3)[juEx7864/7865] granule fission and fusion events, shown as a box and whisker plot. Number indicates animals analyzed. E) Quantification of circularity of GFP-TIAR-2(ΔRRM1–3)[juEx7864/7865] granules. Data shown as a dot plot. Number is granules analyzed, from 7 animals.
Figure 6.
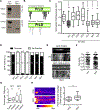
Figure 6.. Tyrosine residues in the PrLD of TIAR-2 regulate granule formation and activity in regeneration
A) Tyrosine phosphorylation of GFP-TIAR-2 is undetectable in mechanosensory neurons. Protein extracts were isolated from tiar-2(0); juSi306(Pmec-4-GFP-TIAR-2), and juIs24(VAB-1-GFP) animals, immunoprecipitated with anti-GFP and analyzed by western blot with antibodies recognizing phosphorylated tyrosine (top) and GFP (bottom). Predicted molecular weight: ~74 kDa for GFP-TIAR-2 and ~150 kDa for VAB-1-GFP. B) Schematics show the PrLD of TIAR-2 (Q9U2F5) with black lines (top) indicating Y>G mutations, and grey lines (bottom) for G>Y. Shortest lines represent the 3YG/3GY mutations, medium 6YG/5GY, and the longest 9YG/7GY. Mutations in shorter constructs are contained in the larger variants. C) Quantification of the effects of TIAR-2 tyrosine variants on axon regrowth using single-copy expression transgenes in a tiar-2(0) background, shown as a box and whisker plot. Number indicates animals analyzed. One-way ANOVA with Tukey’s post-hoc test; *P < 0.05; **P < 0.01. D) Graph shows quantification of PLM axons containing granules as %. Number indicates neurons scored. Fisher’s exact test; ***P < 0.001. E) Representative spinning disc confocal image (top) and kymograph (bottom) of GFP-TIAR-2[juSi542] and GFP-TIAR-2(3GY)[juEx7980] in a PLM axon. Kymograph was created using 17 s of spinning disc imaging and 10 μm of axon. F) Quantification of circularity of GFP-TIAR-2[juSi542] and GFP-TIAR-2(3GY)[juEx7980/7981]granules, shown as a dot plot. Number is granules analyzed, from 7 animals. G) Quantification of fission and fusion events of GFP-TIAR-2[juSi542] and GFP-TIAR-2(3GY)[juEx7980/7981] granules, shown as a box and whisker plot. Number indicates animals analyzed. H) Left: Representative confocal images of GFP-TIAR-2(3YG)[juSi385] and (3GY)[juSi381] 15 min post-axotomy. ‘Fire’ Lookup table used for visualization of intensity changes. Scale 2 μm. Arrow marks the site of axon injury. Right: Quantification of GFP-TIAR-2(3YG) and (3GY) granules 15min following axotomy, shown as a box and whisker plot. Number indicates animals analyzed. Unpaired Student’s T-test; *P < 0.05.
Figure 7.
Figure 7.. Serine residues in the PrLD of TIAR-2 regulate granule formation and activity in regeneration
A) GFP-TIAR-2 in mechanosensory neurons is phosphorylated. Protein extracts were isolated from tiar-2(0); juSi306(Pmec-4-GFP-TIAR-2), tiar-2(0); juSi307(Pmec-4-GFP-TIAR-2 (ΔRRM1–3), tiar-2(0); juSi376(Pmec-4-GFP-TIAR-2(10SA)), and tiar-2(0); juSi374(Pmec-4-GFP-TIAR-2(2SA)) animals, immunoprecipitated with anti-GFP and analyzed by western blot with antibodies recognizing phosphorylated serine (top) and GFP (bottom). GFP-TIAR-2 has a predicted molecular weight of ~74 kDa and GFP-TIAR-2(ΔRRM1–3) ~45 kDa. B) Schematic of TIAR-2 (Q9U2F5) PrLD with lines indicating mutated serine residues. Red lines represent 2S mutations, black 8S mutations and grey 10S. Mutations in shorter constructs are contained in the larger variants. C) Quantification of the effects of TIAR-2 serine variants on axon regrowth using single-copy expression transgenes in a tiar-2(0) background, shown as a box and whisker plot. Number indicates animals analyzed. One-way ANOVA with Tukey’s post-hoc test; *P < 0.05; **P < 0.01, ns not significant. D) Graph shows quantification of PLM axons containing granules as %. Number indicates neurons scored. Fisher’s exact test; ***P < 0.001. E) Representative spinning disc confocal image and kymograph of GFP-TIAR-2(2SE)[juEx7990] in a PLM axon. Kymograph was created using 17 s of spinning disc imaging and 10 μm of axon. F) Quantification of circularity of GFP-TIAR-2[juSi542] and GFP-TIAR-2(2SE) [juEx7990/7991] granules, shown as a dot plot. Number is granules analyzed, from 7 animals. Mann-Whitney U Test, ***P < 0.001. G) Quantification of fission and fusion events of GFP-TIAR-2[juSi542] and GFP-TIAR-2(2SE)[juEx7990/7991] granules, shown as a box and whisker plot. Number indicates animals analyzed. H) Left: Representative confocal images of GFP-TIAR-2(2SA)[juSi374] and (2SE)[juSi379] 15 min post-axotomy. Fire’ Lookup table used for visualization of intensity changes. Scale 2 μm. Arrow marks the site of axon injury. Right: Quantification of GFP-TIAR-2(2SE) and (2SA) granules 15min following axotomy, shown as a box and whisker plot. Number indicates animals analyzed. Unpaired Student’s T-test; *P < 0.05.

Comment in

References

    1. Alberti S, Gladfelter A, and Mittag T (2019). Considerations and Challenges in Studying Liquid-Liquid Phase Separation and Biomolecular Condensates. Cell 176, 419–434 - PMC - PubMed
    1. Alberti S, Saha S, Woodruff JB, Franzmann TM, Wang J, and Hyman AA (2018). A User’s Guide for Phase Separation Assays with Purified Proteins. J Mol Biol 430, 4806–4820 - PMC - PubMed
    1. Anderson EN, Gochenaur L, Singh A, Grant R, Patel K, Watkins S, Wu JY, and Pandey UB (2018). Traumatic injury induces Stress Granule Formation and enhances Motor Dysfunctions in ALS/FTD Models. Hum Mol Genet 27, 1366–1381 - PMC - PubMed
    1. Boeynaems S, Alberti S, Fawzi NL, Mittag T, Polymenidou M, Rousseau F, Schymkowitz J, Shorter J, Wolozin B, Van Den Bosch L, et al. (2018). Protein Phase Separation: A New Phase in Cell Biology. Trends Cell Biol 28, 420–435 - PMC - PubMed
    1. Boeynaems S, Bogaert E, Kovacs D, Konijnenberg A, Timmerman E, Volkov A, Guharoy M, De Decker M, Jaspers T, Ryan VH, et al. (2017a). Phase Separation of C9orf72 Dipeptide Repeats Perturbs Stress Granule Dynamics. Mol Cell 65, 1044–1055 e1045 - PMC - PubMed

Publication types

MeSH terms

Substances